

Quantitative Assessment of Stress Through EEG During a Virtual Reality Stress-Relax Session
- PMID: 34335216
- PMCID: PMC8317646
- DOI: 10.3389/fncom.2021.684423
Quantitative Assessment of Stress Through EEG During a Virtual Reality Stress-Relax Session
Abstract
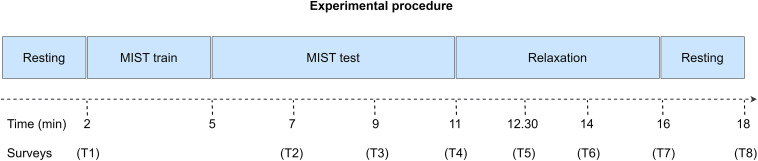
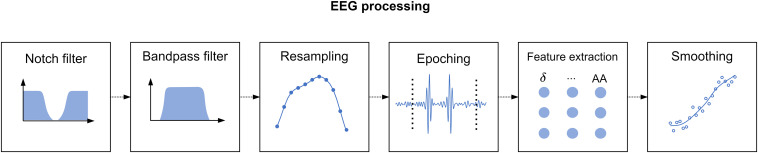
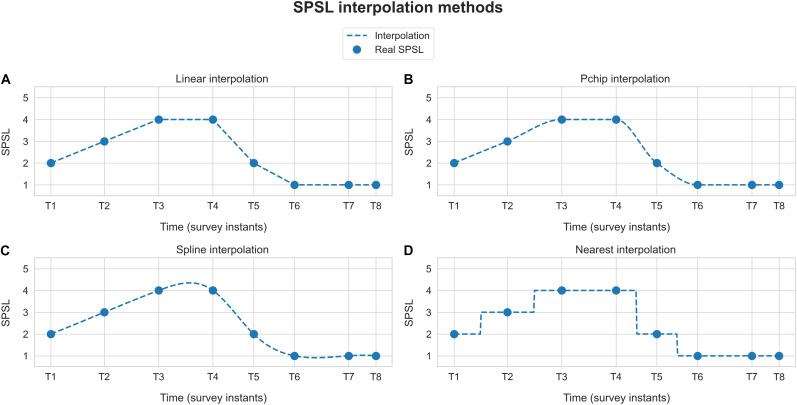
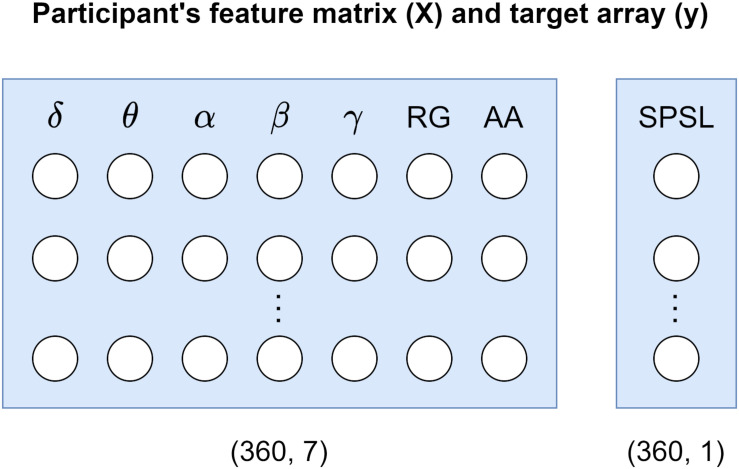
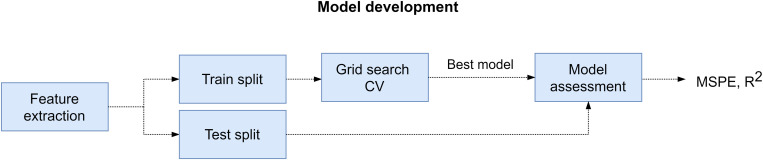
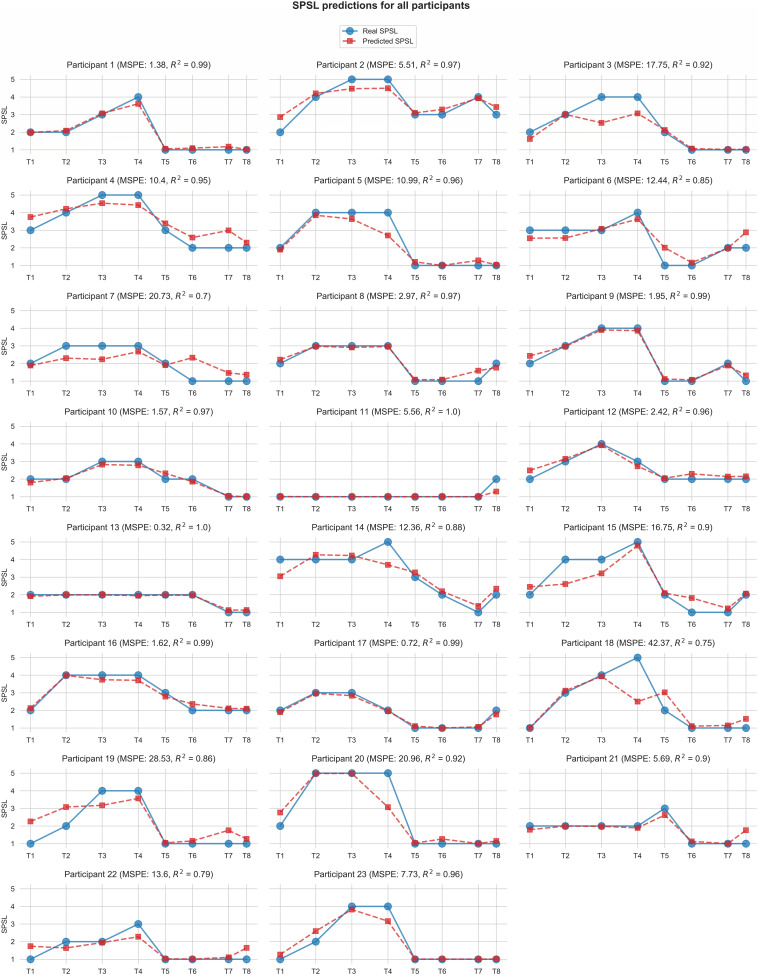
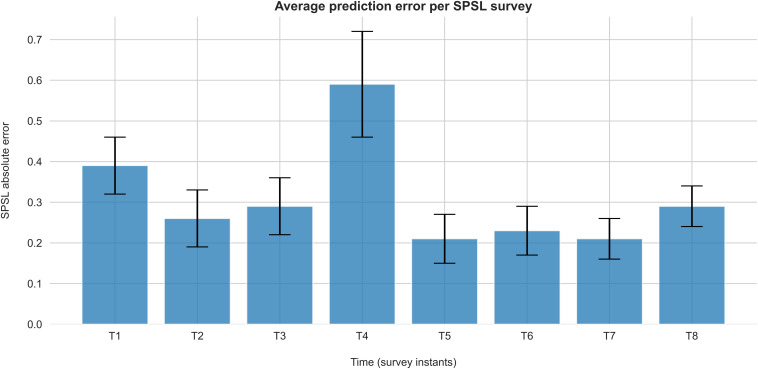
Recent studies have addressed stress level classification via electroencephalography (EEG) and machine learning. These works typically use EEG-based features, like power spectral density (PSD), to develop stress classifiers. Nonetheless, these classifiers are usually limited to the discrimination of two (stress and no stress) or three (low, medium, and high) stress levels. In this study we propose an alternative for quantitative stress assessment based on EEG and regression algorithms. To this aim, we conducted a group of 23 participants (mean age 22.65 ± 5.48) over a stress-relax experience while monitoring their EEG. First, we stressed the participants via the Montreal imaging stress task (MIST), and then we led them through a 360-degree virtual reality (VR) relaxation experience. Throughout the session, the participants reported their self-perceived stress level (SPSL) via surveys. Subsequently, we extracted spectral features from the EEG of the participants and we developed individual models based on regression algorithms to predict their SPSL. We evaluated stress regression performance in terms of the mean squared percentage error (MSPE) and the correlation coefficient (R 2). The results yielded from this evaluation (MSPE = 10.62 ± 2.12, R 2 = 0.92 ± 0.02) suggest that our approach predicted the stress level of the participants with remarkable performance. These results may have a positive impact in diverse areas that could benefit from stress level quantitative prediction. These areas include research fields like neuromarketing, and training of professionals such as surgeons, industrial workers, or firefighters, that often face stressful situations.
Keywords: EEG; machine learning; regression; stress; virtual reality.
Copyright © 2021 Perez-Valero, Vaquero-Blasco, Lopez-Gordo and Morillas.
Conflict of interest statement
The authors declare that the research was conducted in the absence of any commercial or financial relationships that could be construed as a potential conflict of interest.
Figures
Similar articles
-
Virtual Reality Customized 360-Degree Experiences for Stress Relief.Sensors (Basel). 2021 Mar 22;21(6):2219. doi: 10.3390/s21062219. Sensors (Basel). 2021. PMID: 33810135 Free PMC article.
-
Virtual Reality as a Portable Alternative to Chromotherapy Rooms for Stress Relief: A Preliminary Study.Sensors (Basel). 2020 Oct 30;20(21):6211. doi: 10.3390/s20216211. Sensors (Basel). 2020. PMID: 33143361 Free PMC article.
-
Classification of Perceived Mental Stress Using A Commercially Available EEG Headband.IEEE J Biomed Health Inform. 2019 Nov;23(6):2257-2264. doi: 10.1109/JBHI.2019.2926407. Epub 2019 Jul 2. IEEE J Biomed Health Inform. 2019. PMID: 31283515
-
Using machine-learning approach to distinguish patients with methamphetamine dependence from healthy subjects in a virtual reality environment.Brain Behav. 2020 Nov;10(11):e01814. doi: 10.1002/brb3.1814. Epub 2020 Aug 29. Brain Behav. 2020. PMID: 32862513 Free PMC article.
-
Alterations in Multi-channel EEG Dynamics During a Stressful Shooting Task in Virtual Reality Systems.Annu Int Conf IEEE Eng Med Biol Soc. 2021 Nov;2021:6207-6210. doi: 10.1109/EMBC46164.2021.9630007. Annu Int Conf IEEE Eng Med Biol Soc. 2021. PMID: 34892533
Cited by
-
Real-time mental stress detection using multimodality expressions with a deep learning framework.Front Neurosci. 2022 Aug 5;16:947168. doi: 10.3389/fnins.2022.947168. eCollection 2022. Front Neurosci. 2022. PMID: 35992909 Free PMC article.
-
Recent Advances in Multiplexed Wearable Sensor Platforms for Real-Time Monitoring Lifetime Stress: A Review.Biosensors (Basel). 2023 Apr 11;13(4):470. doi: 10.3390/bios13040470. Biosensors (Basel). 2023. PMID: 37185545 Free PMC article. Review.
-
Anxiety classification in virtual reality using biosensors: A mini scoping review.PLoS One. 2023 Jul 10;18(7):e0287984. doi: 10.1371/journal.pone.0287984. eCollection 2023. PLoS One. 2023. PMID: 37428748 Free PMC article.
-
Wearable EEG-Based Brain-Computer Interface for Stress Monitoring.NeuroSci. 2024 Oct 8;5(4):407-428. doi: 10.3390/neurosci5040031. eCollection 2024 Dec. NeuroSci. 2024. PMID: 39484299 Free PMC article.
-
Association Between Occupational Stress and Sleep Quality: A Systematic Review.Nat Sci Sleep. 2023 Nov 14;15:931-947. doi: 10.2147/NSS.S431442. eCollection 2023. Nat Sci Sleep. 2023. PMID: 38021213 Free PMC article. Review.
References
-
- Ahuja R., Banga A. (2019). Mental stress detection in university students using machine learning algorithms. Proc. Comput. Sci. 152 349–353. 10.1016/j.procs.2019.05.007 - DOI
-
- American Psychological Association (2015). Paying with Our Health. Available online at: http://www.apa.org/news/press/releases/stress/2014/financial-stress
LinkOut - more resources
Full Text Sources