. 2021 Jul 15:12:704060.
doi: 10.3389/fneur.2021.704060. eCollection 2021.

Forecasting Seizure Likelihood With Wearable Technology

Affiliations

Forecasting Seizure Likelihood With Wearable Technology

Rachel E Stirling et al. Front Neurol. .

Abstract

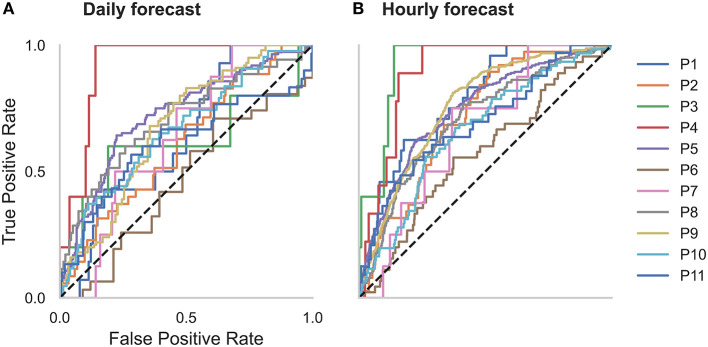
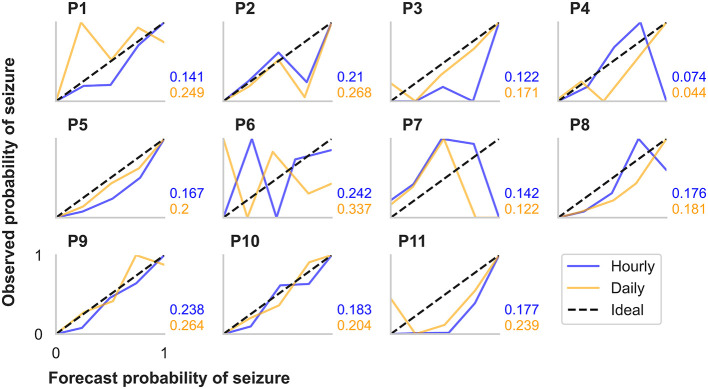
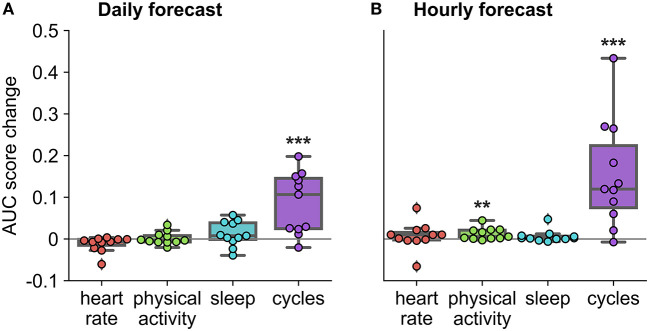
The unpredictability of epileptic seizures exposes people with epilepsy to potential physical harm, restricts day-to-day activities, and impacts mental well-being. Accurate seizure forecasters would reduce the uncertainty associated with seizures but need to be feasible and accessible in the long-term. Wearable devices are perfect candidates to develop non-invasive, accessible forecasts but are yet to be investigated in long-term studies. We hypothesized that machine learning models could utilize heart rate as a biomarker for well-established cycles of seizures and epileptic activity, in addition to other wearable signals, to forecast high and low risk seizure periods. This feasibility study tracked participants' (n = 11) heart rates, sleep, and step counts using wearable smartwatches and seizure occurrence using smartphone seizure diaries for at least 6 months (mean = 14.6 months, SD = 3.8 months). Eligible participants had a diagnosis of refractory epilepsy and reported at least 20 seizures (mean = 135, SD = 123) during the recording period. An ensembled machine learning and neural network model estimated seizure risk either daily or hourly, with retraining occurring on a weekly basis as additional data was collected. Performance was evaluated retrospectively against a rate-matched random forecast using the area under the receiver operating curve. A pseudo-prospective evaluation was also conducted on a held-out dataset. Of the 11 participants, seizures were predicted above chance in all (100%) participants using an hourly forecast and in ten (91%) participants using a daily forecast. The average time spent in high risk (prediction time) before a seizure occurred was 37 min in the hourly forecast and 3 days in the daily forecast. Cyclic features added the most predictive value to the forecasts, particularly circadian and multiday heart rate cycles. Wearable devices can be used to produce patient-specific seizure forecasts, particularly when biomarkers of seizure and epileptic activity cycles are utilized.

Keywords: circadian rhythms; cycles (cyclical); multiday rhythms; seizure cycles; seizure forecasting; wearable sensors.


Conflict of interest statement

RS, MC, EN, DF, DP, and PK were employed by or have a financial interest in the company Seer Medical Pty. Ltd. The remaining authors declare that the research was conducted in the absence of any commercial or financial relationships that could be construed as a potential conflict of interest.

Figures

Figure 1
Figure 1
Forecasting model architecture. The logistic regression ensemble (combining LSTM, Random Forest Regressor, and all features) was trained on a training dataset that included at least 15 seizures and at least 2 months of continuous recordings. Two forecasting horizons were compared: hourly and daily forecasts. The LSTM model incorporated sleep features from the past seven nights and the random regressor included all other features (cycles, heart rate, and physical activity features), in addition to the output daily seizure likelihood estimates from the LSTM model. The logistic regression ensemble utilized a 10-fold cross validation approach to forecast seizure likelihood hourly or daily. The forecasting model was assessed (using AUC scores) on a retrospective testing set and a pseudo-prospective held-out evaluation set and compared to a rate-matched random (RMR) model, where seizure frequency was determined by the training set. The algorithm was retrained weekly to imitate a clinical forecast.
Figure 2
Figure 2
Receiver operator characteristic (ROC) curves for all participants in the (A) daily and (B) hourly forecast (retrospective testing cohort). The dashed diagonal line represents a balanced random forecast. ROC curves show that hourly forecasts consistently outperformed a balanced random forecaster, and daily forecasts mostly outperformed a balanced random forecaster. Patient-specific forecast performance was assessed by comparing the forecaster's area under the ROC curve (AUC) to the AUC of a rate-matched random forecast (different to the balanced random forecast shown above).
Figure 3
Figure 3
Forecasting and prediction performance metric results in the retrospective testing cohort for the (B) hourly and (A) daily forecasters. Individual participant bars are shown for each metric. Population box plots are shown on the right of the bars, showing median and upper and lower quartiles for each metric in the hourly and daily forecasters.
Figure 4
Figure 4
Calibration curves and Brier scores for hourly and daily forecasts summarized for each participant in the retrospective testing cohort. The calibration curves show the relationship between the forecasted likelihood of seizures (x-axes) and the actual observed probability of seizures (y-axes). For the calibration curves, 10 bin sizes were used, so forecast likelihood values were compared to actual probabilities from 0–10%, 10–20%,., 90–100%. The ideal calibration curve for a hypothetically perfect forecaster is shown in each plot.
Figure 5
Figure 5
Example hourly forecasts showing high, medium, and low risk states, and medium and high risk thresholds. Predicted seizure likelihood (black line) derived from the hourly forecaster for P4 from the end of September to the end of January. Seizures are marked with red triangles. High, medium and low risk states are indicated by the red, orange and green regions, respectively, and are separated by the medium and high risk thresholds. Note that the medium risk and high risk thresholds—indicated by the orange and red lines, respectively—can change after weekly retraining. The cyclical seizure likelihood is mostly attributable to multiday heart rate cycles.
Figure 6
Figure 6
Auxiliary contribution of each feature group on forecasting performance in the retrospective testing cohort. AUC score change represents average change computed over ten runs of the algorithm. Performance of each feature group was characterized by comparing the AUC score of the forecasting algorithm once the feature group was added to the AUC score of the forecasting algorithm without the feature group. For example, in the case of physical activity, we compared the AUC score when the algorithm included all feature groups to the AUC score when the algorithm included only heart rate, sleep, and cycles feature groups. *Indicates that the feature group's contribution was significantly greater than zero across the cohort, using a one-sided t-test (***p < 0.001 and **p < 0.01). (A) Daily forecast. (B) Hourly forecast.
Figure 7
Figure 7
Receiver operator characteristic (ROC) curves for all participants in the (A) daily and (B) hourly forecast (held-out evaluation testing cohort). The dashed diagonal line represents a balanced random forecast. ROC curves show that hourly forecasts mostly outperformed a balanced random forecaster, and daily forecasts outperformed a balanced random forecaster half of the time. Patient-specific forecast performance was assessed by comparing the forecaster's area under the ROC curve (AUC) to the AUC of a rate-matched random forecast (different to the balanced random forecast shown above).

References

    1. Abramovici S, Bagić A. Epidemiology of epilepsy. Handb Clin Neurol. (2016) 138:159–71. 10.1016/B978-0-12-802973-2.00010-0 - DOI - PubMed
    1. Murray CJ, Barber RM, Foreman KJ, Ozgoren AA, Abd-Allah F, Abera SF, et al. . Global, regional, and national disability-adjusted life years (DALYs) for 306 diseases and injuries and healthy life expectancy (HALE) for 188 countries, 1990–2013: quantifying the epidemiological transition. Lancet. (2015) 386:2145–91. 10.1016/S0140-6736(15)61340-X - DOI - PMC - PubMed
    1. Fisher RS, Acevedo C, Arzimanoglou A, Bogacz A, Cross JH, Elger CE, et al. . ILAE official report: a practical clinical definition of epilepsy. Epilepsia. (2014) 55:475–82. 10.1111/epi.12550 - DOI - PubMed
    1. Kwan P, Brodie MJ. Early identification of refractory epilepsy. New Engl J Med. (2000) 342:314–9. 10.1056/NEJM200002033420503 - DOI - PubMed
    1. Chen Z, Brodie MJ, Liew D, Kwan P. Treatment outcomes in patients with newly diagnosed epilepsy treated with established and new antiepileptic drugs: a 30-year longitudinal cohort study. JAMA Neurol. (2018) 75:279–86. 10.1001/jamaneurol.2017.3949 - DOI - PMC - PubMed

LinkOut - more resources