

Comparative Analysis of Fecal Microbiomes From Wild Waterbirds to Poultry, Cattle, Pigs, and Wastewater Treatment Plants for a Microbial Source Tracking Approach
- PMID: 34335529
- PMCID: PMC8317174
- DOI: 10.3389/fmicb.2021.697553
Comparative Analysis of Fecal Microbiomes From Wild Waterbirds to Poultry, Cattle, Pigs, and Wastewater Treatment Plants for a Microbial Source Tracking Approach
Abstract
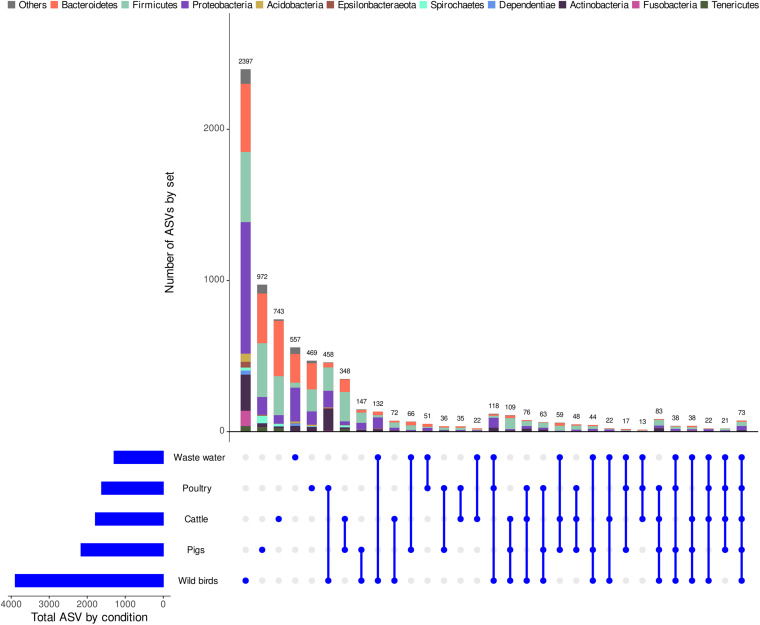
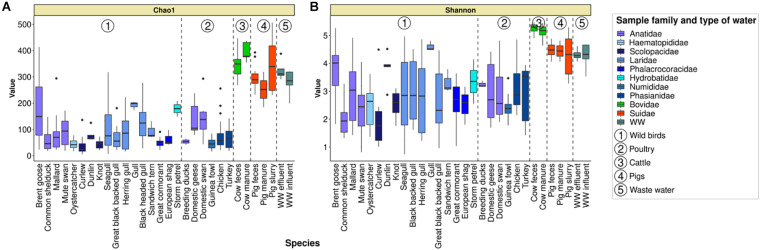
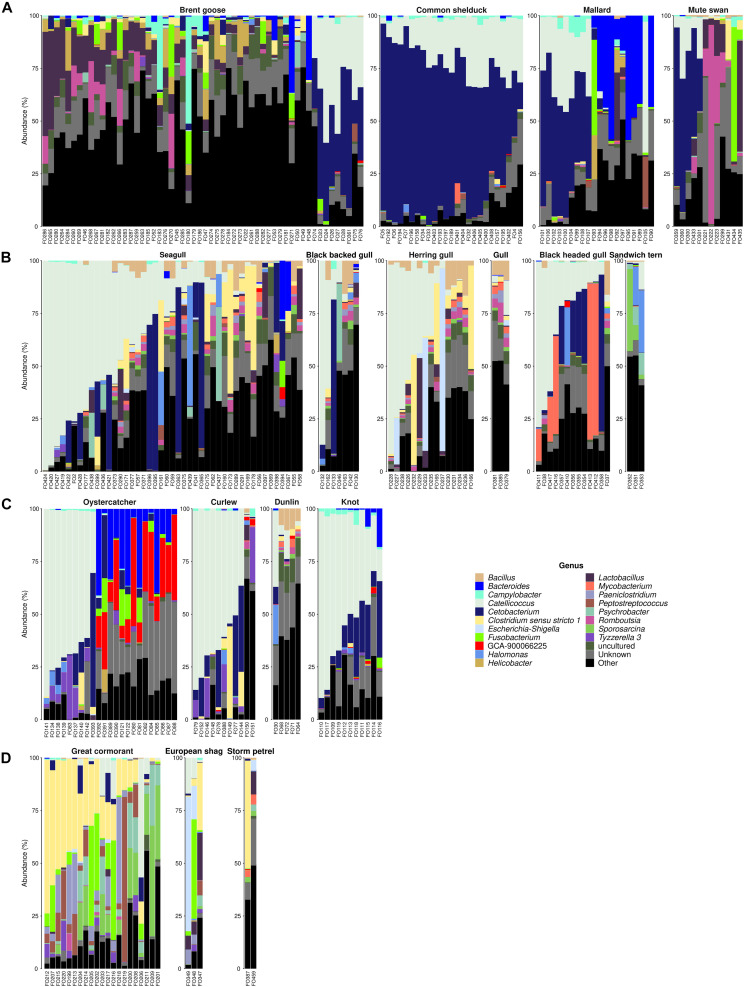
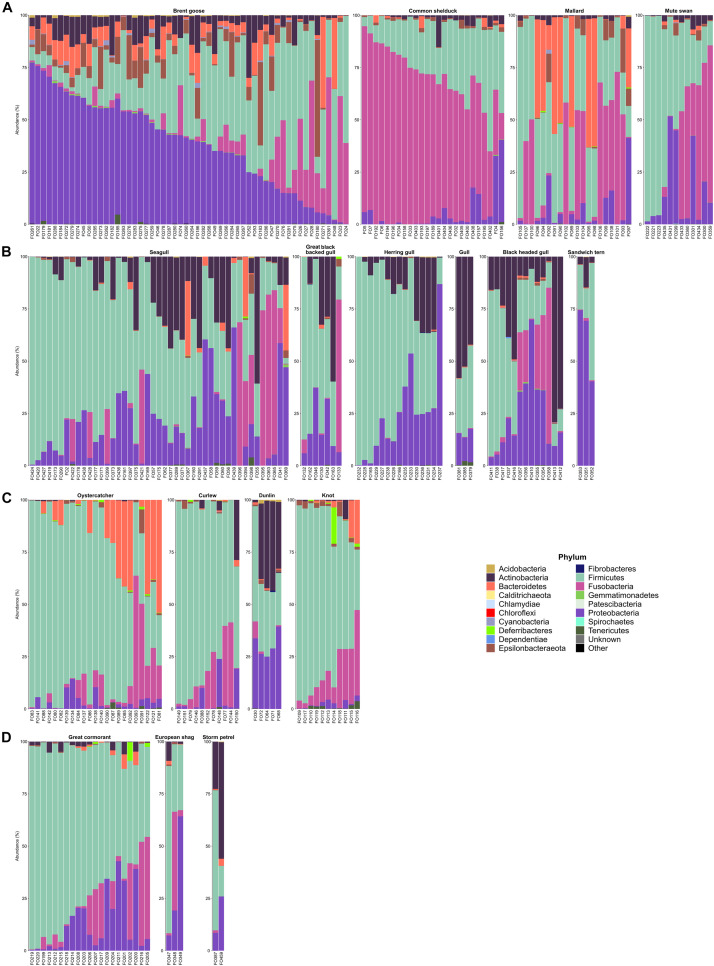
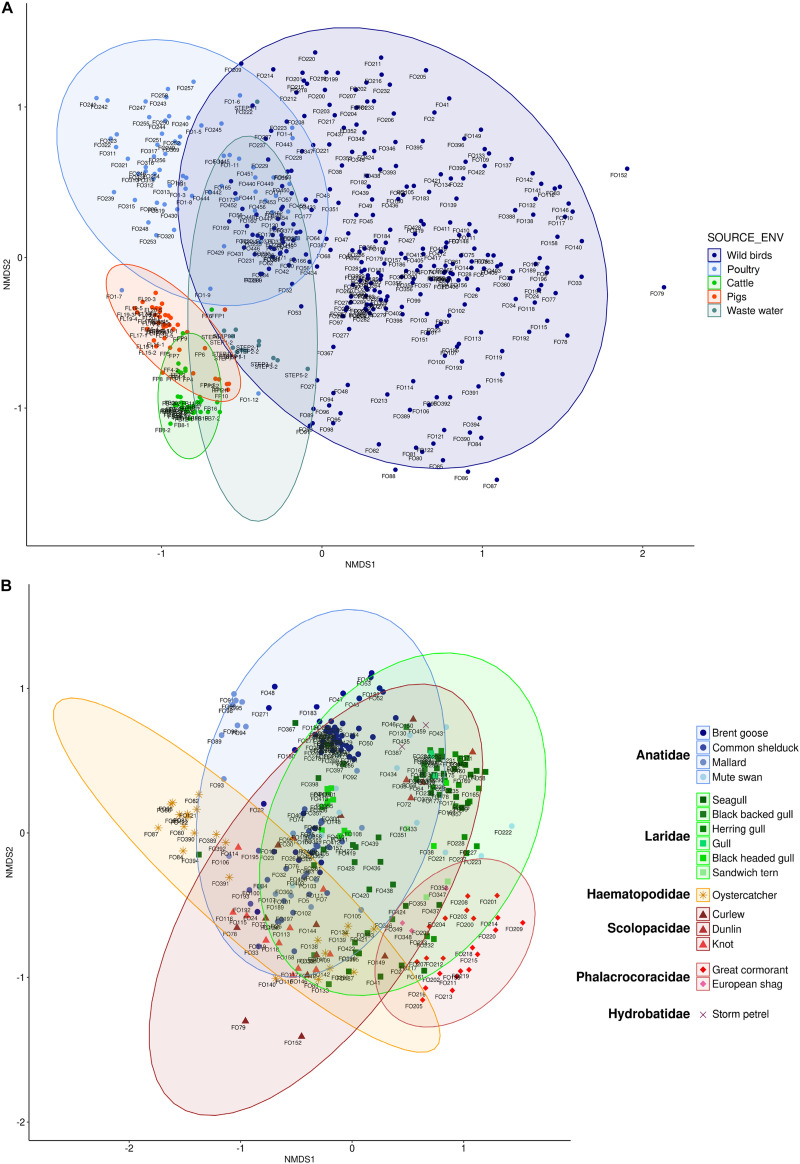
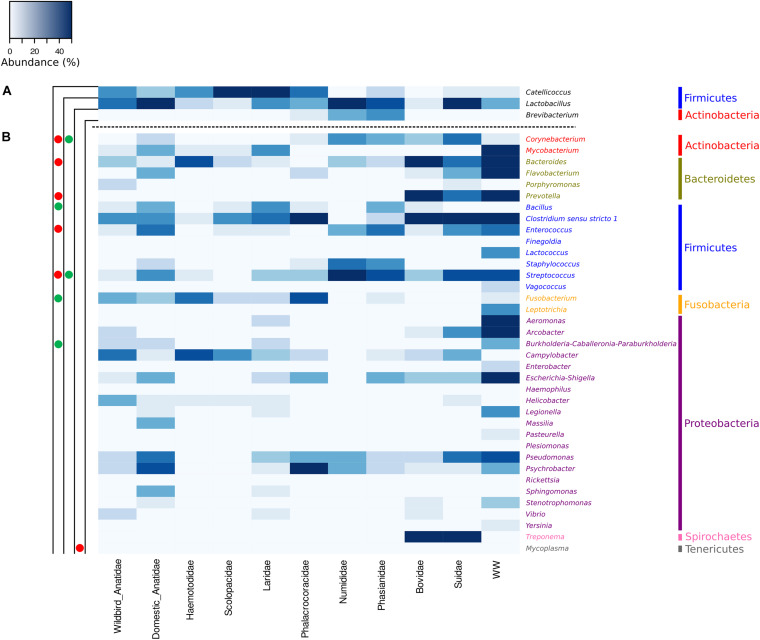
Fecal pollution in coastal areas is of a high concern since it affects bathing and shellfish harvesting activities. Wild waterbirds are non-negligible in the overall signal of the detectable pollution. Yet, studies on wild waterbirds' gut microbiota focus on migratory trajectories and feeding impact on their shape, rare studies address their comparison to other sources and develop quantitative PCR (qPCR)-based Microbial Source Tracking (MST) markers to detect such pollution. Thus, by using 16S rRNA amplicon high-throughput sequencing, the aims of this study were (i) to explore and compare fecal bacterial communities from wild waterbirds (i.e., six families and 15 species, n = 275 samples) to that of poultry, cattle, pigs, and influent/effluent of wastewater treatment plants (n = 150 samples) and (ii) to develop new MST markers for waterbirds. Significant differences were observed between wild waterbirds and the four other groups. We identified 7,349 Amplicon Sequence Variants (ASVs) from the hypervariable V3-V4 region. Firmicutes and Proteobacteria and, in a lesser extent, Actinobacteria and Bacteroidetes were ubiquitous while Fusobacteria and Epsilonbacteraeota were mainly present in wild waterbirds. The clustering of samples in non-metric multidimensional scaling (NMDS) ordination indicated a by-group clustering shape, with a high diversity within wild waterbirds. In addition, the structure of the bacterial communities was distinct according to bird and/or animal species and families (Adonis R 2 = 0.13, p = 10-4, Adonis R 2 = 0.11, p = 10-4, respectively). The Analysis of Composition of Microbiomes (ANCOM) showed that the wild waterbird group differed from the others by the significant presence of sequences from Fusobacteriaceae (W = 566) and Enterococcaceae (W = 565) families, corresponding to the Cetobacterium (W = 1427) and Catellicoccus (W = 1427) genera, respectively. Altogether, our results suggest that some waterbird members present distinct fecal microbiomes allowing the design of qPCR MST markers. For instance, a swan- and an oystercatcher-associated markers (named Swan_2 and Oyscab, respectively) have been developed. Moreover, bacterial genera harboring potential human pathogens associated to bird droppings were detected in our dataset, including enteric pathogens, i.e., Arcobacter, Clostridium, Helicobacter, and Campylobacter, and environmental pathogens, i.e., Burkholderia and Pseudomonas. Future studies involving other wildlife hosts may improve gut microbiome studies and MST marker development, helping mitigation of yet unknown fecal pollution sources.
Keywords: NGS; enteric pathogens; environmental pathogens; fecal pollution; microbial source tracking; microbiome; qPCR; wild waterbird.
Copyright © 2021 Boukerb, Noël, Quenot, Cadiou, Chevé, Quintric, Cormier, Dantan and Gourmelon.
Conflict of interest statement
The authors declare that the research was conducted in the absence of any commercial or financial relationships that could be construed as a potential conflict of interest.
Figures
References
-
- Ashbolt N. J., Grabow W. O., Snozzi M. (2001). “Indicators of microbial water quality,” in Water Quality: Guidelines, Standards and Health, eds Fewtrell L., Bartram J. (Geneva: World Health Organization (WHO)), 290–315.
LinkOut - more resources
Full Text Sources