. 2021 Jul 16:12:694243.
doi: 10.3389/fimmu.2021.694243. eCollection 2021.

High-Density Blood Transcriptomics Reveals Precision Immune Signatures of SARS-CoV-2 Infection in Hospitalized Individuals

Affiliations

High-Density Blood Transcriptomics Reveals Precision Immune Signatures of SARS-CoV-2 Infection in Hospitalized Individuals

Jeremy W Prokop et al. Front Immunol. .

Abstract

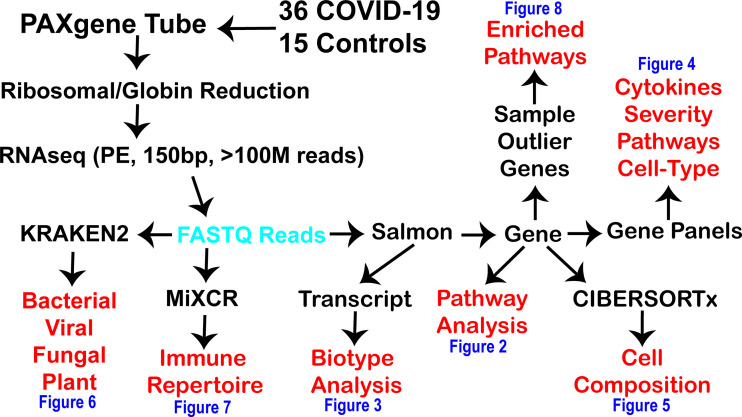
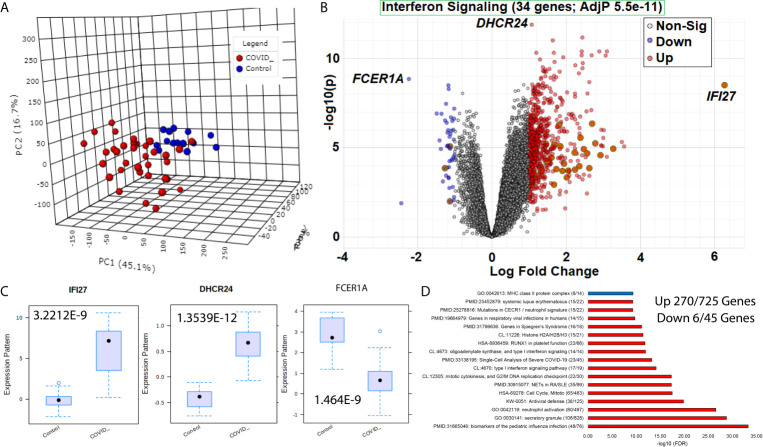
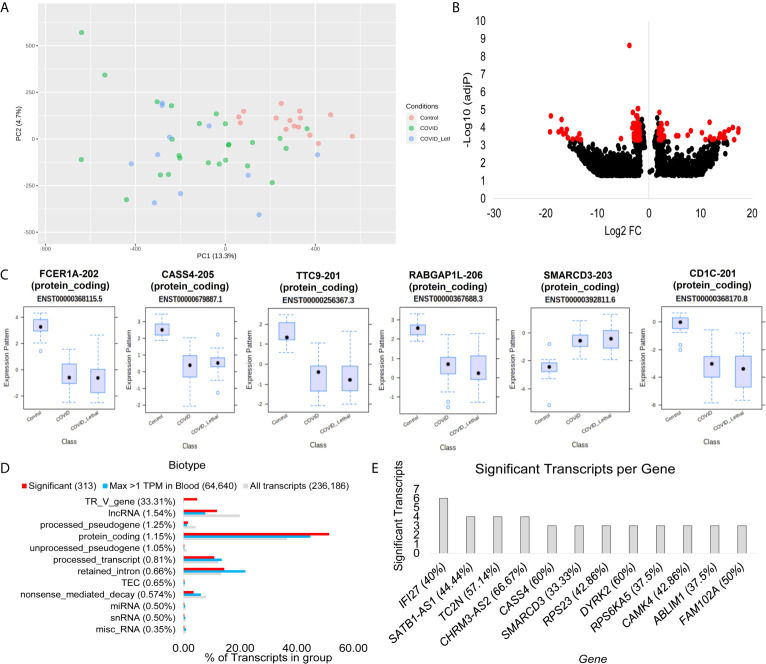
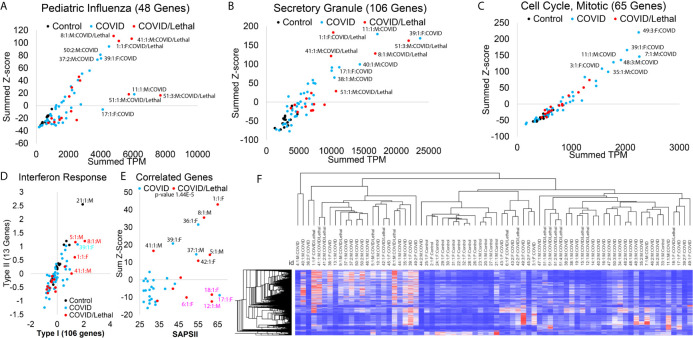
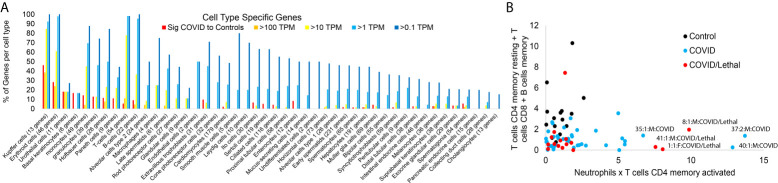
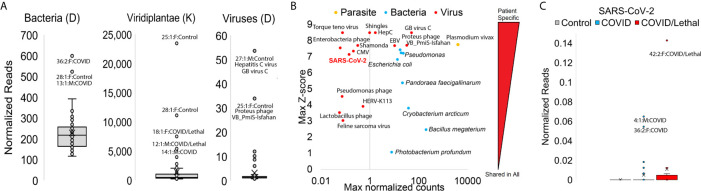
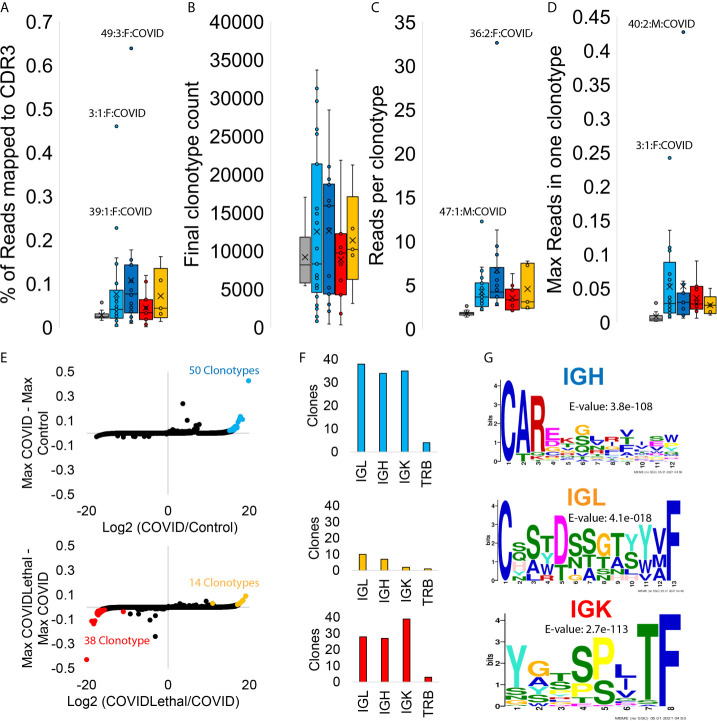
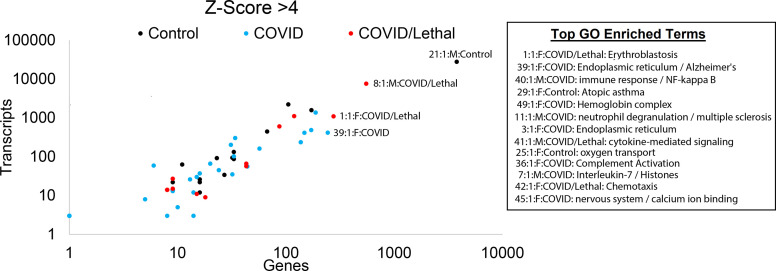
The immune response to COVID-19 infection is variable. How COVID-19 influences clinical outcomes in hospitalized patients needs to be understood through readily obtainable biological materials, such as blood. We hypothesized that a high-density analysis of host (and pathogen) blood RNA in hospitalized patients with SARS-CoV-2 would provide mechanistic insights into the heterogeneity of response amongst COVID-19 patients when combined with advanced multidimensional bioinformatics for RNA. We enrolled 36 hospitalized COVID-19 patients (11 died) and 15 controls, collecting 74 blood PAXgene RNA tubes at multiple timepoints, one early and in 23 patients after treatment with various therapies. Total RNAseq was performed at high-density, with >160 million paired-end, 150 base pair reads per sample, representing the most sequenced bases per sample for any publicly deposited blood PAXgene tube study. There are 770 genes significantly altered in the blood of COVID-19 patients associated with antiviral defense, mitotic cell cycle, type I interferon signaling, and severe viral infections. Immune genes activated include those associated with neutrophil mechanisms, secretory granules, and neutrophil extracellular traps (NETs), along with decreased gene expression in lymphocytes and clonal expansion of the acquired immune response. Therapies such as convalescent serum and dexamethasone reduced many of the blood expression signatures of COVID-19. Severely ill or deceased patients are marked by various secondary infections, unique gene patterns, dysregulated innate response, and peripheral organ damage not otherwise found in the cohort. High-density transcriptomic data offers shared gene expression signatures, providing unique insights into the immune system and individualized signatures of patients that could be used to understand the patient's clinical condition. Whole blood transcriptomics provides patient-level insights for immune activation, immune repertoire, and secondary infections that can further guide precision treatment.

Keywords: COVID-19; RNAseq; SARS-CoV-2; blood transcriptomics; immune cell deconvolution; immune repertoire; interferon response; secondary infections.


Conflict of interest statement

JP performed a summer sabbatical in 2020 for AbbVie Inc, receiving hourly pay. RK, NA, BF, and LT were employees of Ambry Genetics during this study. NK is an advisory board member for Horizon pharmaceuticals and Pharming Healthcare. None of these listed conflicts were directly related to the current work. The authors declare that the research was conducted in the absence of any commercial or financial relationships that could be construed as a potential conflict of interest.

Figures

Figure 1
Figure 1
Workflow for precision high-density transcriptomics used within the current study. The black text is the various steps used within the current study to generate and process fastq reads (cyan) for multiple levels of insights (red) shown within the various figures of the paper (blue). RNAseq was done in paired-end (PE) with 150 basepair (bp) reads with at least one hundred million reads generated per patient.
Figure 2
Figure 2
Blood transcriptome gene signatures of SARS-CoV-2 patients. (A) Three dimensions of principal components (PC1-PC3) of first collection time point RNAseq gene annotations for samples of COVID-19 (red) or control (blue) patients. (B) Volcano plot of gene expression in COVID-19 or control patients with significant genes higher (red) or lower (blue) marked. The x-axis shows the log2 fold change, and the y-axis shows the -log10 of the adjusted p-value. Shadowed genes are involved in interferon signaling. (C) Box and whisker plot of the top three genes labeled in panel (B, D) Top gene ontology (GO) enrichment terms for up (red) or down (blue) genes. The term for each enriched description is shown first, followed by the name, and then in parentheses, the number of genes is significant relative to the number of genes within the genome annotated for the term. The x-axis shows the -log10 of the false discovery rate (FDR).
Figure 3
Figure 3
Blood transcriptome transcript isoform signatures of SARS-CoV-2 patients. (A) Two dimensions of principal components (PC1-PC2) of first collection time point RNAseq transcript annotations for samples of control (red), COVID-19 and survived (green), or COVID-19 and lethal (blue). (B) Volcano plot of transcript expression in COVID-19 or control patients with significant genes with a Log2 of 2 and adjP <0.0005 marked in red. The x-axis shows the log2 fold change, and the y-axis shows the -log10 of the adjusted p-value. (C) Box and whisker plot of the top six transcripts, with each having the transcript identifier, biotype, and Ensembl transcript ID listed. (D) Top biotypes enriched in the significant transcripts for COVID-19, with the percent listed in paratheses for each biotype annotation. The top biotypes are listed based on enrichment of significance annotation (red) relative to detection within blood within at least one sample with >1TPM (cyan). The percent of transcripts for the entire Gencode 38 database of 236,186 known transcripts is shown in gray. (E) The number of transcripts significantly different in the COVID-19 group relative to controls for each gene. The percent of transcripts identified significant relative to all known transcripts for each gene is shown in paratheses.
Figure 4
Figure 4
Blood transcriptome gene panel signatures of SARS-CoV-2 patients. (A–C) Enriched associated genes for severe pediatric influenza (A), secretory granule (B), and mitotic cell cycle (C). The x-axis shows the added transcript per million (TPM) of all genes in the gene list, and the y-axis shows the added z-score for each group’s genes. Control samples are shown in black, COVID-19 patients in cyan, and COVID-19 patients deceased in red. The outlier samples are labeled (Sample #:collection #:Sex : Group). (D) Average Z-score for genes specifically activated to Type I IFN (x-axis) or Type II IFN (y-axis). (E) The analysis of SAPSII (Simplified Acute Physiology) relative to combinations of genes that are correlated 0.5-0.4 to the SAPSII. (F) Heat map of the 770 significant genes in all samples. Clustering dendrogram of rows and columns is based on Spearman’s rank correlation.
Figure 5
Figure 5
Blood transcriptome cell-specific gene signatures of SARS-CoV-2 patients. (A) The number of genes unique to various cell types (x-axis) expressed in the significant group of Figure 1 (red) or have expression in one or more of the samples greater than 100 TPM (orange), >10 TPM (yellow), or >1 TPM (cyan). (B) Absolute values of CIBERSORTx additive for resting CD4 T-cells, CD8 T-cells, and memory B-cells relative to neutrophil and CD4 memory T-cells within the control (black), COVID-19 (cyan), or COVID-19 lethal (red).
Figure 6
Figure 6
Blood transcriptome foreign RNA signatures of SARS-CoV-2 patients. (A) Box and whisker plots for normalized reads mapped to bacteria, plants (Viridiplantae), or viruses with outlier samples labeled. (B) Top mapping values in samples for parasite (orange), bacteria (cyan), or virus (red) RNA. Values are shown as the highest (max) sample normalized counts (x-axis) for each labeled vs. the z-score for that sample (y-axis) relative to the entire cohort. (C) Box and whisker plot for normalized SARS-CoV-2 reads. Controls are gray, COVID samples cyan, and COVID/Lethal red.
Figure 7
Figure 7
Blood transcriptome immune repertoire signatures of SARS-CoV-2 patients. (A–D) Box and whisker plots for statistics for MiXCR CDR3 analysis. Samples are grouped as controls (gray), COVID first collection (cyan), COVID later collections (blue), COVID/Lethal first collection (red), or COVID/Lethal later collections (orange). Data is shown for the % of reads mapped to CDR3 from all reads (A), the number of clonotypes per sample (B), the number of reads per clonotype per patient (C), and the max number of reads within one of the clonotypes for each patient (D). (E) The log2 fold change (x-axis) of group averages relative to the max values (y-axis) for each clonotype in all COVID samples vs. Controls (top) or Lethal COVID vs. non-Lethal COVID (bottom). Outlier clonotypes enriched in one of the groups are labeled (cyan, red, orange). (F) Clones labeled in panel E (cyan, red, orange) analyzed through CDR3 types (IGL, IGH, IGK, TRB). (G) Meme motifs for labeled CDR3 types of extracted clones. Color of IGH/IGL/IGK corresponds to the clones extracted from the colored outliers of panel E.
Figure 8
Figure 8
Blood transcriptome outlier gene/transcript signatures of SARS-CoV-2 patients. The number of genes (x-axis) and transcripts (y-axis) in each sample that has a z-score >4. Those samples with enriched gene ontology terms are shown.
Figure 9
Figure 9
Schematic of two different groups of COVID patients relative to controls. Red represents the immune overactive COVID-19 patients (group A), cyan the immune suppressed patients (group B), and controls cluster in black (group C).

References

    1. Tian S, Hu N, Lou J, Chen K, Kang X, Xiang Z, et al. . Characteristics of COVID-19 Infection in Beijing. J Infect (2020) 80:401–6. 10.1016/j.jinf.2020.02.018 - DOI - PMC - PubMed
    1. Laing AG, Lorenc A, Del Molino Del Barrio I, Das A, Fish M, Monin L, et al. . A Dynamic COVID-19 Immune Signature Includes Associations With Poor Prognosis. Nat Med (2020) 26:1623–35. 10.1038/s41591-020-1038-6 - DOI - PubMed
    1. Zhou F, Yu T, Du R, Fan G, Liu Y, Liu Z, et al. . Clinical Course and Risk Factors for Mortality of Adult Inpatients With COVID-19 in Wuhan, China: A Retrospective Cohort Study. Lancet (2020) 395:1054–62. 10.1016/S0140-6736(20)30566-3 - DOI - PMC - PubMed
    1. Yuki K, Fujiogi M, Koutsogiannaki S. COVID-19 Pathophysiology: A Review. Clin Immunol (2020) 215:108427. 10.1016/j.clim.2020.108427 - DOI - PMC - PubMed
    1. Blanco-Melo D, Nilsson-Payant BE, Liu W-C, Uhl S, Hoagland D, Møller R, et al. . Imbalanced Host Response to SARS-CoV-2 Drives Development of COVID-19. Cell (2020) 181:1036–45. 10.1016/j.cell.2020.04.026 - DOI - PMC - PubMed