Clinical Trial
. 2021 Jul 15:12:702877.
doi: 10.3389/fimmu.2021.702877. eCollection 2021.

Mapping Autoantibodies in Children With Acute Rheumatic Fever

Affiliations
Clinical Trial

Mapping Autoantibodies in Children With Acute Rheumatic Fever

Reuben McGregor et al. Front Immunol. .

Abstract

Background: Acute rheumatic fever (ARF) is a serious sequela of Group A Streptococcus (GAS) infection associated with significant global mortality. Pathogenesis remains poorly understood, with the current prevailing hypothesis based on molecular mimicry and the notion that antibodies generated in response to GAS infection cross-react with cardiac proteins such as myosin. Contemporary investigations of the broader autoantibody response in ARF are needed to both inform pathogenesis models and identify new biomarkers for the disease.

Methods: This study has utilised a multi-platform approach to profile circulating autoantibodies in ARF. Sera from patients with ARF, matched healthy controls and patients with uncomplicated GAS pharyngitis were initially analysed for autoreactivity using high content protein arrays (Protoarray, 9000 autoantigens), and further explored using a second protein array platform (HuProt Array, 16,000 autoantigens) and 2-D gel electrophoresis of heart tissue combined with mass spectrometry. Selected autoantigens were orthogonally validated using conventional immunoassays with sera from an ARF case-control study (n=79 cases and n=89 matched healthy controls) and a related study of GAS pharyngitis (n=39) conducted in New Zealand.

Results: Global analysis of the protein array data showed an increase in total autoantigen reactivity in ARF patients compared with controls, as well as marked heterogeneity in the autoantibody profiles between ARF patients. Autoantigens previously implicated in ARF pathogenesis, such as myosin and collagens were detected, as were novel candidates. Disease pathway analysis revealed several autoantigens within pathways linked to arthritic and myocardial disease. Orthogonal validation of three novel autoantigens (PTPN2, DMD and ANXA6) showed significant elevation of serum antibodies in ARF (p < 0.05), and further highlighted heterogeneity with patients reactive to different combinations of the three antigens.

Conclusions: The broad yet heterogenous elevation of autoantibodies observed suggests epitope spreading, and an expansion of the autoantibody repertoire, likely plays a key role in ARF pathogenesis and disease progression. Multiple autoantigens may be needed as diagnostic biomarkers to capture this heterogeneity.

Keywords: autoantibody; autoantigen; group A Streptococcus; immunoassay; protein array; rheumatic fever; streptococcus A.


Conflict of interest statement

The authors declare that the research was conducted in the absence of any commercial or financial relationships that could be construed as a potential conflict of interest.

Figures
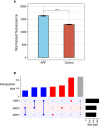
Figure 1
Figure 1
Global autoantibody analysis in ARF using ProtoArrays. (A) Overall antibody binding intensities against human proteins in ARF patients (blue, n=3) and grouped controls (red, n=6). Controls comprise both healthy children (n=3) and children with GAS positive pharyngitis (n=3). Bars indicate mean and standard error. ****p < 0.0001 using two sample Wilcoxon test. (B) Upset plot showing number of shared autoantibodies between ARF patients (ARF1, 2 and 3). Autoantibodies shared between all three ARF patients are indicated in grey, those shared between at least two patients in blue and those unique to an individual patient in red. The number of autoantibodies in each category is indicated on vertical bar charts with respective colours. Upset plots include only antibodies that showed at least a two-fold enrichment when compared with the mean of grouped controls. Total number of auto-antibodies identified using this threshold per patient is indicated on horizontal bar charts (Set size).
Figure 2
Figure 2
Autoantibody disease pathway analysis using ProtoArray data. (A) Volcano plot showing fold-change differences in autoantibody signals between ARF patients (n=3) and controls (n=6). Controls comprise both healthy children (n=3) and children with GAS positive pharyngitis (n=3). The size of the dots and annotations relates to the fluorescence intensity of individual autoantibodies. Red dashed lines indicate cut-offs for significant differences (p < 0.05, fold-change >2). Blue dots represent autoantibodies showing significantly increased binding in ARF patients compared to controls whilst red dots represent autoantibodies showing significantly increased binding in controls compared to ARF patients. Orange annotated autoantibodies have historically been implicated in the pathogenesis of ARF and/or RHD. Purple annotated autoantibodies are novel and of interest for downstream analysis (see Figure 3 ). (B) Disease pathway analysis conducted on 841 autoantigens with significantly increased binding in ARF patient sera in part (A). Three significant (p < 0.005) disease pathways are shown in relation to fold enrichment of proteins in pathways (compared to what would be expected by chance). Dot color intensity corresponds to p-value and dashed red line indicates a fold-enrichment of 1, which would represent no enrichment. (C) Heat-maps showing individual autoantibody reactivities to proteins belonging to disease pathways identified in part (B). Color intensity corresponds to log2 normalized fluorescence values from ProtoArrays of each individual ARF patient (blue columns), healthy controls (red columns) and children with GAS positive pharyngitis (orange columns). A relative color scheme was applied using the min and max values in each row to plot relative colors. The dendrogram represents results of hierarchical clustering on columns. Autoantibody reactivities indicated by purple arrows relate to novel autoantibodies of interest for downstream analysis annotated.
Figure 3
Figure 3
Autoantibody cross-validation using HuProt array (A) Volcano plot showing fold-change differences in autoantibody signals between ARF patients with carditis (n=7) and healthy controls (n=6). The size of the dots relates to the fluorescence intensity of individual autoantibodies. Red dashed lines indicate cut-offs for significant differences (p < 0.1, fold-change >1.5). Blue dots represent autoantibodies showing significantly increased binding in ARF patients compared to controls whilst red dots represent autoantibodies showing significantly increased binding in controls compared to ARF patients. Black and purple annotated autoantibodies are those also identified in ProtoArray analysis (see Figure 2 ), with purple dots relating to novel autoantibodies of interest for downstream analysis. Green annotated dot was also identified by 2-DE gel. (B) Venn diagram showing the nine overlapping autoantibodies between; 158 proteins identified in HuProt analysis from part (A) in violet; and 841 autoantibodies identified in ProtoArray analysis from Figure 2A in yellow. Following filtering for proteins localized to plasma membrane and present in heart muscle, autoantibodies targeting two proteins were identified indicated by large purple text. (C) Bar graphs showing mean and standard error of normalized fluorescence values representing autoantibody reactivities to DMD (left), PTPN2 (middle) and ANXA6 (right), from healthy controls (blue, n=6) and ARF patients with carditis (red, n=7).
Figure 4
Figure 4
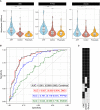
Orthogonal validation of autoantigens by ELISA (A) Combined violin and box and whisker plots showing ELISAs targeting DMD (left), PTPN2 (middle) and ANXA6 (right) using sera from ARF patients (blue, n=79), matched healthy controls (red, n=85) and children with GAS positive pharyngitis (orange, n=39). For box and whisker plots the lower and upper hinges correspond to the first and third quartiles (the 25th and 75th percentiles). The whiskers extend from the hinge to the largest and smallest value no further than 1.5 x inter-quartile range from the respective hinge. The violin plot extends from the highest to the lowest value showing density of data. Red dashed line represents the cut-off for positivity positive based analysis in part (B). *p < 0.05, **p < 0.01, ****< 0.0001 using two sample Wilcoxon test. (B) Receiver Operator Curves (ROC) of ELISA results from DMD (red), PTPN2 (blue) and ANXA6 (green) as well as all three antigens combined (black). Grey dashed line represents the line of no discrimination, which would indicate a test with no predictive power. The AUC for each analysis is indicated with confidence intervals obtained using bootstrapping in brackets. The crosses represent the optimal cut-off for each autoantigen ELISA. (C) Barcode of all 79 ARF patients indicating positive (black) or negative (grey) reactivity to all three autoantigens. Cut-off for positivity was determined from the ROC analysis in part (B) and is represented visually as a red dashed line in part (A).

References

    1. Wilson NJ, Voss L, Morreau J, Stewart J, Lennon D. New Zealand Guidelines for the Diagnosis of Acute Rheumatic Fever: Small Increase in the Incidence of Definite Cases Compared to the American Heart Association Jones Criteria. New Z Med J (2013) 126:50–9. - PubMed
    1. Gewitz MH, Baltimore RS, Tani LY, Sable CA, Shulman ST, Carapetis J, et al. . Revision of the Jones Criteria for the Diagnosis of Acute Rheumatic Fever in the Era of Doppler Echocardiography A Scientific Statement From the American Heart Association. Circulation (2015) 131:1806–18. 10.1161/CIR.0000000000000205 - DOI - PubMed
    1. Carapetis JR, Steer AC, Mulholland EK, Weber M. The Global Burden of Group A Streptococcal Diseases. Lancet Infect Dis (2005) 5:685–94. 10.1016/s1473-3099(05)70267-x - DOI - PubMed
    1. Watkins DA, Johnson CO, Colquhoun SM, Karthikeyan G, Beaton A, Bukhman G, et al. . Global, Regional, and National Burden of Rheumatic Heart Disease, 1990–2015. New Engl J Med (2017) 377:713–22. 10.1056/nejmoa1603693 - DOI - PubMed
    1. Parnaby MG, Carapetis JR. Rheumatic Fever in Indigenous Australian Children. J Paediatr Child H (2010) 46:527–33. 10.1111/j.1440-1754.2010.01841.x - DOI - PubMed

Publication types