. 2021 Jul 15:12:712632.
doi: 10.3389/fimmu.2021.712632. eCollection 2021.

Redefining the Role of Lymphotoxin Beta Receptor in the Maintenance of Lymphoid Organs and Immune Cell Homeostasis in Adulthood

Affiliations

Redefining the Role of Lymphotoxin Beta Receptor in the Maintenance of Lymphoid Organs and Immune Cell Homeostasis in Adulthood

Yajun Shou et al. Front Immunol. .

Abstract

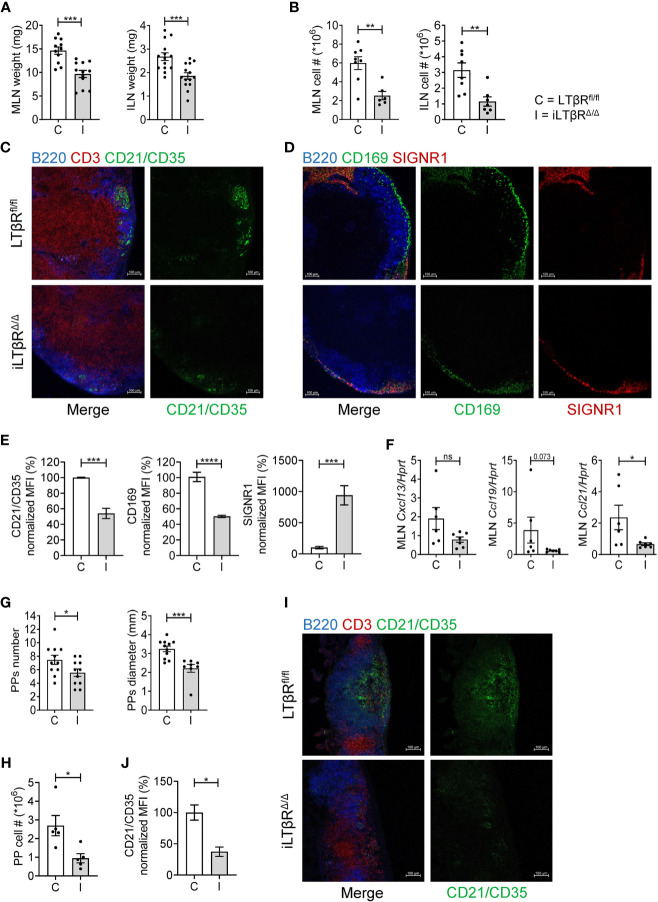
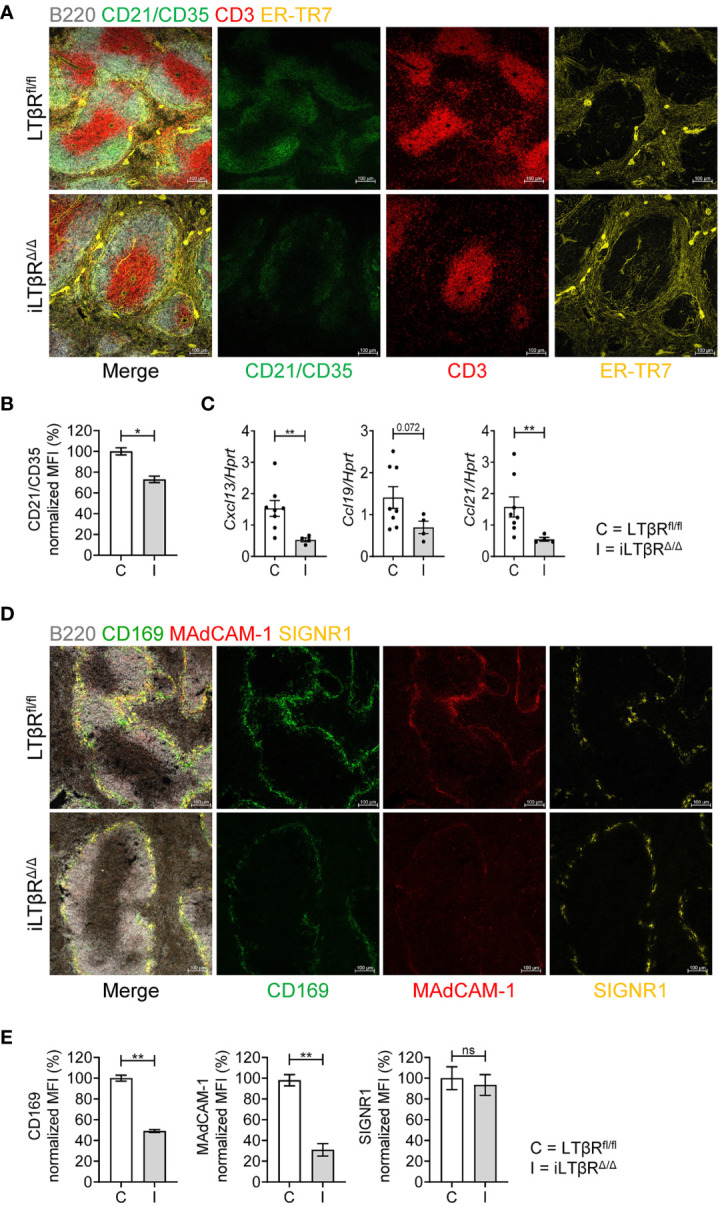
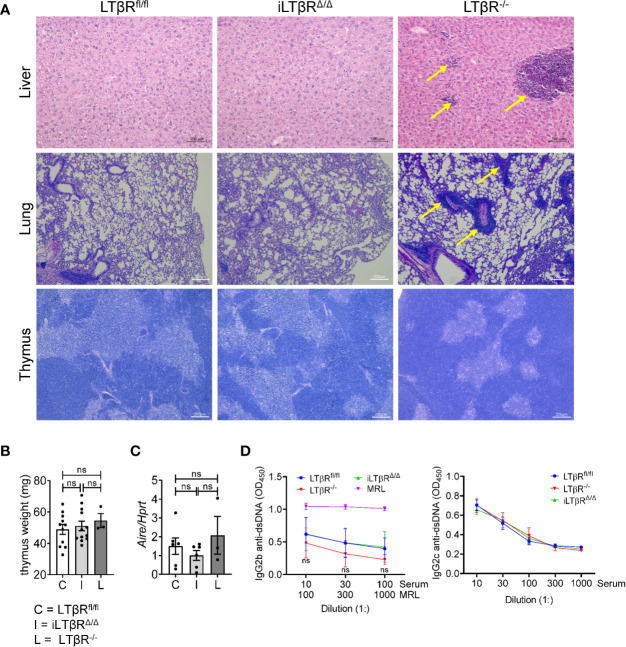
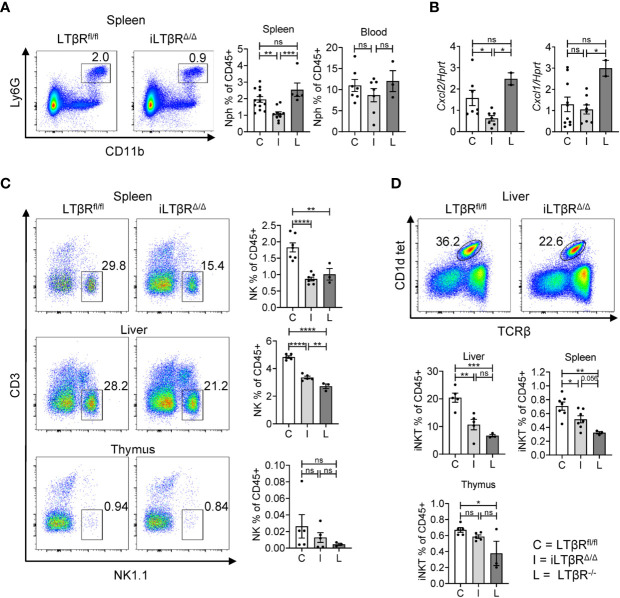
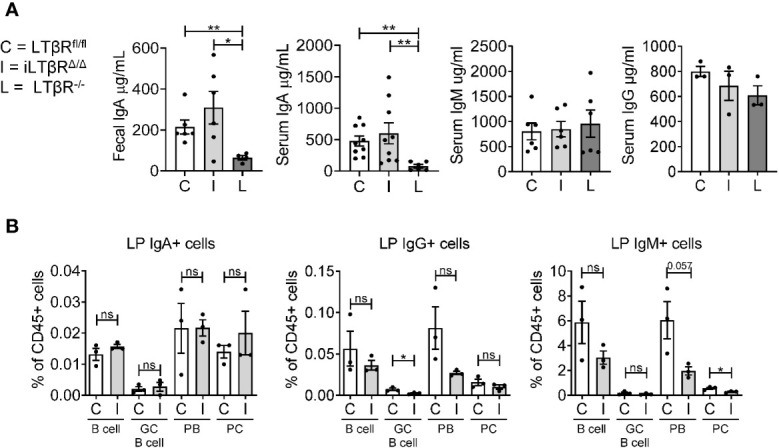
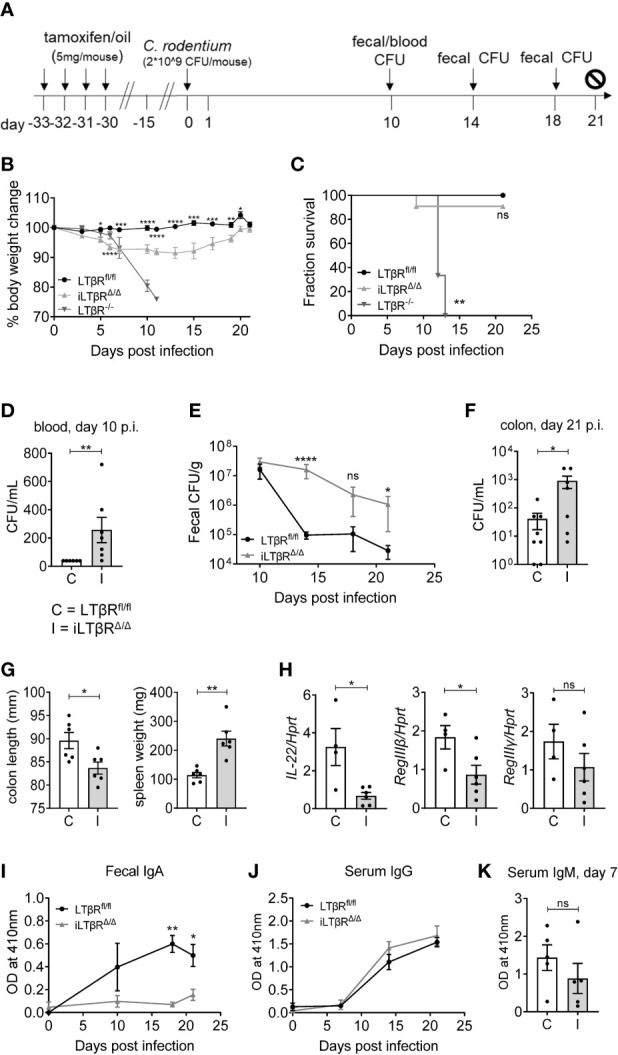
Lymphotoxin beta receptor (LTβR) is a promising therapeutic target in autoimmune and infectious diseases as well as cancer. Mice with genetic inactivation of LTβR display multiple defects in development and organization of lymphoid organs, mucosal immune responses, IgA production and an autoimmune phenotype. As these defects are imprinted in embryogenesis and neonate stages, the impact of LTβR signaling in adulthood remains unclear. Here, to overcome developmental defects, we generated mice with inducible ubiquitous genetic inactivation of LTβR in adult mice (iLTβRΔ/Δ mice) and redefined the role of LTβR signaling in organization of lymphoid organs, immune response to mucosal bacterial pathogen, IgA production and autoimmunity. In spleen, postnatal LTβR signaling is required for development of B cell follicles, follicular dendritic cells (FDCs), recruitment of neutrophils and maintenance of the marginal zone. Lymph nodes of iLTβRΔ/Δ mice were reduced in size, lacked FDCs, and had disorganized subcapsular sinus macrophages. Peyer`s patches were smaller in size and numbers, and displayed reduced FDCs. The number of isolated lymphoid follicles in small intestine and colon were also reduced. In contrast to LTβR-/- mice, iLTβRΔ/Δ mice displayed normal thymus structure and did not develop signs of systemic inflammation and autoimmunity. Further, our results suggest that LTβR signaling in adulthood is required for homeostasis of neutrophils, NK, and iNKT cells, but is dispensable for the maintenance of polyclonal IgA production. However, iLTβRΔ/Δ mice exhibited an increased sensitivity to C. rodentium infection and failed to develop pathogen-specific IgA responses. Collectively, our study uncovers new insights of LTβR signaling in adulthood for the maintenance of lymphoid organs, neutrophils, NK and iNKT cells, and IgA production in response to mucosal bacterial pathogen.

Keywords: Citrobacter rodentium; FDCs; IgA; LTβR; lymphoid organs; lymphotoxin.


Conflict of interest statement

The authors declare that the research was conducted in the absence of any commercial or financial relationships that could be construed as a potential conflict of interest.

Figures

Figure 1
Figure 1
LTβR signaling in adulthood is required for the maintenance of LNs and PPs. LTβRfl/fl (C) and iLTβRΔ/Δ (I) mice were treated with TAM by oral gavage one month before analysis. (A, B) MLN and ILN weights and total cell numbers. ILN weights are the combined weight for both ILNs isolated from each mouse. Per group, n=8-12 for MLN and n=7-14 for ILN. (C) Representative confocal images of frozen MLN sections stained with antibodies against B220 (blue), CD3 (red) and CD21/CD35 (green). (D) Representative confocal images of MLN sections stained with antibodies against B220 (blue), CD169 (green) and SIGNR1 (red). (E) Quantification of FDCs and SCS macrophages from panels C and D. SIGNR1 signal was quantified in the subcapsular sinus region. n=4 for each group. (F) CXCL13, CCL19 and CCL21 expression in MLN of LTβRfl/fl or iLTβRΔ/Δ mice determined by qPCR (n=6-7). (G) Number and diameter of PPs. n=11 mice per group. (H) Number of cells isolated from PPs of LTβRfl/fl or iLTβRΔ/Δ mice. (I) Representative confocal micrographs of frozen PP sections. n=5 mice per group. (J) Quantification of CR21/35 MFI within individual PPs. For panels I-J, n=3 per group. Scale bars are 100μm for all images. Collective data from 4 experiments is shown for (A, B, G). For (C–F, I, J), data from 1 of 2 similar experiments are shown. For (H), collective data from 2 of 3 experiments is shown. Significance was determined using Mann-Whitney or Unpaired t-test. Data shown are means ± SEM. Bars show the mean, symbols represent individual mice. Not significant (ns, p >0.05), *p < 0.05, **p < 0.01, ***p < 0.001, ****p < 0.0001.
Figure 2
Figure 2
Impact of inducible LTβR inactivation in adulthood on spleen microarchitecture. LTβRfl/fl (C) and iLTβRΔ/Δ (I) mice were treated with TAM by oral gavage one month before analysis. (A) Representative confocal images of frozen spleen sections stained with antibodies against B220 (white), CD21/CD35 (green), CD3 (red) and ER-TR-7 (yellow). (B) Quantification of FDCs. n=4 per group. (C) Expression of splenic CXCL13, CCL19, and CCL21 mRNA determined by qPCR (n=4-8). (D) Representative confocal images of frozen spleen sections stained with antibodies against B220 (white), CD169 (green), MAdCAM-1 (red) and SIGNR1 (yellow) to analyze the marginal zone structure. (E) Quantification of CD169, MAdCAM-1 and SIGNR1 expressing cells. n=4 per group. Scale bars = 100μm for all images. Data shown are means ± SEM. Bars show the mean, symbols represent individual mice. Data is from one of two experiments with similar results. Significance was determined using Mann-Whitney or Unpaired t-test. Not significant (ns, p > 0.05), *p < 0.05, **p < 0.01.
Figure 3
Figure 3
iLTβRΔ/Δ mice do not develop autoimmunity. (A) Representative H&E images of liver (scale bars 100μm), lung (scale bars 200μm), and thymus (scale bars 200μm) from iLTβRΔ/Δ mice at one (liver and lung) or two (thymus) months post TAM treatment. Oil treated LTβRfl/fl (C) and untreated LTβR-/- (L) mice were used as controls. Arrows indicate lymphoid infiltrates in LTβR-/- mice. N=5 for all groups. (B) Thymus weight. n=3-12. (C) Expression of Aire mRNA in thymus determined by qPCR (n=3-6 per group). (D) Analysis of anti-dsDNA antibodies by ELISA in mice 2-4 months after TAM treatment (n=20 for WT, n=14 for iLTβRΔ/Δ, n=9 for LTβR-/-). Data shown are means ± SEM. Bars show the mean, symbols represent individual mice. Data was derived from 1-2 experiments for all panels. Significance was determined using one-way ANOVA with Tukey’s correction. Not significant (ns, p>0.05).
Figure 4
Figure 4
Impact of LTβR signaling in adulthood on homeostasis of neutrophils, NK, and iNKT cells. LTβRfl/fl (C) and iLTβRΔ/Δ (I) mice were treated by oral gavage with oil or TAM one month before analysis. (A) Representative flow cytometry plots of neutrophils (Nph) in the spleens of iLTβRΔ/Δ and LTβRfl/fl mice. Graphs show % of Ly6G+ Lin-CD11b+ neutrophils in CD45+ gate for spleens and blood. (B) Expression of CXCL1 and CXCL2 in the spleen measured by qPCR. For panels (A, B), data shown is combined from 3 experiments. N=2-13 per genotype. (C) Representative flow cytometry plots of NK1.1+ NK cells in the spleen, liver, and thymus from iLTβRΔ/Δ and LTβRfl/fl mice. Right panels indicate % of NK cell frequencies in the CD45+ populations from spleen, liver, and thymus. (D) Representative flow cytometry plots of CD1d tet+TCRβ+ iNKT cells in the liver. Graphs show % of iNKT cell frequencies in the CD45+ populations of liver, thymus, and spleen. For panels (C, D), data shown is from two of three independent experiments. Significance was determined using one-way ANOVA with Tukey’s correction for multiple comparisons. All gating strategies are defined in Figure S2 . Data shown are means ± SEM. Bars show the mean, symbols represent individual mice. Not significant (ns, p > 0.05), *p < 0.05, **p < 0.01, ***p < 0.001, ****p < 0.0001.
Figure 5
Figure 5
LTβR signaling in adulthood is dispensable for the IgA production. iLTβRΔ/Δ (I) mice were analyzed 4 months after TAM administration. LTβRfl/fl (C) and LTβR-/- (L) mice were used as controls. (A) Total IgA, IgM and IgG levels measured by ELISA (n=3-9 mice per group). Significance determined by one-way ANOVA with Dunn’s correction. Collective data from two separate experiments is shown. (B) Flow cytometry analysis of immunoglobulin producing cells from colon LP: CD138-CD19+GL7- B cells, CD138-CD19+GL-7+ germinal center (GC) B cells, CD138+CD19+ plasmablasts (PB), CD138+CD19- plasma cells (PC). Graphs depict % of cells in CD45+ gate. N=3 for all groups. Significance was determined by unpaired t-test. Data shown is from one representative experiment out of two. Gating strategy shown in Figure S5 . Data shown are means ± SEM. Not significant (ns, p > 0.05), *p < 0.05, **p < 0.01.
Figure 6
Figure 6
LTβR signaling contributes to protection against C. rodentium and is required for the generation of C. rodentium-specific IgA responses. (A) Scheme for C. rodentium infection and TAM treatment. (B) Percentage body weight change over the course of infection. (C) Analysis of survival. Significance was determined using the Log-rank (Mantel-Cox) and Gehan-Breslow-Wilcoxon tests. (D–F) Bacterial titers in blood (D), feces (E) and colons (F) at the indicated timepoints. (G) Colon length and spleen weight at 21d post infection. (H) Expression of IL-22, RegIIIβ and RegIIIγ in the colon determined by qPCR at 6d post infection. (I, J) Analysis of C. rodentium-specific fecal IgA (I), serum IgG (J), and serum IgM (K) levels by ELISA. Results shown are representative figures from three independent experiments (n=3-11 mice per group). Significance for panels B, E, I, and J were determined by two-way ANOVA followed by Mann-Whitney tests. For panels D, F, G, H and K significance was determined using Mann-Whitney tests. Data shown are means ± SEM. Bars show the mean, symbols represent individual mice. Not significant (ns, p > 0.05), *p < 0.05, **p < 0.01, ***p < 0.001, ****p < 0.0001.

References

    1. Ware CF. Network Communications: Lymphotoxins, Light, and Tnf. Annu Rev Immunol (2005) 23:787–819. 10.1146/annurev.immunol.23.021704.115719 - DOI - PubMed
    1. Fu YX, Chaplin DD. Development and Maturation of Secondary Lymphoid Tissues. Annu Rev Immunol (1999) 17:399–433. 10.1146/annurev.immunol.17.1.399 - DOI - PubMed
    1. van de Pavert SA, Mebius RE. New Insights Into the Development of Lymphoid Tissues. Nat Rev Immunol (2010) 10:664–74. 10.1038/nri2832 - DOI - PubMed
    1. Onder L, Ludewig B. A Fresh View on Lymph Node Organogenesis. Trends Immunol (2018) 39:775–87. 10.1016/j.it.2018.08.003 - DOI - PubMed
    1. Browning JL. Inhibition of the Lymphotoxin Pathway as a Therapy for Autoimmune Disease. Immunol Rev (2008) 223:202–20. 10.1111/j.1600-065X.2008.00633.x - DOI - PubMed

Publication types

MeSH terms