

Identification of Genomic Regions Influencing N-Metabolism and N-Excretion in Lactating Holstein- Friesians
- PMID: 34335696
- PMCID: PMC8318802
- DOI: 10.3389/fgene.2021.699550
Identification of Genomic Regions Influencing N-Metabolism and N-Excretion in Lactating Holstein- Friesians
Abstract
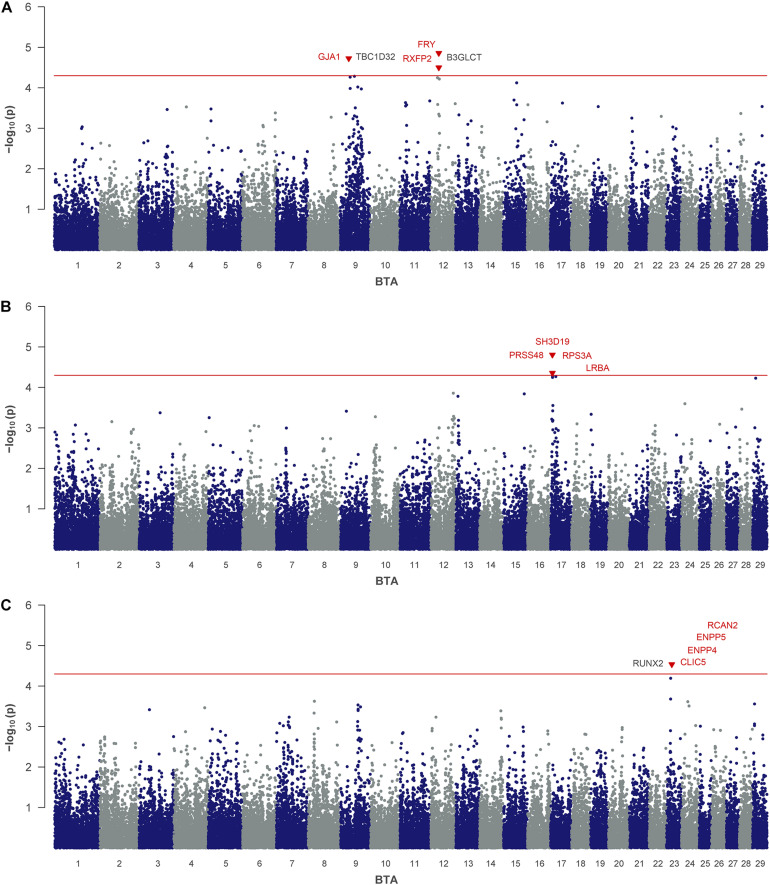
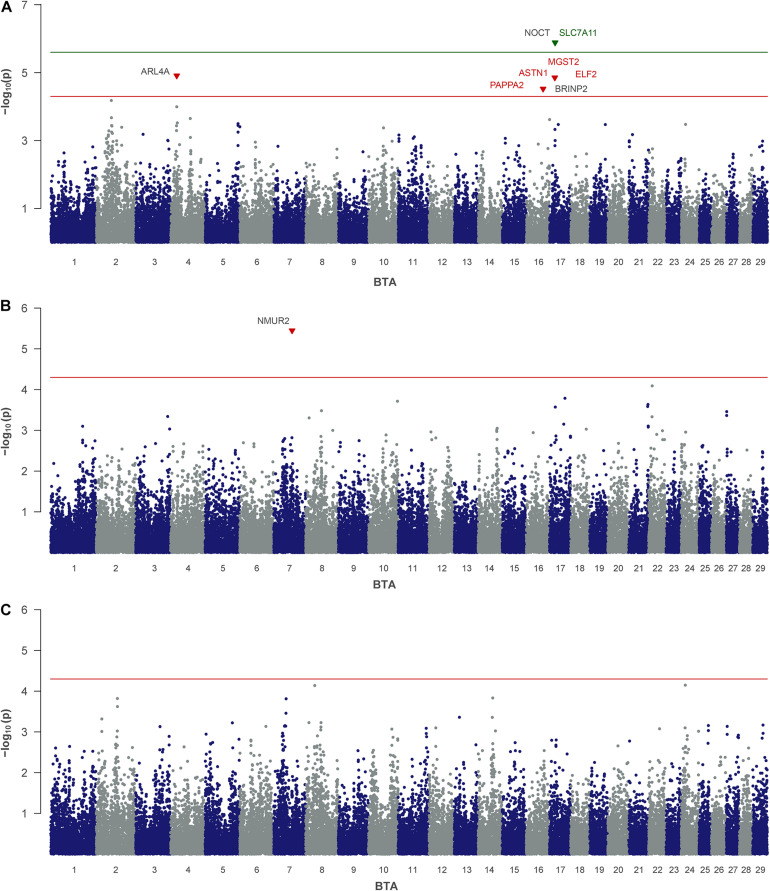
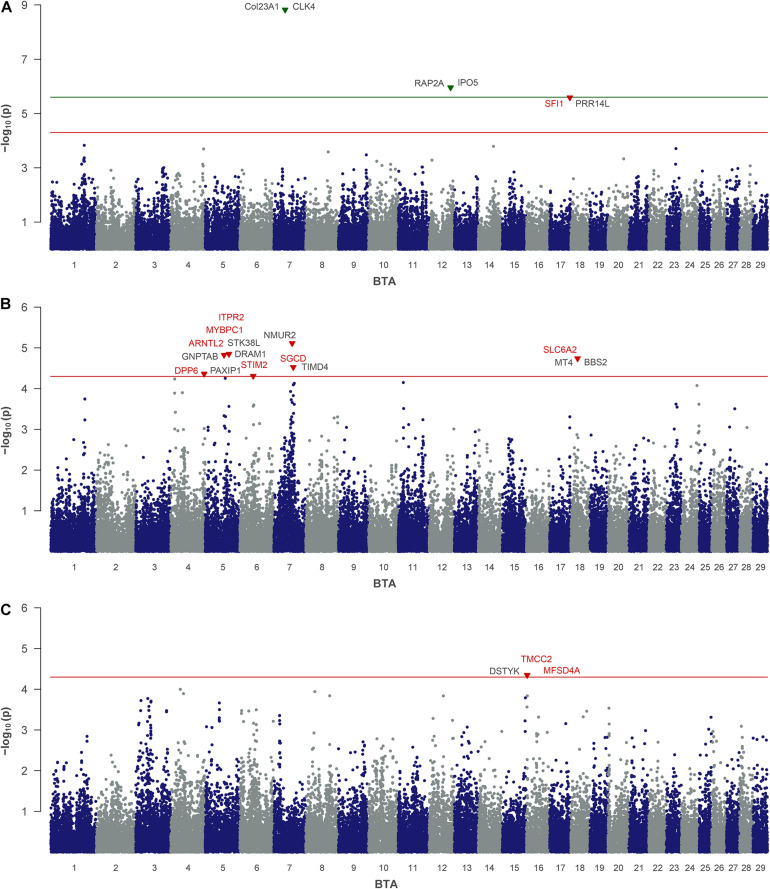
Excreted nitrogen (N) of dairy cows contribute to environmental eutrophication. The main N-excretory metabolite of dairy cows is urea, which is synthesized as a result of N-metabolization in the liver and is excreted via milk and urine. Genetic variation in milk urea (MU) has been postulated but the complex physiology behind the trait as well as the tremendous diversity of processes regulating the N-metabolism impede the consistent determination of causal regions in the bovine genome. In order to map the genetic determinants affecting N-excretion, MU and eight other N-excretory metabolites in milk and urine were assessed in a genome-wide association study. Therefore phenotypes of 371 Holstein- Friesians were obtained in a trial on a dairy farm under near commercial conditions. Genotype data comprised SNP information of the Bovine 50K MD Genome chip (45,613 SNPs). Significantly associated genomic regions for MU concentration revealed GJA1 (BTA 9), RXFP1, and FRY1 (both BTA 12) as putative candidates. For milk urea yield (MUY) a promising QTL on BTA 17 including SH3D19 emerged, whereas RCAN2, CLIC5, ENPP4, and ENPP5 (BTA 23) are suggested to influence urinary urea concentration. Minor N-fractions in milk (MN) may be regulated by ELF2 and SLC7A11 (BTA 17), whilst ITPR2 and MYBPC1 (BTA 5), STIM2 (BTA 6), SGCD (BTA 7), SLC6A2 (BTA 18), TMCC2 and MFSD4A (BTA 16) are suggested to have an impact on various non-urea-N (NUN) fractions excreted via urine. Our results highlight genomic regions and candidate genes for N-excretory metabolites and provide a deeper insight into the predisposed component to regulate the N-metabolism in dairy cows.
Keywords: GWAS; cattle; emission; milk urea; nitrogen; non-urea nitrogen.
Copyright © 2021 Honerlagen, Reyer, Oster, Ponsuksili, Trakooljul, Kuhla, Reinsch and Wimmers.
Conflict of interest statement
The authors declare that the research was conducted in the absence of any commercial or financial relationships that could be construed as a potential conflict of interest.
Figures
References
-
- Balcells J., Guada J. A., Castrillo C., Gasa J. (1991). Urinary excretion of allantoin and allantoin precursors by sheep after different rates of purine infusion into the duodenum. J. Agric. Sci. 116 309–317.
-
- Brazert M., Kranc W., Nawrocki M. J., Sujka-Kordowska P., Konwerska A., Jankowski M., et al. (2020). New markers for regulation of transcription and macromolecule metabolic process in porcine oocytes during in vitro maturation. Mol. Med. Rep. 21 1537–1551. 10.3892/mmr.2020.10963 - DOI - PMC - PubMed
LinkOut - more resources
Full Text Sources
Research Materials