. 2021 Jul 16:12:699910.
doi: 10.3389/fgene.2021.699910. eCollection 2021.

Comprehensive Analysis of the Value of SMYD Family Members in the Prognosis and Immune Infiltration of Malignant Digestive System Tumors

Affiliations

Comprehensive Analysis of the Value of SMYD Family Members in the Prognosis and Immune Infiltration of Malignant Digestive System Tumors

Donghui Liu et al. Front Genet. .

Abstract

Background: The SET and MYND domain-containing (SMYD) gene family comprises a set of genes encoding lysine methyltransferases. This study aimed to clarify the relationship between the expression levels of SMYD family members and the prognosis and immune infiltration of malignant tumors of the digestive system.

Methods: The Oncomine, Ualcan, Kaplan-Meier Plotter, cBioPortal, Metascape, and TIMER databases and tools were used to analyze the correlation of SMYD family mRNA expression, clinical stage, TP53 mutation status, prognostic value, gene mutation, and immune infiltration in patients with esophageal carcinoma (ESCA), liver hepatocellular carcinoma (LIHC), and stomach adenocarcinoma (STAD).

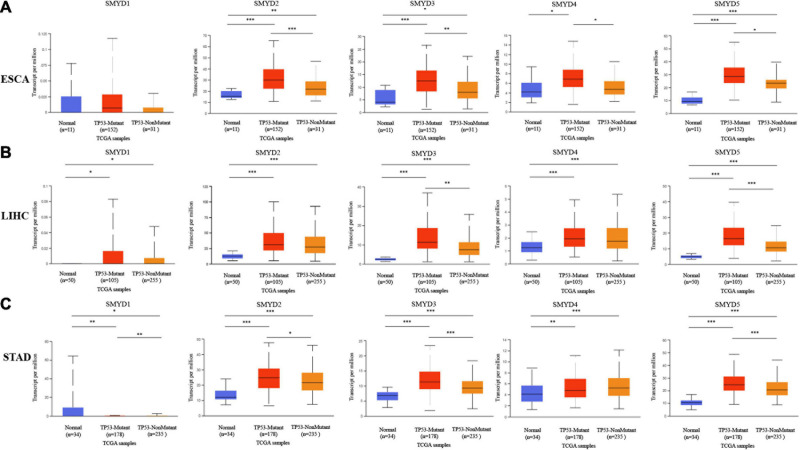
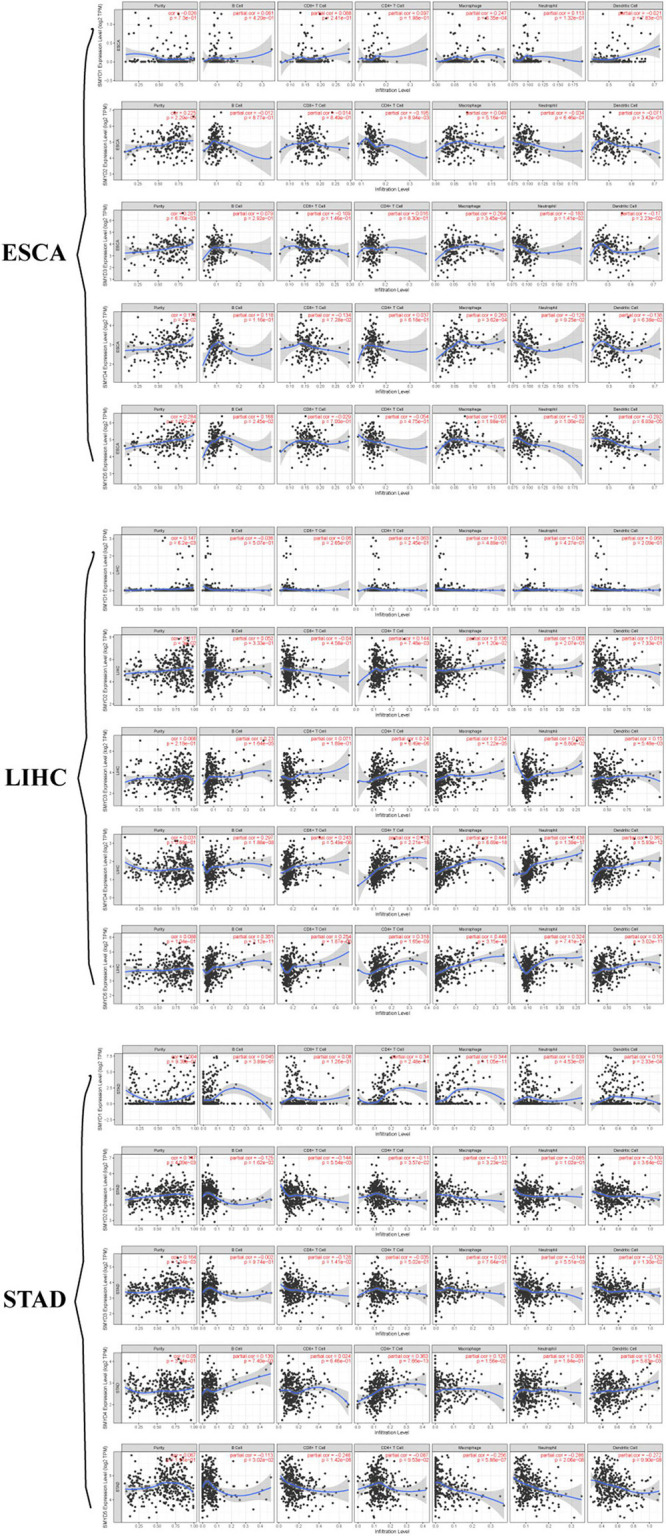
Results: In ESCA, the mRNA expression of SMYD2/3/4/5 was significantly correlated with the incidence rate, that of SMYD2/3 with the clinical stage, that of SMYD2/3/4/5 with TP53 mutation status, that of SMYD2/4/5 with overall survival (OS), and that of SMYD1/2/3/4 with relapse-free survival (RFS). In LIHC, the mRNA expression of SMYD1/2/3/4/5 was significantly correlated with the incidence rate, that of SMYD2/4/5 with the clinical stage, that of SMYD3/5 with TP53 mutation status, that of SMYD2/3/4/5 with OS, and that of SMYD3/5 with RFS. In STAD, the mRNA expression of SMYD2/3/4/5 was significantly correlated with the incidence rate, that of SMYD1/4 with the clinical stage, that of SMYD1/2/3/5 with TP53 mutation status, that of SMYD1/3/4 with OS, and that of SMYD1/3 with RFS. Furthermore, the function of SMYD family mutation-related genes in ESCA, LIHC, and STAD patients was mainly related to pathways, such as mitochondrial gene expression, mitochondrial matrix, and mitochondrial translation. The expression of SMYD family genes was significantly correlated with the infiltration of six immune cell types and eight types of immune check sites.

Conclusion: SMYD family genes are differentially expressed and frequently mutated in malignant tumors of the digestive system (ESCA, LIHC, and gastric cancer). They are potential markers for prognostic prediction and have important significance in immunity and targeted therapy.

Keywords: SMYD; TP53; clinical stage; gene mutation; immune infiltration; malignant tumors; prognosis.


Conflict of interest statement

The authors declare that the research was conducted in the absence of any commercial or financial relationships that could be construed as a potential conflict of interest.

Figures

FIGURE 1
FIGURE 1
The mRNA expression levels of SMYD family members in 20 types of cancers (Oncomine). The graph shows the numbers of datasets with statistically significant mRNA high expression (red) or low expression (blue) of the target gene. The threshold was designed with following parameters: P-value of 0.01 and fold change of 1.5, and data type of mRNA (A). The mRNA expression levels of SMYD family members in ESCA, LIHC, STAD (red), and normal tissues of esophagus, liver and stomach (blue) (Timer) (P < 0.05, ∗∗P < 0.01, ∗∗∗P < 0.001) (B). The mRNA expression levels of SMYD family members in ESCA, LIHC, STAD (red), and normal tissues of esophagus, liver, and stomach (blue) (UALCAN) (P < 0.05, ∗∗P < 0.01, ∗∗∗P < 0.001) (C).
FIGURE 2
FIGURE 2
The relationship between mRNA expression levels of SMYD family members and clinical stages in ESCA, LIHC, STAD (stage-1/2/3/4 is orange, brown, green, and red, respectively), and normal tissues of esophagus, liver, and stomach (blue) (UALCAN) (A–C) (P < 0.05, ∗∗P < 0.01, ∗∗∗P < 0.001).
FIGURE 3
FIGURE 3
The relationship between mRNA expression levels of SMYD family members and TP53 mutation in ESCA, LIHC, STAD (mutation: red, non-mutation: orange), and normal tissues of esophagus, liver, and stomach (blue) (UALCAN) (A–C) (P < 0.05, ∗∗P < 0.01, ∗∗∗P < 0.001).
FIGURE 4
FIGURE 4
The prognostic value of mRNA expression levels of SMYD family members in ESCA, LIHC, and STAD patients (Kaplan–Meier plotter). Plot the relationship between high expression (red) and low expression (black) of target gene mRNA and OS and RFS, respectively (A–F) (P < 0.05 with statistical significance).
FIGURE 5
FIGURE 5
Mutation of SMYD family members in ESCA, LIHC, and STAD patients (cBioPortal). A visual summary of mutation frequency of SMYD family members (A–C). Summary of mutation frequency of SMYD family members in ESCA, LIHC, and STAD patients (D). Kaplan–Meier plotter was used to compare the relationship between gene mutation (red) and gene non-mutation (blue) of SMYD family members and OS and PFS (E–G) (P < 0.05 with statistical significance).
FIGURE 6
FIGURE 6
Enrichment analysis of SMYD family members and related mutant genes in ESCA, LIHC, and STAD (Metascape). Heat maps of GO and KEGG enrichment analysis of SMYD family members and 124 adjacent genes related to their mutations were stained with P-value (A). Term-enriched network: colored by cluster ID, where nodes sharing the same cluster ID are usually close to each other (B), colored by P-value, terms containing more genes tend to have more significant P-values (C). For the MCODE components identified in the protein–protein interaction network, the three best score items divided by P-value are used as the functional description of the corresponding components, which are represented by the grid diagram (D).
FIGURE 7
FIGURE 7
Correlation between SMYD members and immune cell infiltration, X-axis is SMYD members, Y-axis is immune infiltrates, P-value greater than 0 is positive correlation, P-value less than 0 is negative correlation. (Timer) (P < 0.05, with statistical significance).
FIGURE 8
FIGURE 8
Correlation between SMYD members and immune cell biomarkers, X-axis is SMYD members, Y-axis is immune cell biomarkers, P-value greater than 0 is positive correlation, P-value less than 0 is negative correlation. (Timer) (P < 0.05 is statistically significant).

References

    1. Bader G., Hogue C. (2003). An automated method for finding molecular complexes in large protein interaction networks. BMC Bioinformatics 4:2. 10.1186/1471-2105-4-2 - DOI - PMC - PubMed
    1. Banks M., Graham D., Jansen M. (2019). British society of gastroenterology guidelines on the diagnosis and management of patients at risk of gastric adenocarcinoma. Gut 68 1545–1575. 10.1136/gutjnl-2018-318126 - DOI - PMC - PubMed
    1. Berkholz J., Orgeur M., Stricker S. (2015). skNAC and Smyd1 in transcriptional control. Exp. Cell Res. 336 182–191. 10.1016/j.yexcr.2015.06.019 - DOI - PubMed
    1. Bray F., Ferlay J., Soerjomataram I. (2018). Global cancer statistics 2018: GLOBOCAN estimates of incidence and mortality worldwide for 36 cancers in 185 countries. CA Cancer J. Clin. 68 394–424. 10.3322/caac.21492 - DOI - PubMed
    1. Carr S., Munro S., Sagum C. (2017). Tudor-domain protein PHF20L1 reads lysine methylated retinoblastoma tumour suppressor protein. Cell Death Differ. 24 2139–2149. 10.1038/cdd.2017.135 - DOI - PMC - PubMed