. 2021 Jul 3;12(17):5296-5309.
doi: 10.7150/jca.56138. eCollection 2021.

MicroRNA-133 Targets Phosphodiesterase 1C in Drosophila and Human Oral Cancer Cells to Regulate Epithelial-Mesenchymal Transition

Affiliations

MicroRNA-133 Targets Phosphodiesterase 1C in Drosophila and Human Oral Cancer Cells to Regulate Epithelial-Mesenchymal Transition

Ji Eun Jung et al. J Cancer. .

Abstract

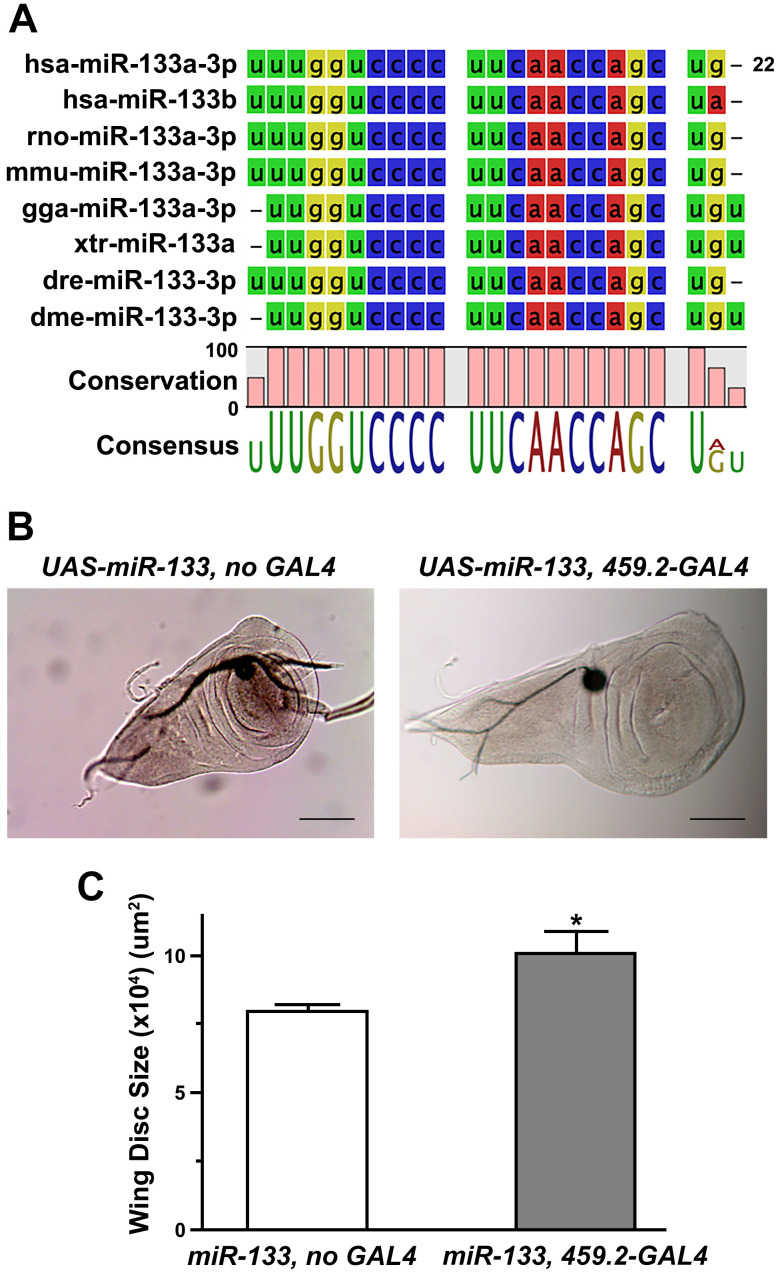
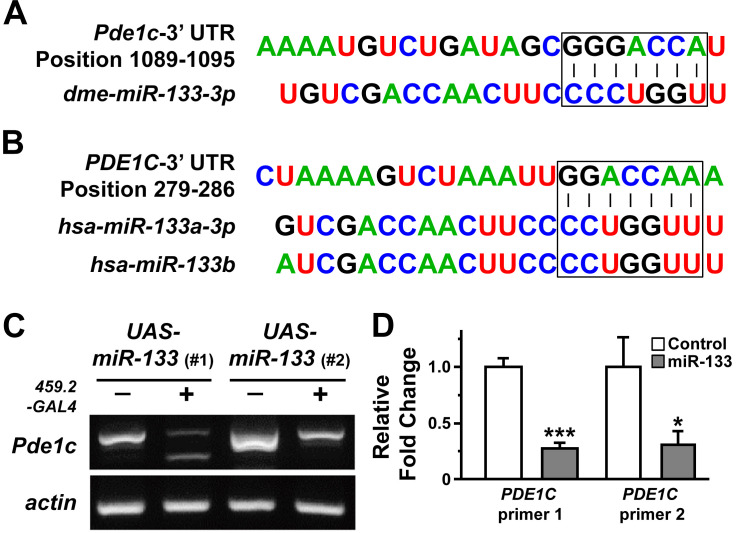
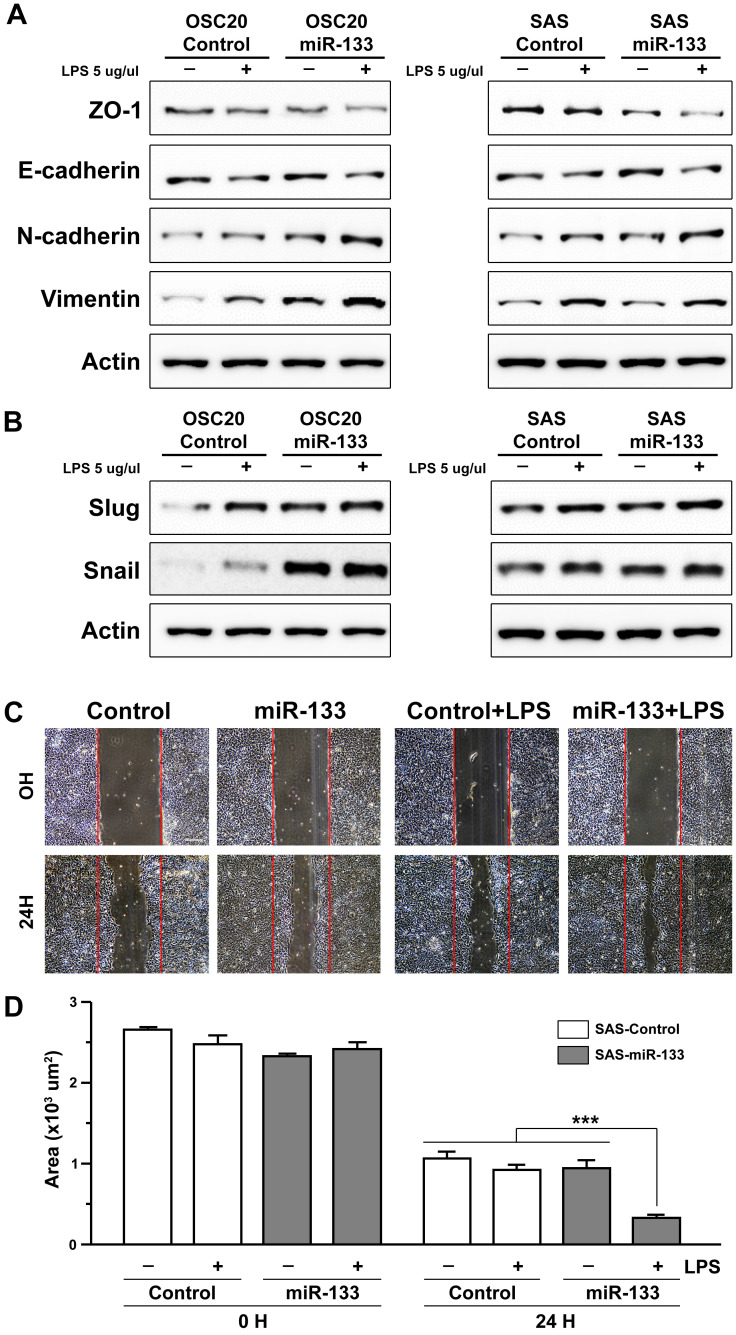
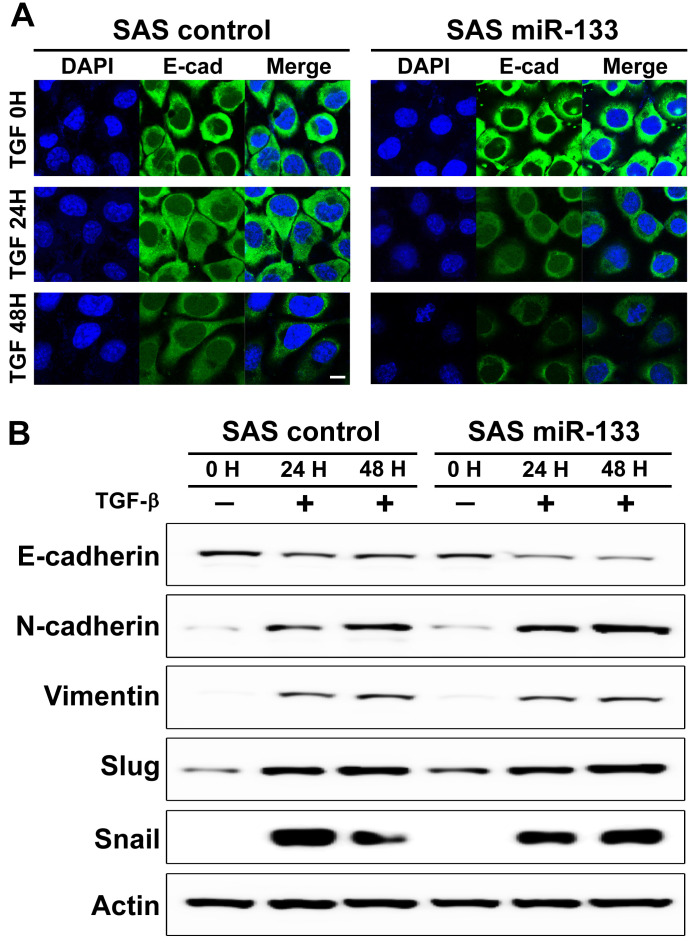
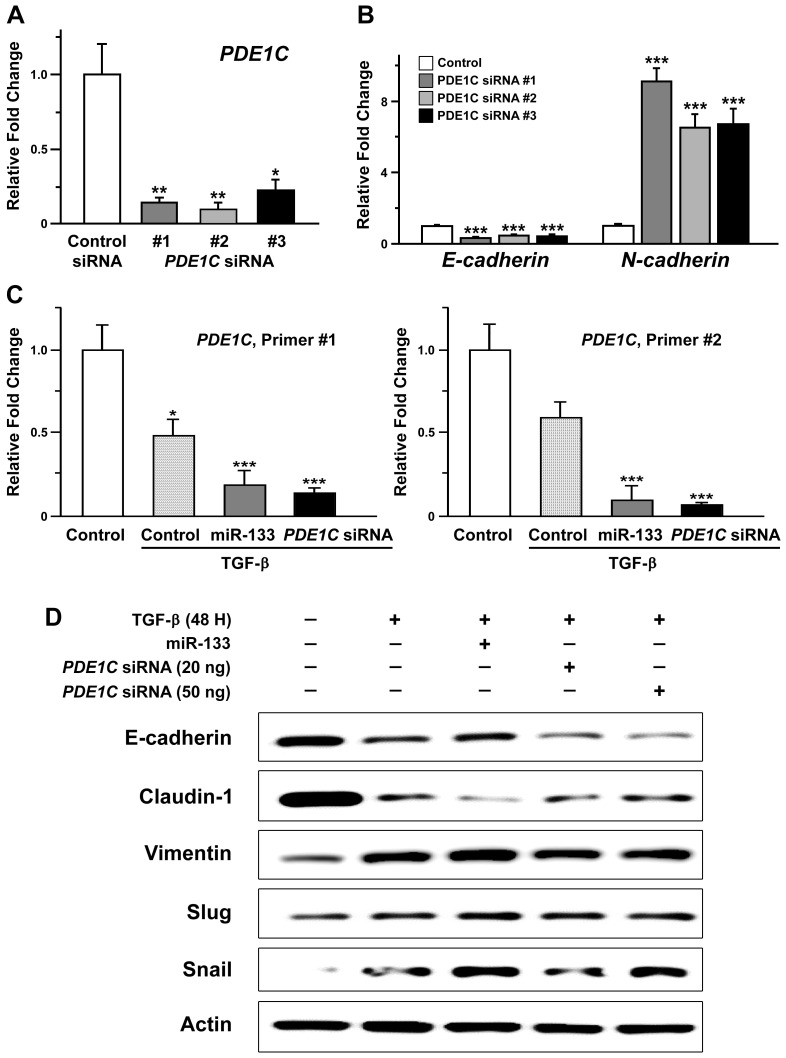
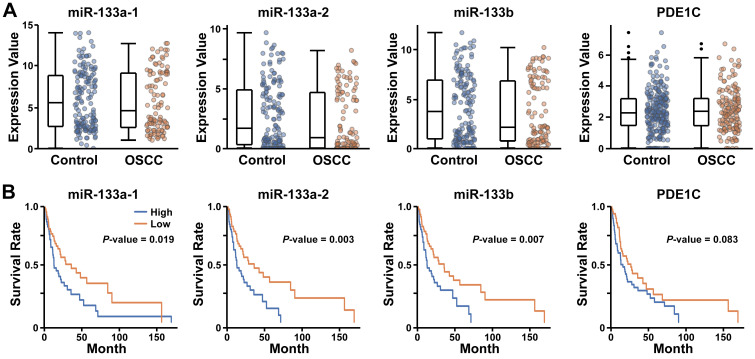
Non-coding microRNAs (miRNAs) have been proposed to play diverse roles in cancer biology, including epithelial-mesenchymal transition (EMT) crucial for cancer progression. Previous comparative studies revealed distinct expression profiles of miRNAs relevant to tumorigenesis and progression of oral cancer. With putative targets of these miRNAs mostly validated in vitro, it remains unclear whether similar miRNA-target relationships exist in vivo. In this study, we employed a hybrid approach, utilizing both Drosophila melanogaster and human oral cancer cells, to validate projected miRNA-target relationships relevant to EMT. Notably, overexpression of dme-miR-133 resulted in significant tissue growth in Drosophila larval wing discs. The RT-PCR analysis successfully validated a subset of its putative targets, including Pde1c. Subsequent experiments performed in oral cancer cells confirmed conserved targeting of human PDE1C by hsa-miR-133. Furthermore, the elevated level of miR-133 and its targeting of PDE1C was positively correlated with enhanced migrative ability of oral cancer cells treated with LPS, along with the molecular signature of a facilitated EMT process induced by LPS and TGF-β. The analysis on the RNAseq data also revealed a negative correlation between the expression level of hsa-miR-133 and the survival of oral cancer patients. Taken together, our mammal-to-Drosophila-to-mammal approach successfully validates targeting of PDE1C by miR-133 both in vivo and in vitro, underlying the promoted EMT phenotypes and potentially influencing the prognosis of oral cancer patients. This hybrid approach will further aid to widen our scope in investigation of intractable human malignancies, including oral cancer.

Keywords: Drosophila melanogaster; Epithelial-Mesenchymal Transition; PDE1C; mammal-to-Drosophila-to-mammal approach; microRNA-133; oral cancer.


Conflict of interest statement

Competing Interests: The authors have declared that no competing interest exists.

Figures

Figure 1
Figure 1
Promoted tissue growth induced by overexpression of Drosophila miR-133. (A) The sequences of mature miRNAs are compared between Drosophila (dme-miR-133) and various mammalian miR-133s (hsa, Homo sapiens; rno, Rattus norvegicus; mmu, Mus musculus; gga, Gallus gallus; xtr, Xenopus tropicalis; dre, Danio rerio). Conserved sequences are indicated at the bottom of each comparison. (B) Representative images of Drosophila wing discs are shown for those with (right) and without overexpression of miR-133 (left). Scale bar, 100 μm. (C) The pooled data are shown for measurements of the size of wing discs in each genotype indicated. The number of wing discs examined: 9 and 18 for UAS-miR-133 with and without 459.2-GAL4, respectively. Mean ± SEM values are indicated. *, P<0.05.
Figure 2
Figure 2
Downregulation of PDE1C by overexpression of miR-133 in both Drosophila wing discs and human oral cancer cells. (A and B) The putative target sites of miR-133 are shown within the 3'-UTR regions of Drosophila (A) and human PDE1C (B). (C) A representative result of RT-PCR reactions is shown to visualize miR-133-dependent downregulation of miR-133 in Drosophila wing discs. Two independent lines of UAS-miR-133 (#1 and #2) are used for comparison. (D) The pooled data from quantitative RT-PCR analyses are shown for visualization of miR-133-dependent downregulation of PDE1C in a human oral cancer cell line, SAS cells, with stable expression of miR-133. Two independent sets of primers specific for PDE1C are used for analysis. Mean ± SEM values are indicated for experiments repeated three times. Two-sample t-test is performed. *, P<0.05 and ***, P<0.001 for control vs. miR-133.
Figure 3
Figure 3
miR-133-dependent facilitation of LPS-induced epithelial-mesenchymal transition. (A and B) The levels of molecular markers characteristic of EMT are indicated by western blot analyses upon an exposure of two independent oral cancer cells, OSC20 (left) and SAS (right) to LPS, in the presence (miR-133) and absence of stable expression of miR-133 (control). (C) The artificially generated gap regions of cultured SAS cell clusters with (miR-133) and without stable expression of miR-133 (control) are shown before (0H) and after 24 hour-long treatments of LPS (24H). The initial gap generated by scrapping is indicated with red lines in each image. Scale bar, 10 µm. (D) A quantitative measurement of the wound area is shown for each group before and after a 24 hour-long treatment of LPS. Mean ±SEM values are indicated for six different regions in cultures. One-way ANOVA test is performed. ***, P<0.001 for comparisons among the experimental conditions indicated.
Figure 4
Figure 4
miR-133-dependent facilitation of TGF-β-induced epithelial-mesenchymal transition in oral cancer cells. (A) Representative images of confocal microscopy are shown for visualization of E-cadherin following an exposure of SAS oral cancer cells to TGF-β for up to 48 hours, in the presence (miR-133) and absence of stable expression of miR-133 (control). Scale bar, 10 µm. (B) The levels of molecular markers characteristic of EMT are indicated by a western blot analysis upon an exposure of SAS cells to TGF-β, in the presence (miR-133) and absence of stable expression of miR-133 (control).
Figure 5
Figure 5
Facilitated epithelial-mesenchymal transition induced by downregulation of PDE1C in oral cancer cells. (A) The relative levels of PDE1C mRNAs are shown for SAS cells with transfection of three independent short-interfering RNAs (siRNAs) against PDE1C. Mean ± SEM values are indicated for experiments repeated three times. One-way ANOVA test is performed. *, P<0.05 and **, P<0.01 for control siRNA vs. other groups. (B) The transcript levels of E-cadherin and N-cadherin are compared in SAS cells following transfection of three independent siRNAs against PDE1C. Mean ± SEM values are indicated for experiments repeated three times. One-way ANOVA test is performed. ***, P<0.001 for control siRNA vs. other groups. (C) The transcript levels of PDE1C are measured upon an exposure of SAS cells to TGF- β, in the presence (miR-133) and absence of stable expression of miR-133 (control) as well as with transfection of PDE1C siRNAs. Two independent sets of primers specific for PDE1C are used for analysis. Mean ± SEM values are indicated for experiments repeated three times. One-way ANOVA test is performed. *, P<0.05 and ***, P<0.001 for control vs. other groups. (D) The levels of molecular markers characteristic of EMT are indicated by a western blot analysis upon an exposure of SAS cells to TGF-β, in the presence (miR-133) and absence of stable expression of miR-133 (control) as well as with transfection of PDE1C siRNAs at two different concentrations.
Figure 6
Figure 6
Enhanced survival of oral cancer patients with lower levels of miR-133 and PDE1C. (A) The relative expression levels of three different miR-133s (miR-133a-1 (miR-133a-5p), miR-133a-2 (miR-133a-3p) and miR-133b) and PDE1C are compared between 236 control and 145 OSCC tumor samples deduced from Broad GDAC Firehose (https://gdac.broadinstitute.org/) (see Materials and Methods for details). (B) The survival rates of OSCC patients with differential expression of miR-133s and PDE1C are visualized for comparisons. The significance level of a single analysis is indicated in each plot.

Similar articles

Cited by

References

    1. Bartel DP. MicroRNAs: genomics, biogenesis, mechanism, and function. Cell. 2004;116:281–97. - PubMed
    1. De Angelis R, Sant M, Coleman MP, Francisci S, Baili P, Pierannunzio D. et al. Cancer survival in Europe 1999-2007 by country and age: results of EUROCARE-5-a population-based study. Lancet Oncol. 2014;15:23–34. - PubMed
    1. Pignon JP, le Maitre A, Maillard E, Bourhis J, Group M-NC. Meta-analysis of chemotherapy in head and neck cancer (MACH-NC): an update on 93 randomised trials and 17,346 patients. Radiother Oncol. 2009;92:4–14. - PubMed
    1. Hussein AA, Helder MN, de Visscher JG, Leemans CR, Braakhuis BJ, de Vet HCW. et al. Global incidence of oral and oropharynx cancer in patients younger than 45 years versus older patients: A systematic review. Eur J Cancer. 2017;82:115–27. - PubMed
    1. Soga D, Yoshiba S, Shiogama S, Miyazaki H, Kondo S, Shintani S. microRNA expression profiles in oral squamous cell carcinoma. Oncol Rep. 2013;30:579–83. - PubMed

LinkOut - more resources