

Snail1 expression in endothelial cells controls growth, angiogenesis and differentiation of breast tumors
- PMID: 34335957
- PMCID: PMC8315050
- DOI: 10.7150/thno.61881
Snail1 expression in endothelial cells controls growth, angiogenesis and differentiation of breast tumors
Abstract
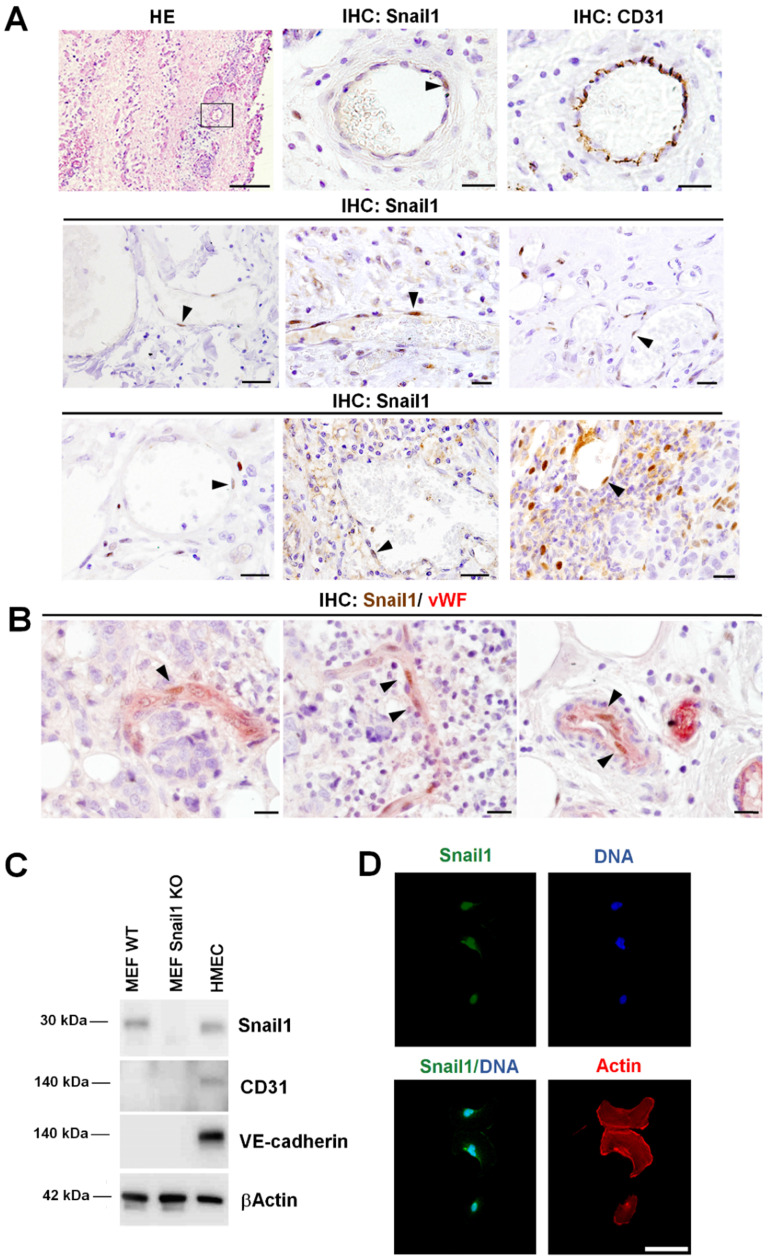
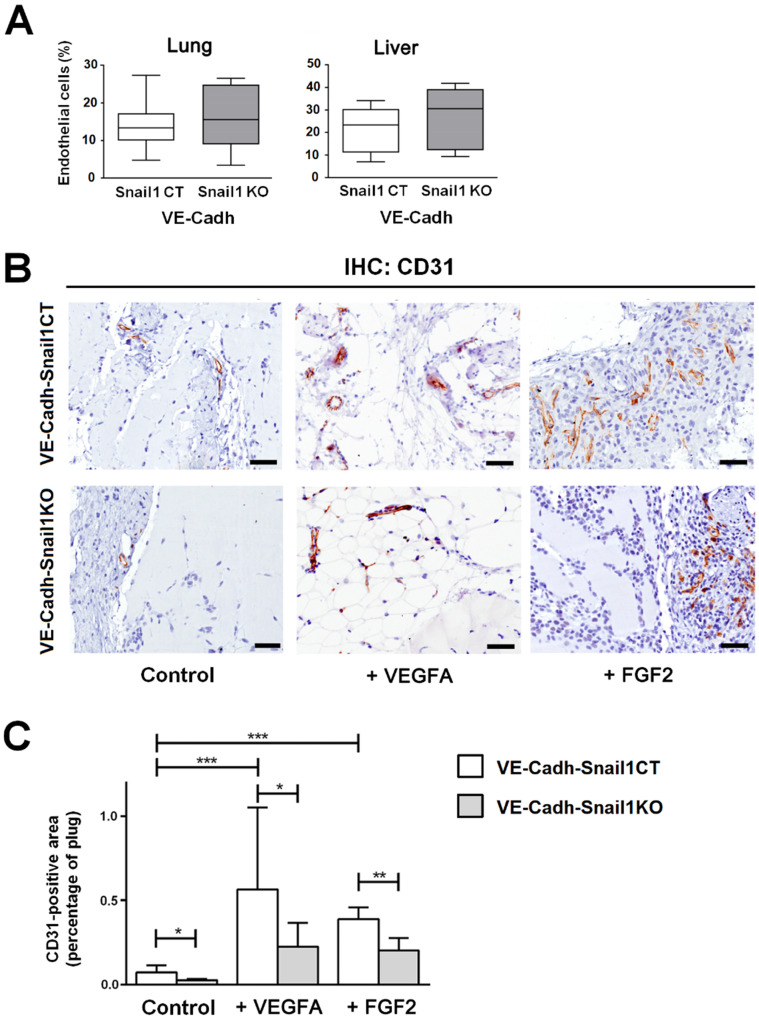
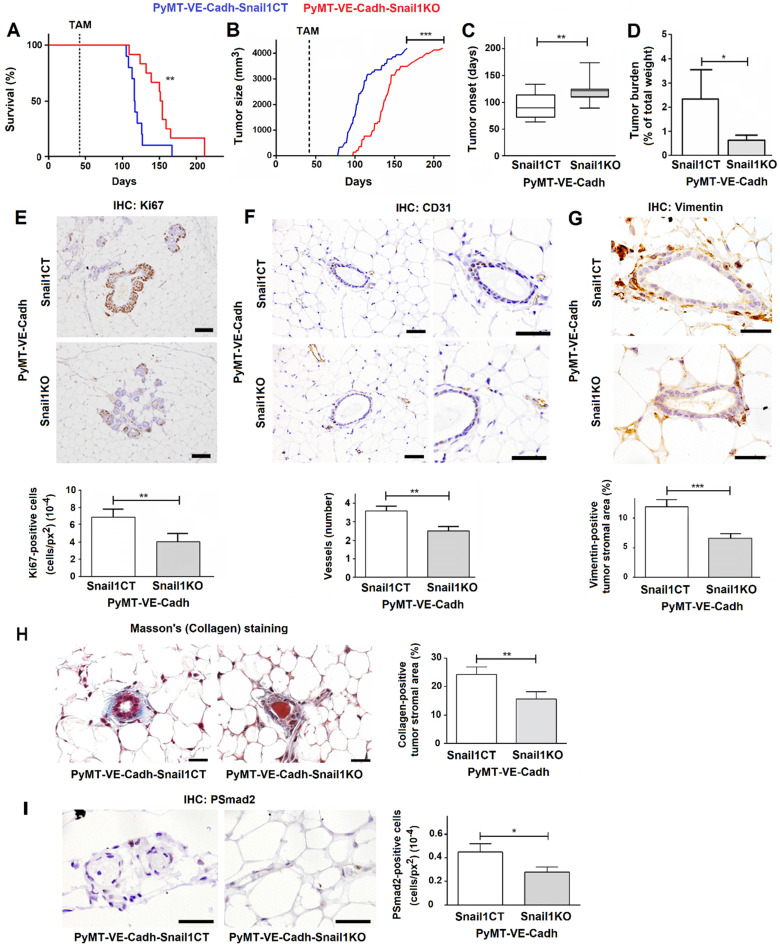
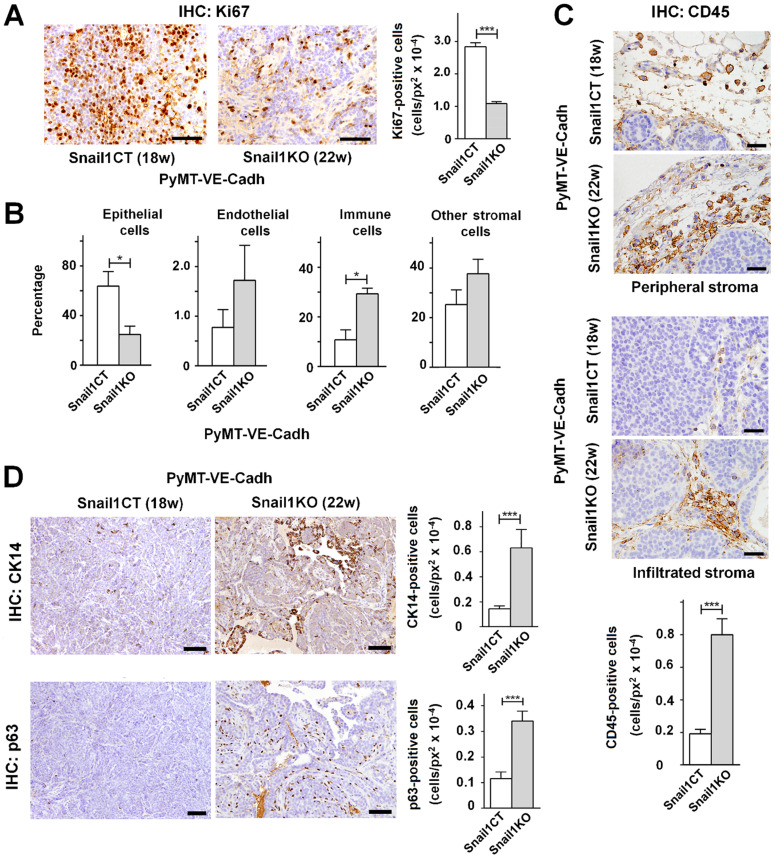
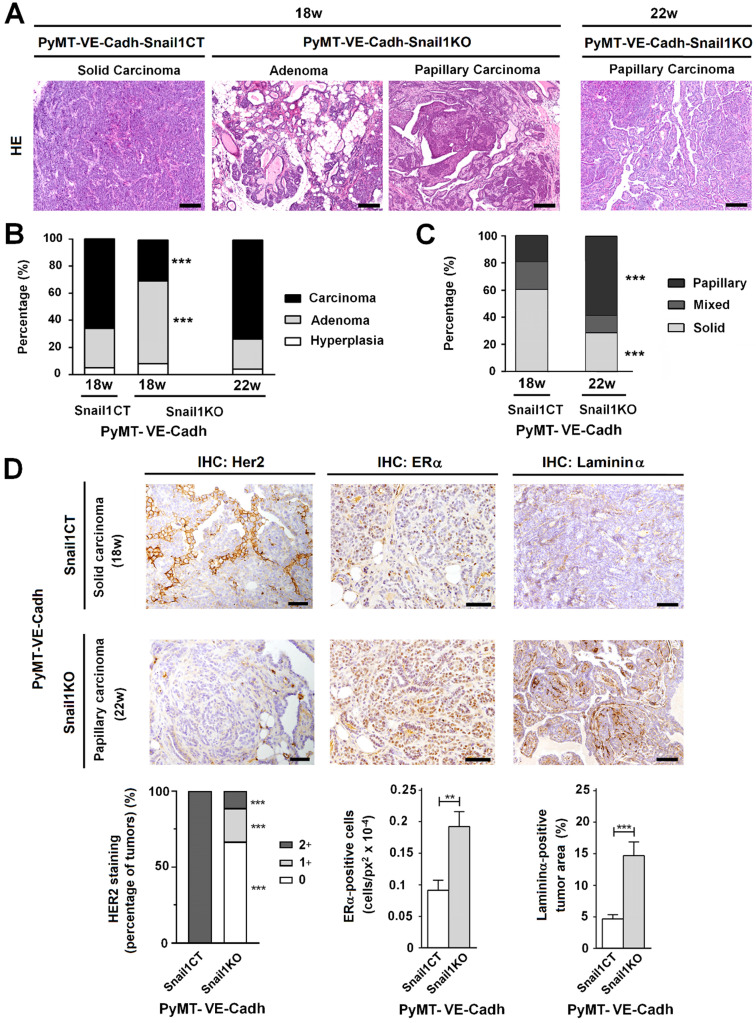
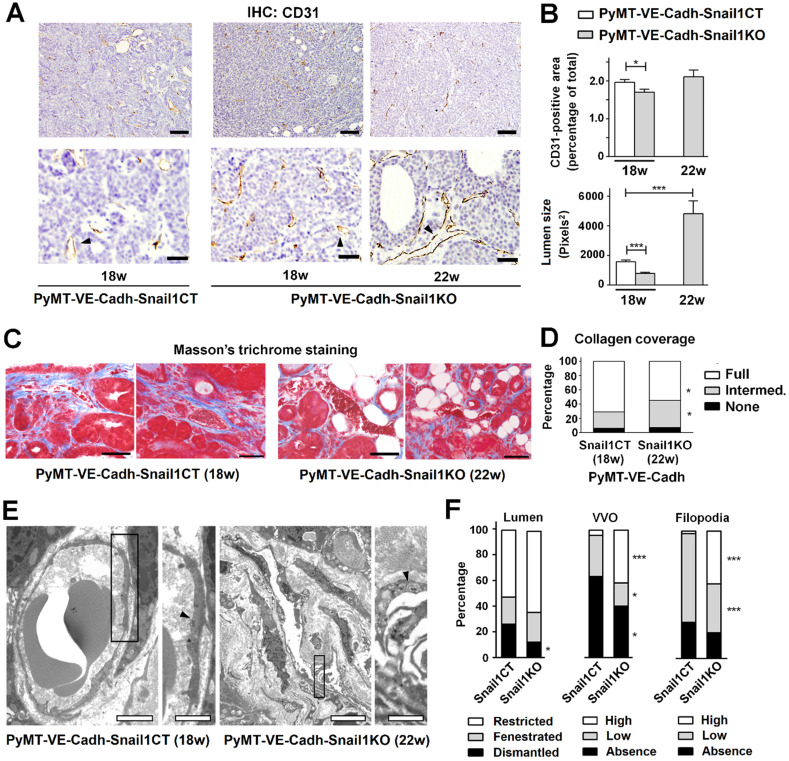
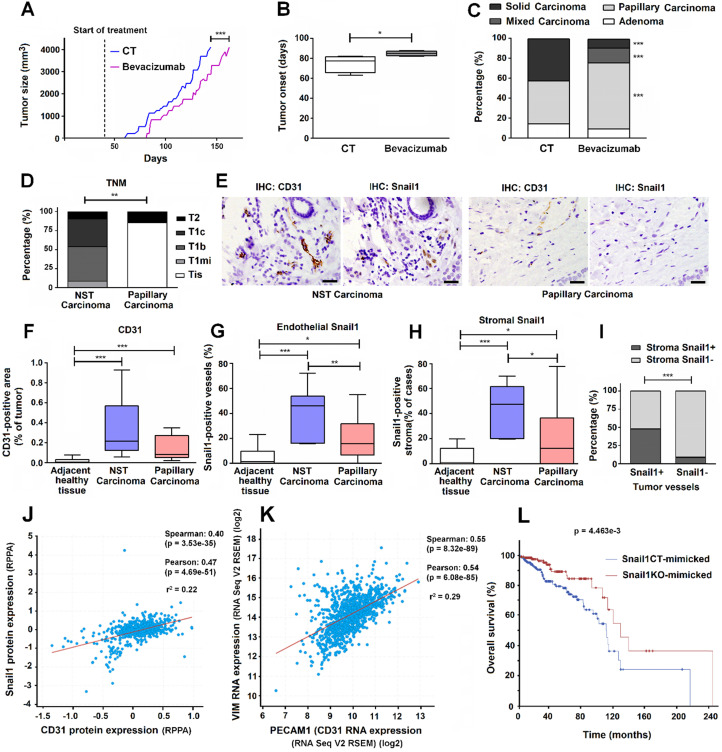
Snail1 is a transcriptional factor required for epithelial to mesenchymal transition and activation of cancer-associated fibroblasts (CAF). Apart from that, tumor endothelial cells also express Snail1. Here, we have unraveled the role of Snail1 in this tissue in a tumorigenic context. Methods: We generated transgenic mice with an endothelial-specific and inducible Snail1 depletion. This murine line was crossed with MMTV-PyMT mice that develop mammary gland tumors and the consequence of Snail1 depletion in the endothelium were investigated. We also interfere Snail1 expression in cultured endothelial cells. Results: Specific Snail1 depletion in the endothelium of adult mice does not promote an overt phenotype; however, it delays the formation of mammary gland tumors in MMTV-PyMT mice. These effects are associated to the inability of Snail1-deficient endothelial cells to undergo angiogenesis and to enhance CAF activation in a paracrine manner. Moreover, tumors generated in mice with endothelium-specific Snail1 depletion are less advanced and show a papillary phenotype. Similar changes on onset and tumor morphology are observed by pretreatment of MMTV-PyMT mice with the angiogenic inhibitor Bevacizumab. Human breast papillary carcinomas exhibit a lower angiogenesis and present lower staining of Snail1, both in endothelial and stromal cells, compared with other breast neoplasms. Furthermore, human breast tumors datasets show a strong correlation between Snail1 expression and high angiogenesis. Conclusion: These findings show a novel role for Snail1 in endothelial cell activation and demonstrate that these cells impact not only on angiogenesis, but also on tumor onset and phenotype.
© The author(s).
Conflict of interest statement
Competing Interests: The authors have declared that no competing interest exists.
Figures
Similar articles
-
TGFβ-Activated USP27X Deubiquitinase Regulates Cell Migration and Chemoresistance via Stabilization of Snail1.Cancer Res. 2019 Jan 1;79(1):33-46. doi: 10.1158/0008-5472.CAN-18-0753. Epub 2018 Oct 19. Cancer Res. 2019. PMID: 30341066 Free PMC article.
-
Snail1-Dependent Activation of Cancer-Associated Fibroblast Controls Epithelial Tumor Cell Invasion and Metastasis.Cancer Res. 2016 Nov 1;76(21):6205-6217. doi: 10.1158/0008-5472.CAN-16-0176. Epub 2016 Aug 8. Cancer Res. 2016. PMID: 27503928
-
Snail1 expression is required for sarcomagenesis.Neoplasia. 2014 May;16(5):413-21. doi: 10.1016/j.neo.2014.05.002. Epub 2014 Jun 16. Neoplasia. 2014. PMID: 24947186 Free PMC article.
-
Snail1 as a key prognostic biomarker of cancer-associated fibroblasts in breast tumors.Biochim Biophys Acta Rev Cancer. 2025 Jul;1880(3):189316. doi: 10.1016/j.bbcan.2025.189316. Epub 2025 Apr 11. Biochim Biophys Acta Rev Cancer. 2025. PMID: 40222423 Review.
-
The emerging role of Snail1 in the tumor stroma.Clin Transl Oncol. 2016 Sep;18(9):872-7. doi: 10.1007/s12094-015-1474-9. Epub 2015 Dec 21. Clin Transl Oncol. 2016. PMID: 26687368 Review.
Cited by
-
Integrin Beta 4E Promotes Endothelial Phenotypic Changes and Attenuates Lung Endothelial Cell Inflammatory Responses.Front Physiol. 2022 Feb 18;13:769325. doi: 10.3389/fphys.2022.769325. eCollection 2022. Front Physiol. 2022. PMID: 35250607 Free PMC article.
-
Maternal exposure to nano-titanium dioxide impedes fetal development via endothelial-to-mesenchymal transition in the placental labyrinth in mice.Part Fibre Toxicol. 2023 Dec 11;20(1):48. doi: 10.1186/s12989-023-00549-3. Part Fibre Toxicol. 2023. PMID: 38072983 Free PMC article.
-
A Cancer Associated Fibroblasts-Related Six-Gene Panel for Anti-PD-1 Therapy in Melanoma Driven by Weighted Correlation Network Analysis and Supervised Machine Learning.Front Med (Lausanne). 2022 Apr 11;9:880326. doi: 10.3389/fmed.2022.880326. eCollection 2022. Front Med (Lausanne). 2022. PMID: 35479936 Free PMC article.
-
Identification of COX4I2 as a hypoxia-associated gene acting through FGF1 to promote EMT and angiogenesis in CRC.Cell Mol Biol Lett. 2022 Sep 5;27(1):76. doi: 10.1186/s11658-022-00380-2. Cell Mol Biol Lett. 2022. PMID: 36064310 Free PMC article.
-
Schwann Cells in the Tumor Microenvironment: Need More Attention.J Oncol. 2022 Feb 10;2022:1058667. doi: 10.1155/2022/1058667. eCollection 2022. J Oncol. 2022. PMID: 35186076 Free PMC article. Review.
References
-
- Batlle E, Sancho E, Francí C, Domínguez D, Monfar M, Baulida J. et al. The transcription factor snail is a repressor of E-Cadherin gene expression in epithelial tumour cells. Nat Cell Biol. 2000;2:84–9. - PubMed
-
- Cano A, Pérez-Moreno MA, Rodrigo I, Locascio A, Blanco MJ, del Barrio MG. et al. The transcription factor snail controls epithelial-mesenchymal transitions by repressing E-Cadherin expression. Nat Cell Biol. 2000;2:76–83. - PubMed
-
- Stemmler MP, Eccles RL, Brabletz S, Brabletz T. Non-redundant functions of EMT transcription factors. Nat Cell Biol. 2019;21:102–12. - PubMed
Publication types
MeSH terms
Substances
LinkOut - more resources
Full Text Sources
Medical
Molecular Biology Databases
Research Materials
