

Chemotherapeutic effects on breast tumor hemodynamics revealed by eigenspectra multispectral optoacoustic tomography (eMSOT)
- PMID: 34335966
- PMCID: PMC8315054
- DOI: 10.7150/thno.56173
Chemotherapeutic effects on breast tumor hemodynamics revealed by eigenspectra multispectral optoacoustic tomography (eMSOT)
Abstract
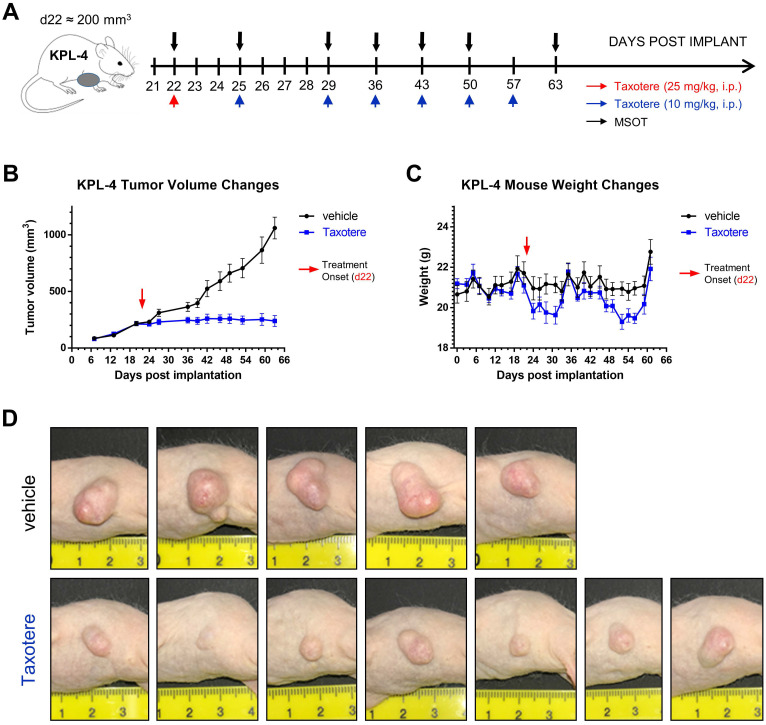
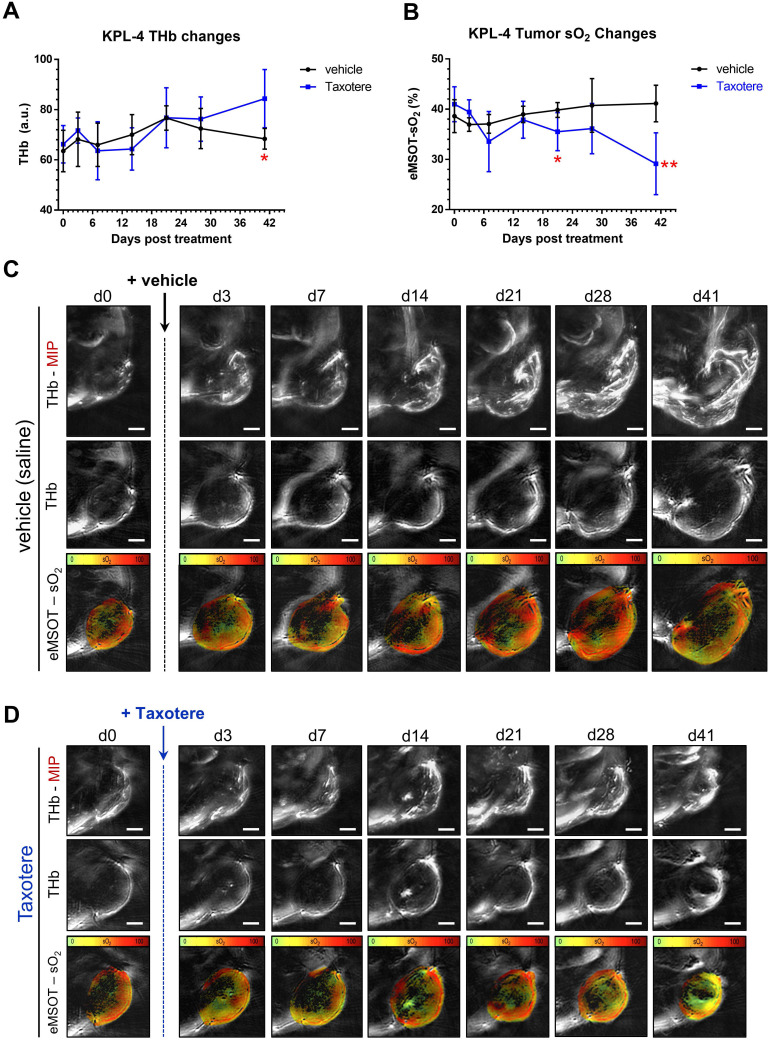
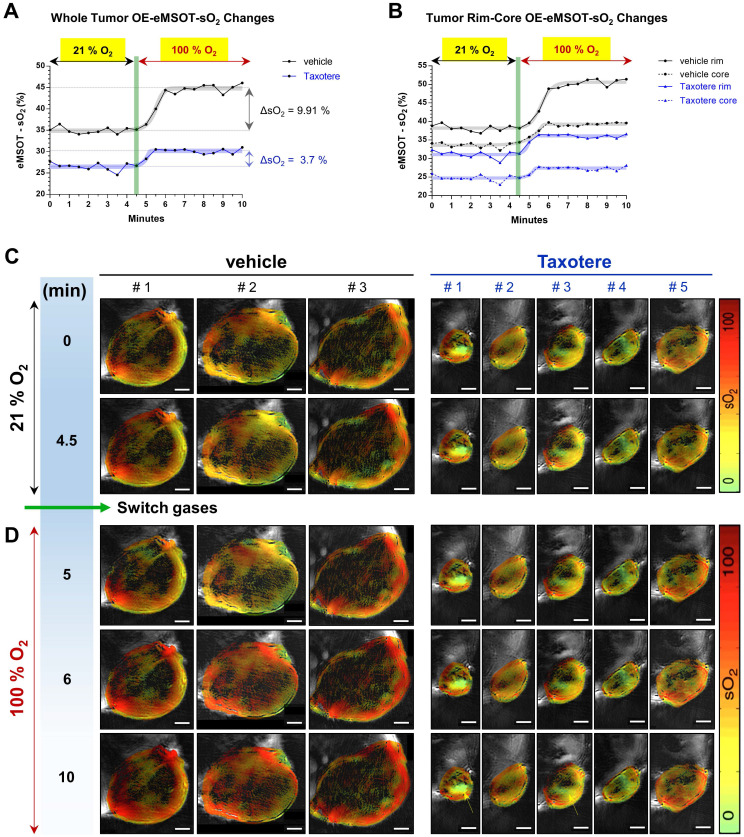
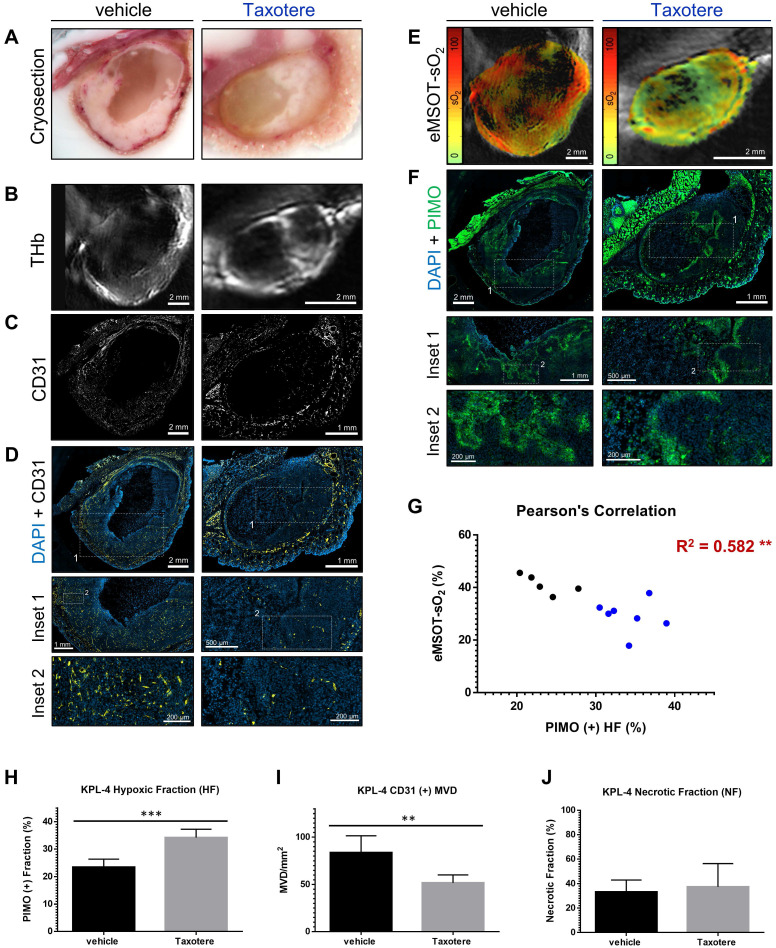
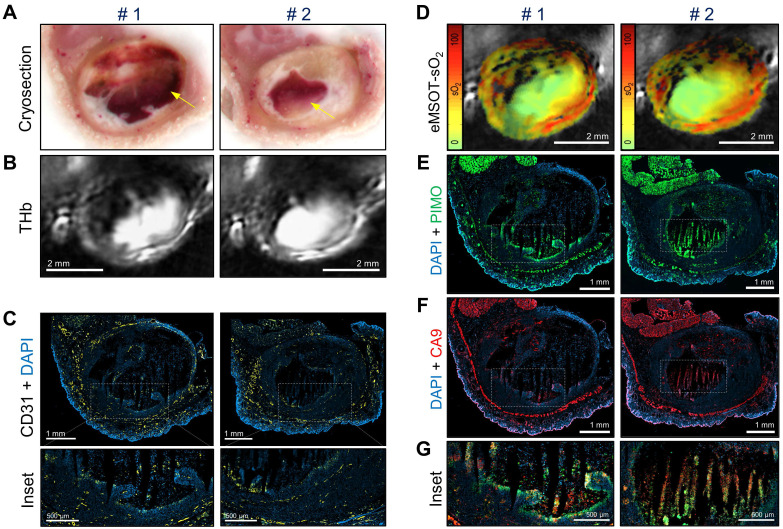
Non-invasive monitoring of hemodynamic tumor responses to chemotherapy could provide unique insights into the development of therapeutic resistance and inform therapeutic decision-making in the clinic. Methods: Here, we examined the longitudinal and dynamic effects of the common chemotherapeutic drug Taxotere on breast tumor (KPL-4) blood volume and oxygen saturation using eigenspectra multispectral optoacoustic tomography (eMSOT) imaging over a period of 41 days. Tumor vascular function was assessed by dynamic oxygen-enhanced eMSOT (OE-eMSOT). The obtained in vivo optoacoustic data were thoroughly validated by ex vivo cryoimaging and immunohistochemical staining against markers of vascularity and hypoxia. Results: We provide the first preclinical evidence that prolonged treatment with Taxotere causes a significant drop in mean whole tumor oxygenation. Furthermore, application of OE-eMSOT showed a diminished vascular response in Taxotere-treated tumors and revealed the presence of static blood pools, indicating increased vascular permeability. Conclusion: Our work has important translational implications and supports the feasibility of eMSOT imaging for non-invasive assessment of tumor microenvironmental responses to chemotherapy.
Keywords: Taxotere; breast cancer; chemotherapy; docetaxel; optoacoustic; photoacoustic.
© The author(s).
Conflict of interest statement
Competing Interests: V. N. holds ownership interest (including patents) in iThera Medical GmbH. All other authors declare no competing interests.
Figures
Similar articles
-
Resolution of Spatial and Temporal Heterogeneity in Bevacizumab-Treated Breast Tumors by Eigenspectra Multispectral Optoacoustic Tomography.Cancer Res. 2020 Dec 1;80(23):5291-5304. doi: 10.1158/0008-5472.CAN-20-1011. Epub 2020 Sep 29. Cancer Res. 2020. PMID: 32994204
-
Eigenspectra optoacoustic tomography achieves quantitative blood oxygenation imaging deep in tissues.Nat Commun. 2016 Jun 30;7:12121. doi: 10.1038/ncomms12121. Nat Commun. 2016. PMID: 27358000 Free PMC article.
-
A Bayesian Approach to Eigenspectra Optoacoustic Tomography.IEEE Trans Med Imaging. 2018 Sep;37(9):2070-2079. doi: 10.1109/TMI.2018.2815760. Epub 2018 Mar 14. IEEE Trans Med Imaging. 2018. PMID: 29993865
-
Current and Emerging Clinical Applications of Multispectral Optoacoustic Tomography (MSOT) in Oncology.Clin Cancer Res. 2016 Jul 15;22(14):3432-9. doi: 10.1158/1078-0432.CCR-16-0573. Epub 2016 May 20. Clin Cancer Res. 2016. PMID: 27208064 Free PMC article. Review.
-
Spectral unmixing techniques for optoacoustic imaging of tissue pathophysiology.Philos Trans A Math Phys Eng Sci. 2017 Nov 28;375(2107):20170262. doi: 10.1098/rsta.2017.0262. Philos Trans A Math Phys Eng Sci. 2017. PMID: 29038385 Free PMC article. Review.
Cited by
-
High-fidelity deep functional photoacoustic tomography enhanced by virtual point sources.Photoacoustics. 2023 Jan 5;29:100450. doi: 10.1016/j.pacs.2023.100450. eCollection 2023 Feb. Photoacoustics. 2023. PMID: 36685991 Free PMC article.
-
Overexpression of cannabinoid receptor 2 is associated with human breast cancer proliferation, apoptosis, chemosensitivity and prognosis via the PI3K/Akt/mTOR signaling pathway.Cancer Med. 2023 Jun;12(12):13538-13550. doi: 10.1002/cam4.6037. Epub 2023 May 23. Cancer Med. 2023. PMID: 37220224 Free PMC article.
-
3D Multiparametric Photoacoustic Computed Tomography of Primary and Metastatic Tumors in Living Mice.ACS Nano. 2024 Jul 16;18(28):18176-18190. doi: 10.1021/acsnano.3c12551. Epub 2024 Jun 28. ACS Nano. 2024. PMID: 38941553 Free PMC article.
-
Application of photoacoustic computed tomography in biomedical imaging: A literature review.Bioeng Transl Med. 2022 Sep 29;8(2):e10419. doi: 10.1002/btm2.10419. eCollection 2023 Mar. Bioeng Transl Med. 2022. PMID: 36925681 Free PMC article. Review.
-
Niche preclinical and clinical applications of photoacoustic imaging with endogenous contrast.Photoacoustics. 2023 Jul 17;32:100533. doi: 10.1016/j.pacs.2023.100533. eCollection 2023 Aug. Photoacoustics. 2023. PMID: 37636547 Free PMC article. Review.
References
-
- Pronk LC, Stoter G, Verweij J. Docetaxel (Taxotere): single agent activity, development of combination treatment and reducing side-effects. Cancer Treat Rev. 1995;21:463–78. - PubMed
-
- Imran M, Saleem S, Chaudhuri A, Ali J, Baboota S. Docetaxel: An update on its molecular mechanisms, therapeutic trajectory and nanotechnology in the treatment of breast, lung and prostate cancer. J Drug Deliv Sci Technol. 2020;60:1–18.
-
- Schiff PB, Fant J, Horwitz SB. Promotion of microtubule assembly in vitro by taxol. Nature. 1979;277:665–7. - PubMed
-
- Montero A, Fossella F, Hortobagyi G, Valero V. Docetaxel for treatment of solid tumours: a systematic review of clinical data. Lancet Oncol. 2005;6:229–39. - PubMed
-
- Lyseng-Williamson KA, Fenton C. Docetaxel: a review of its use in metastatic breast cancer. Drugs. 2005;65:2513–31. - PubMed
Publication types
MeSH terms
Substances
LinkOut - more resources
Full Text Sources
Medical
