. 2021 Jun 26;11(16):7829-7843.
doi: 10.7150/thno.46882. eCollection 2021.

MicroRNA-185-5p inhibits hepatic gluconeogenesis and reduces fasting blood glucose levels by suppressing G6Pase

Affiliations

MicroRNA-185-5p inhibits hepatic gluconeogenesis and reduces fasting blood glucose levels by suppressing G6Pase

Hui Zheng et al. Theranostics. .

Abstract

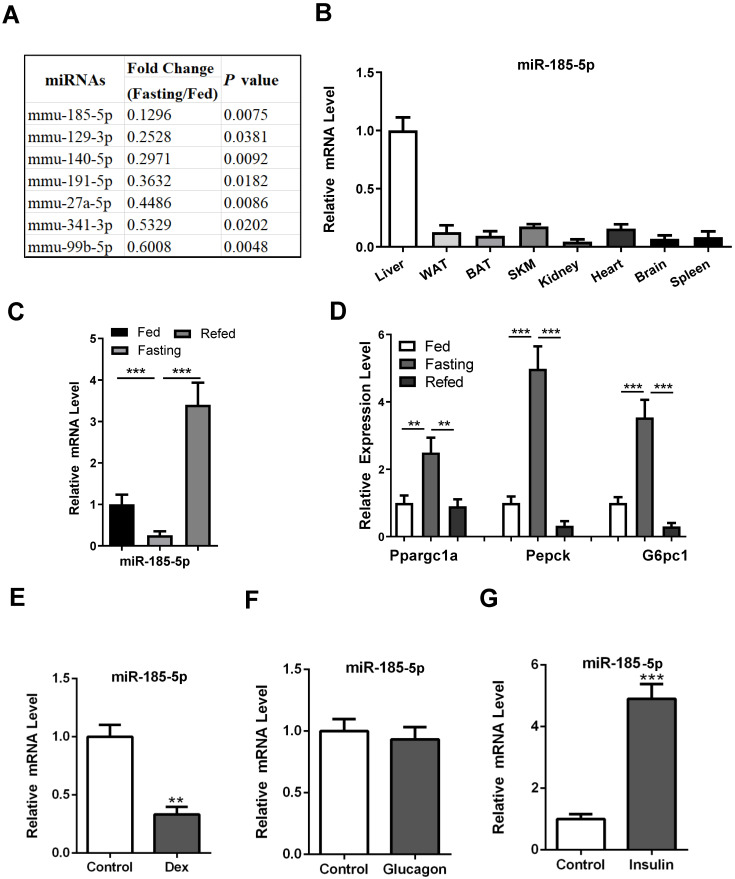
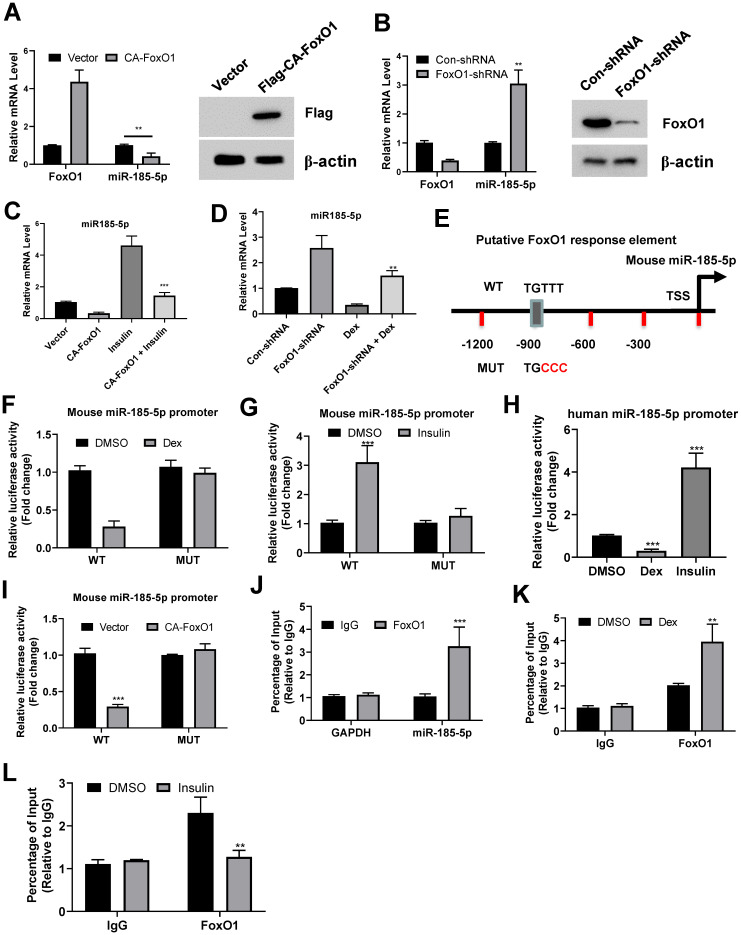
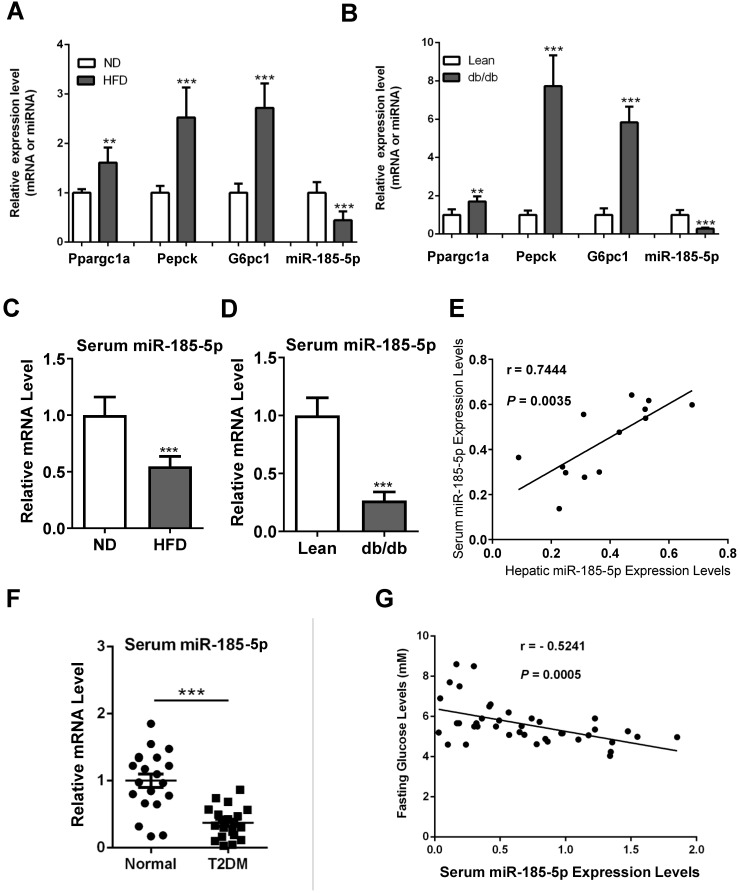
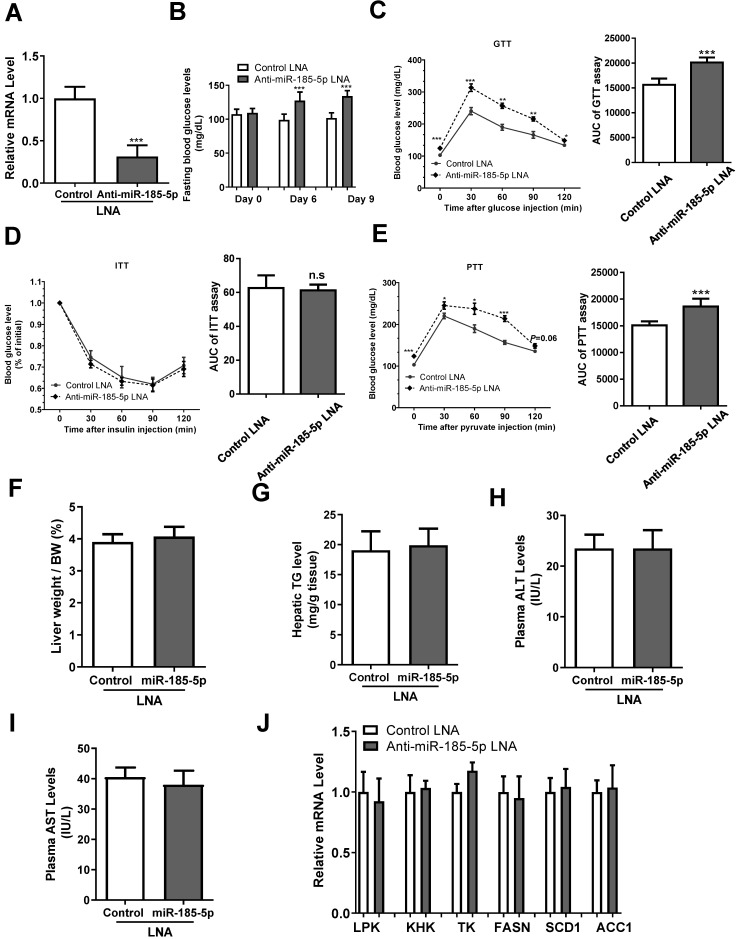
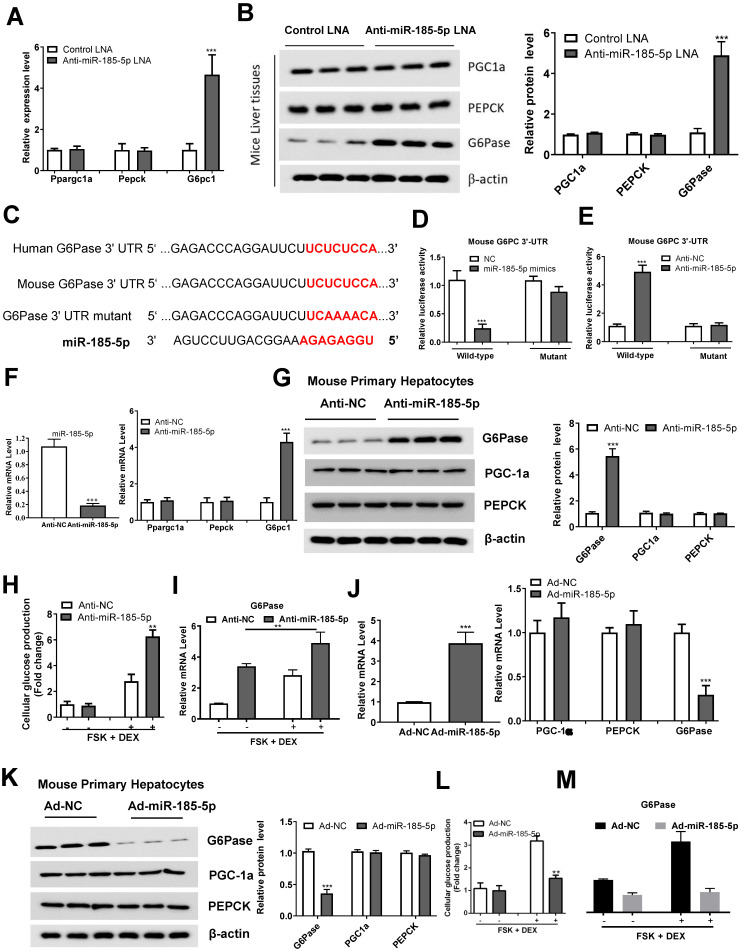
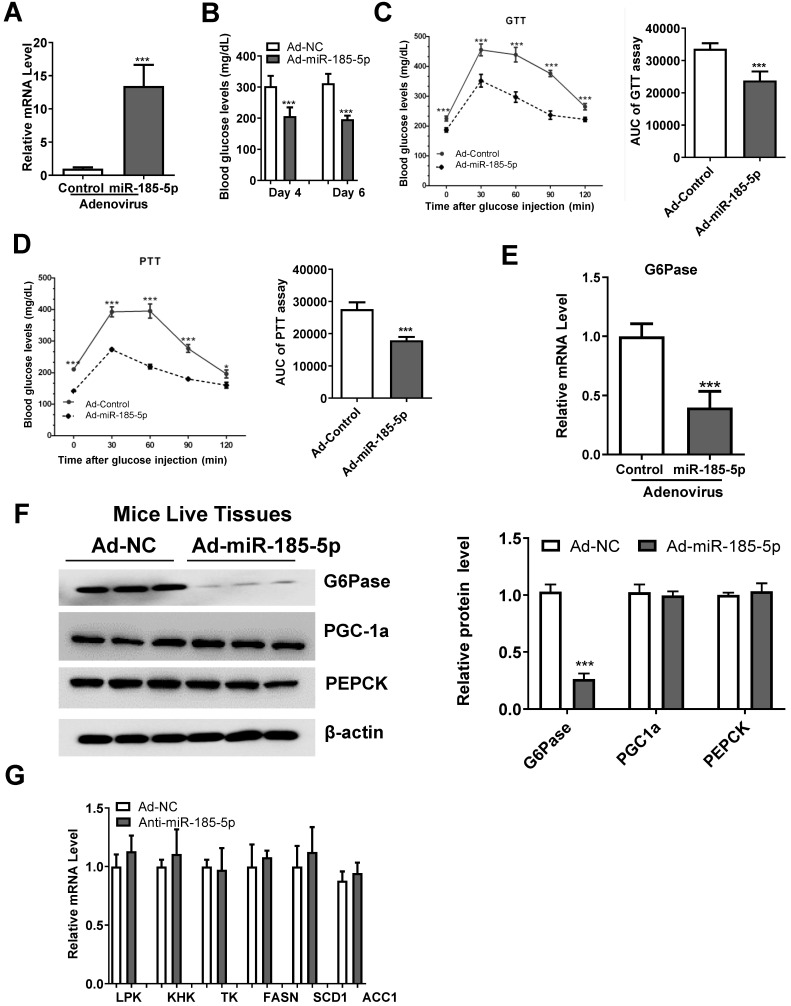
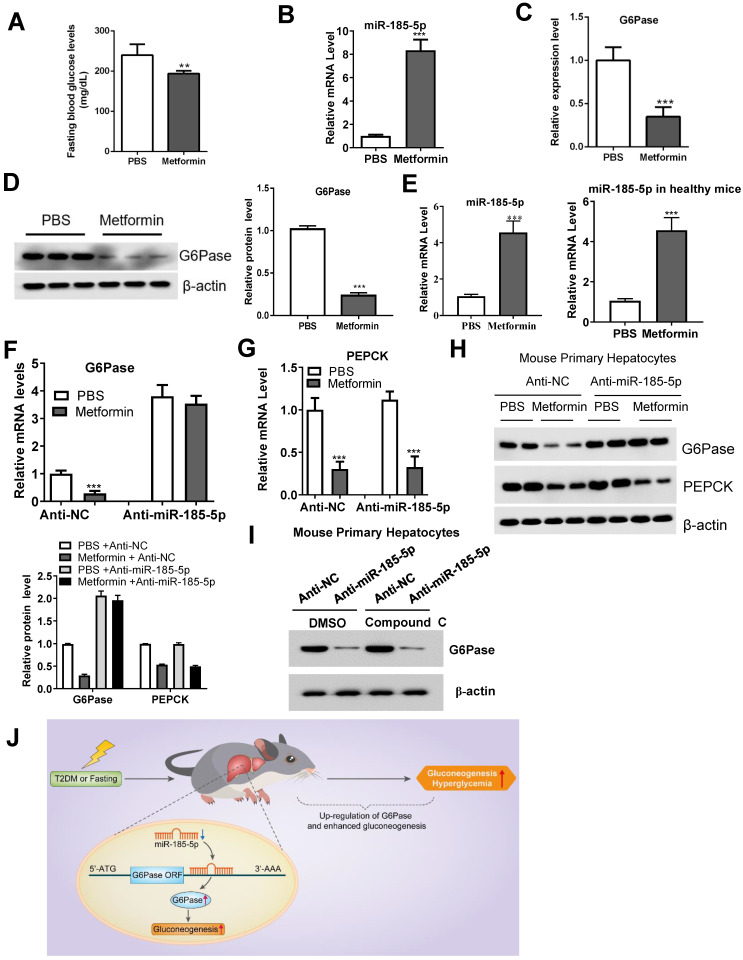
Aims/hypothesis: MicroRNAs (miRNAs) are known to contribute to many metabolic diseases, including type 2 diabetes. This study aimed to investigate the roles and molecular mechanisms of miR-185-5p in the regulation of hepatic gluconeogenesis. Methods: MicroRNA high-throughput sequencing was performed to identify differentially expressed miRNAs. High-fat diet-induced obese C57BL/6 mice and db/db mice, a genetic mouse model for diabetes, were used for examining the regulation of hepatic gluconeogenesis. Quantitative reverse transcriptase PCR and Western blotting were performed to measure the expression levels of various genes and proteins. Luciferase reporter assays were used to determine the regulatory roles of miR-185-5p on G6Pase expression. Results: Hepatic miR-185-5p expression was significantly decreased during fasting or insulin resistance. Locked nucleic acid (LNA)-mediated suppression of miR-185-5p increased blood glucose and hepatic gluconeogenesis in healthy mice. In contrast, overexpression of miR-185-5p in db/db mice alleviated blood hyperglycemia and decreased gluconeogenesis. At the molecular level, miR-185-5p directly inhibited G6Pase expression by targeting its 3'-untranslated regions. Furthermore, metformin, an anti-diabetic drug, could upregulate miR-185-5p expression to suppress G6Pase, leading to hepatic gluconeogenesis inhibition. Conclusions/interpretation: Our findings provided a novel insight into the role of miR-185-5p that suppressed hepatic gluconeogenesis and alleviated hyperglycemia by targeting G6Pase. We further identified that the /G6Pase axis mediated the inhibitory effect of metformin on hepatic gluconeogenesis. Thus, miR-185-5p might be a therapeutic target for hepatic glucose overproduction and fasting hyperglycemia.

Keywords: Type 2 diabetes; hepatic gluconeogenesis; hyperglycemia; metformin; miR-185-5p.


Conflict of interest statement

Competing Interests: The authors have declared that no competing interest exists.

Figures

Figure 1
Figure 1
Downregulation of hepatic miR-185-5p during fasting. A: Expression of down-regulated miRNAs in the livers of C57BL/6 mice under fed or fasted states. B: Relative miR-185-5p expression in various mice organs, including liver, white adipose tissue (WAT), brown adipose tissue (BAT), skeletal muscle, kidney, heart, brain and spleen. C-D: qRT-PCR analysis of hepatic miR-185-5p and gluconeogenic gene expression in mice underfed, fasted, or refed states (n = 6). E-G: Relative expression of miR-185-5p in MPHs treated with DEX (100nM, E), glucagon (10nM, F), or insulin (10nM, G) for 6 h. n=4 per group. **P < 0.01, ***P < 0.001.
Figure 2
Figure 2
Suppression of miR-185-5p by FoxO1. A: MPHs were infected with adenovirus expressing a constitutively active FoxO1 (Flag-CA-FoxO1) or vector control. The mRNA expression levels of FoxO1 and miR-185 were measured by real-time PCR assay. The protein expression of Flag-CA-FoxO1 was examined by western blot assay. B: MPHs were transfected with con-shRNA or shRNA against FoxO1. The mRNA expression levels of FoxO1 and miR-185 were measured by real-time PCR assay. C: MPHs infected with adenovirus expressing a constitutively active FoxO1 (Flag-CA-FoxO1) or vector control were treated with insulin (10nM, C) for 6 h. The mRNA expression levels of miR-185 were measured by real-time PCR assay. The protein expression of endogenous FoxO1 was examined by western blot assay. D: MPHs transfected with con-shRNA or shRNA against FoxO1were treated with dexamethasone (100nM, Dex) for 6 h. The mRNA expression levels of miR-185 were measured by real-time PCR assay. E: Schematic diagram shows mouse miR-185 promoter and putative FoxO1 binding sites. TSS: transcription. The mutations were highlighted in red. F: Relative luciferase activity of the firefly reporter containing the wt or mutant mouse miR-185 promoter was detected in MPHs with or without dexamethasone treatment. G: Relative luciferase activity of the firefly reporter containing the wt or mutant mouse miR-185 promoter was detected in MPHs with or without insulin treatment. H: Relative luciferase activity of the firefly reporter containing the wt human miR-185 promoter was detected in HepG2 cells with or without dexamethasone or insulin treatment. I: Relative luciferase activity of the firefly reporter containing the wt or mutant mouse miR-185 promoter was detected in MPHs infected with adenovirus expressing a constitutively active FoxO1 (Flag-CA-FoxO1) or vector control. J: ChIP shows enrichment of FoxO1 at the mouse miR-185 promoter in MPHs. K: Dexamethasone treatment increased the occupation of FoxO1 at the mouse miR-185 promoter in MPHs. L: Insulin treatment decreased the occupation of FoxO1 at the mouse miR-185 promoter in MPHs. **P < 0.01, ***P < 0.001.
Figure 3
Figure 3
Reduced expression of miR-185-5p in diabetes. A: qRT-PCR analysis of hepatic miR-185-5p or gluconeogenic gene expression in mice fed a high-fat diet or normal diet for 12 weeks. n=6 per group. B: qRT-PCR analysis of hepatic miR-185-5p or gluconeogenic gene expression in lean or db/db mice. n=6 per group. C: Relative miRNA expression of serum miR-185-5p from mice in A. D: Relative miRNA expression of serum miR-185-5p from mice in B. E: Pearson R- and P-value for normalized serum miR-185-5p mRNA levels versus hepatic miR-185-5p mRNA levels in mice. n=13 per group. F: Relative miRNA expression of serum miR-185-5p from normal subjects and diabetic patients. n=20 per group. G: Pearson R- and P-value for normalized serum miR-185-5p mRNA levels versus fasting blood glucose levels in human subjects. n=40. **P < 0.01, ***P < 0.001.
Figure 4
Figure 4
miR-185-5p regulates hepatic gluconeogenesis in vivo. Male C57BL/6J WT mice were injected with miR-185-5p LNA or the negative control via the tail vein. n=8 per group. A: Measurement of hepatic miR-185-5p expression. B: Examination of fasting blood glucose. C-E: Performance GTTs (C), ITTs (D), and PTTs (E), at day 10, 12, and 14, respectively. The AUC of glycemia was also calculated. F-I: Measurement of hepatic liver weight/body weight ratio (F), hepatic TG level (G), plasma ALT and AST levels (H-I). J: Measurement of mRNA levels of glycolytic and lipogenic enzymes. *P < 0.05, **P < 0.01, ***P < 0.001.
Figure 5
Figure 5
miR-185-5p directly regulates G6Pase expression. A-B: mRNA (A) and protein (B) expression of gluconeogenic genes (Ppargc1a, PEPCK, and G6Pase) in the livers of C57BL/6J mice administered with miR-185-5p LNA or negative control. The quantification plot was based on scanning densitometry analysis using the ImageJ software (v 1.8.0). C: Sequence alignment of miR-185-5p with the 3'-UTR of the mouse and human G6Pase. D-E: HEK293T cells were co-transfected with wildtype or mutant 3ʹ-UTR reporter plasmids of G6Pase with miR-185-5p mimics (D), miR-185-5p antisense (E). F-G: MPHs were transfected with miR-185-5p antisense or negative control for 48 h and then treated with FSK (10 μM) and DEX (100 nm) for an additional 6 h. Then, mRNA levels of miR-185-5p and gluconeogenic genes (Ppargc1a, PEPCK, and G6Pase) were examined (F) and G6Pase protein level was determined (G); the quantification plot was based on scanning densitometry analysis using the ImageJ software (v 1.8.0). H-I: MPHs were transfected with miR-185-5p antisense or negative control for 48 h and then treated with FSK (10 μM) and DEX (100 nm) for an additional 6 h. Then, cellular glucose production (H) and G6Pase mRNA levels (I) were determined. J-K: MPHs were infected with Ad-miR-185-5p or negative control for 48 h and then treated with FSK (10 μM) and DEX (100 nm) for additional 6 hours. Then, mRNA (J) and protein (K) levels of gluconeogenesis (PGC-1α, PEPCK, and G6Pase) were examined. L-M: MPHs were infected with Ad-miR-185-5p or negative control for 48 h and then treated with FSK (10 μM) and DEX (100 nm) for an additional 6 h. Then, cellular glucose production and G6Pase mRNA levels (L) and G6Pase mRNA levels (M) were determined. **P < 0.01. ***P < 0.001.
Figure 6
Figure 6
Hepatic overexpression of miR-185-5p improves hyperglycemia in db/db mice. Male db/db mice were infected with adenovirus-overexpressing miR-185-5p (Ad-miR-185-5p) or negative control (Ad-NC) via tail-vein injection. n=8 per group. A: Expression of hepatic miR-185-5p expression by qRT-PCR at day 15 post-injection. B: Fasting blood glucose levels at days 4 and 6. C-D: GTT and PTT at days 8 and 11. The AUC of glycemia was also calculate. E-F: mRNA and protein levels of G6Pase in the livers of mice. The quantification plot was based on scanning densitometry analysis using the ImageJ software (v 1.8.0). G: mRNA levels of glycolytic and lipogenic enzymes were determined by qRT-PCR. *P < 0.05, ***P < 0.001.
Figure 7
Figure 7
Metformin inhibits G6Pase expression by targeting miR-185-5p. db/db mice were daily treated with metformin (200 mg/kg) or vehicle control by i.p. injection for 14 days. A-D: Fasting blood glucose levels (A), hepatic miR-185-5p expression (B), mRNA and protein levels of G6Pase in the livers (C-D), were analyzed in two groups of mice. n=5 per group. E: Relative expression of miR-185-5p in MPHs (left panel) or health mice (right panel) treated with metformin or vehicle control for 24 h. F-H: MPHs were treated with miR-185-5p antisense or negative control for 24 h, and then treated with metformin or vehicle control for another 24 h. Then, mRNA (F-G) and protein (H) levels of PEPCK and G6Pase were analyzed. The quantification plot was based on scanning densitometry analysis using the ImageJ software (v 1.8.0). ** P < 0.01, *** P < 0.001. I: MPHs were transfected with miR-185 antisense or negative control for 36 h and then treated with DMSO or Compound C for additional 12 h. Then, the protein level of G6Pase was determined. J: Schematic model: We propose that miR-185-5p could suppress hepatic gluconeogenesis and alleviate hyperglycemia by targeting the miR-185-5p/G6Pase axis.

Similar articles

Cited by

References

    1. Sharabi K, Tavares CD, Rines AK, Puigserver P. Molecular pathophysiology of hepatic glucose production. Mol Aspects Med. 2015;46:21–33. - PMC - PubMed
    1. Petersen MC, Vatner DF, Shulman GI. Regulation of hepatic glucose metabolism in health and disease. Nat Rev Endocrinol. 2017;13:572–87. - PMC - PubMed
    1. Rines AK, Sharabi K, Tavares CD, Puigserver P. Targeting hepatic glucose metabolism in the treatment of type 2 diabetes. Nat Rev Drug Discov. 2016;15:786–804. - PMC - PubMed
    1. Roden M, Shulman GI. The integrative biology of type 2 diabetes. Nature. 2019;576:51–60. - PubMed
    1. Puigserver P, Rhee J, Donovan J, Walkey CJ, Yoon JC, Oriente F. et al. Insulin-regulated hepatic gluconeogenesis through FOXO1-PGC-1alpha interaction. Nature. 2003;423:550–5. - PubMed

Publication types

MeSH terms