. 2021 Jun 26;11(16):7844-7868.
doi: 10.7150/thno.58655. eCollection 2021.

GLS-driven glutamine catabolism contributes to prostate cancer radiosensitivity by regulating the redox state, stemness and ATG5-mediated autophagy

Affiliations

GLS-driven glutamine catabolism contributes to prostate cancer radiosensitivity by regulating the redox state, stemness and ATG5-mediated autophagy

Anna Mukha et al. Theranostics. .

Abstract

Radiotherapy is one of the curative treatment options for localized prostate cancer (PCa). The curative potential of radiotherapy is mediated by irradiation-induced oxidative stress and DNA damage in tumor cells. However, PCa radiocurability can be impeded by tumor resistance mechanisms and normal tissue toxicity. Metabolic reprogramming is one of the major hallmarks of tumor progression and therapy resistance. Specific metabolic features of PCa might serve as therapeutic targets for tumor radiosensitization and as biomarkers for identifying the patients most likely to respond to radiotherapy. The study aimed to characterize a potential role of glutaminase (GLS)-driven glutamine catabolism as a prognostic biomarker and a therapeutic target for PCa radiosensitization. Methods: We analyzed primary cell cultures and radioresistant (RR) derivatives of the conventional PCa cell lines by gene expression and metabolic assays to identify the molecular traits associated with radiation resistance. Relative radiosensitivity of the cell lines and primary cell cultures were analyzed by 2-D and 3-D clonogenic analyses. Targeting of glutamine (Gln) metabolism was achieved by Gln starvation, gene knockdown, and chemical inhibition. Activation of the DNA damage response (DDR) and autophagy was assessed by gene expression, western blotting, and fluorescence microscopy. Reactive oxygen species (ROS) and the ratio of reduced glutathione (GSH) to oxidized glutathione (GSSG) were analyzed by fluorescence and luminescence probes, respectively. Cancer stem cell (CSC) properties were investigated by sphere-forming assay, CSC marker analysis, and in vivo limiting dilution assays. Single circulating tumor cells (CTCs) isolated from the blood of PCa patients were analyzed by array comparative genome hybridization. Expression levels of the GLS1 and MYC gene in tumor tissues and amino acid concentrations in blood plasma were correlated to a progression-free survival in PCa patients. Results: Here, we found that radioresistant PCa cells and prostate CSCs have a high glutamine demand. GLS-driven catabolism of glutamine serves not only for energy production but also for the maintenance of the redox state. Consequently, glutamine depletion or inhibition of critical regulators of glutamine utilization, such as GLS and the transcription factor MYC results in PCa radiosensitization. On the contrary, we found that a combination of glutamine metabolism inhibitors with irradiation does not cause toxic effects on nonmalignant prostate cells. Glutamine catabolism contributes to the maintenance of CSCs through regulation of the alpha-ketoglutarate (α-KG)-dependent chromatin-modifying dioxygenase. The lack of glutamine results in the inhibition of CSCs with a high aldehyde dehydrogenase (ALDH) activity, decreases the frequency of the CSC populations in vivo and reduces tumor formation in xenograft mouse models. Moreover, this study shows that activation of the ATG5-mediated autophagy in response to a lack of glutamine is a tumor survival strategy to withstand radiation-mediated cell damage. In combination with autophagy inhibition, the blockade of glutamine metabolism might be a promising strategy for PCa radiosensitization. High blood levels of glutamine in PCa patients significantly correlate with a shorter prostate-specific antigen (PSA) doubling time. Furthermore, high expression of critical regulators of glutamine metabolism, GLS1 and MYC, is significantly associated with a decreased progression-free survival in PCa patients treated with radiotherapy. Conclusions: Our findings demonstrate that GLS-driven glutaminolysis is a prognostic biomarker and therapeutic target for PCa radiosensitization.

Keywords: Autophagy; Cancer stem cells; GLS1; Prostate cancer; Radioresistance.


Conflict of interest statement

Competing Interests: In the past 5 years, Dr. Mechthild Krause received funding for her research projects by IBA (2016), Merck KGaA (2014-2018 for preclinical study; 2018-2020 for clinical study), Medipan GmbH (2014-2018). In the past 5 years, Dr. Krause, Dr. Linge and Dr. Löck have been involved in an ongoing publicly funded (German Federal Ministry of Education and Research) project with the companies Medipan, Attomol GmbH, GA Generic Assays GmbH, Gesellschaft für medizinische und wissenschaftliche genetische Analysen, Lipotype GmbH and PolyAn GmbH (2019-2021). For the present manuscript, none of the above mentioned funding sources were involved. In the past 5 years, Dr. Michael Baumann received funding for his research projects and for educational grants to the University of Dresden by Bayer AG (2016-2018), Merck KGaA (2014-open) and Medipan GmbH (2014-2018). He is on the supervisory board of HI-STEM gGmbH (Heidelberg) for the German Cancer Research Center (DKFZ, Heidelberg) and also member of the supervisory body of the Charité University Hospital, Berlin. As former chair of OncoRay (Dresden) and present CEO and Scientific Chair of the German Cancer Research Center (DKFZ, Heidelberg), he has been or is responsible for collaborations with a multitude of companies and institutions, worldwide. In this capacity, he has discussed potential projects and signed contracts for research funding and/or collaborations with industry and academia for his institute(s) and staff, including but not limited to pharmaceutical companies such as Bayer, Boehringer Ingelheim, Bosch, Roche and other companies such as Siemens, IBA, Varian, Elekta, Bruker, etc. In this role, he was/is also responsible for the commercial technology transfer activities of his institute(s), including the creation of start-ups and licensing. This includes the DKFZ-PSMA617 related patent portfolio [WO2015055318 (A1), ANTIGEN (PSMA)] and similar IP portfolios. Dr. Baumann confirms that, to the best of his knowledge, none of the above funding sources were involved in the preparation of this paper. Other co-authors declare that they have no conflict of interest.

Figures
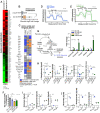
Figure 1
Figure 1
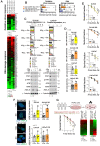
Deregulation of Gln metabolism in radioresistant PCa cells. (A) Gene expression analysis showed that radioresistant properties of LNCaP RR and DU145 RR cells are associated with similar deregulation pattern of genes involved in the control of amino acid metabolism. (B) Absolute log2 fold change of genes included in amino acid metabolism signature. (C) Targeted metabolomics of amino acids and biogenic amines in parental and RR cells revealed that Glu is significantly upregulated in both PC3 RR and DU145 RR cells, but not in LNCaP RR cells as compared to the corresponding parental cells. (D-E) Agilent Seahorse XF analysis of Gln-starved parental and RR DU145 and LNCaP cells, accordingly. Real-time oxygen consumption rate (OCR) was measured after the addition of Gln to the final concentration of 2 mM. Data are mean ± s.e.m. (F) Increase in OCR over the baseline after Gln supplementation. Data are mean ± s.d. (G) LC-MS/MS based analysis of the contribution of 13C5-Gln to TCA cycle intermediates based on isotopic steady state labeling. 13C5-Gln was supplemented to the culture medium at concentration of 2 mM, and cells were harvested 4 h later. (H) The intracellular levels of TCA cycle metabolites measured in parental and RR cells by LC-MS/MS. Data are mean ± s.e.m. (I) Quantification of intracellular metabolites in control cells and cells deprived for Gln for 24 h. Data are mean ± s.e.m. (J) Intracellular levels of Gln, α-KG, and succinate in control and irradiated cells. Cells were sham-irradiated or irradiated with 4 Gy of X-ray and analyzed 72 h after irradiation. Data are mean ± s.e.m. *p < 0.05; **p < 0.01; ***p < 0.001.
Figure 2
Figure 2
Gln deprivation increased oxidative stress and PCa cell sensitivity to X-ray radiation in Gln-dependent PCa cells. (A) Gene expression analysis showed that Gln deprivation results in consistent deregulation patterns of genes that control oxidative stress response and DNA damage response (DDR), although this deregulation is more pronounced for radiosensitive (RS) parental cells in each pair as compared to radioresistant (RR) cells, as well as for DU145 in comparison to LNCaP cells. (B) Absolute log2 fold change of genes involved in oxidative stress response and DNA damage response signatures. (C) Western blot analysis of key DDR regulators in response to Gln depletion for 72 h and quantification of the Western blot data. Cells grown in presence of glutamine were used as control. Data are mean ± s.d. (D) Gln starvation increased the intracellular level of ROS in DU145 and DU145 RR cells. Data are mean ± s.d. (E) Radiobiological colony-forming assay of PCa cells grown with or without Gln supplementation. Data are mean ± s.d. (F) Analysis of residual γH2A.X foci number after 24 h of glutamine deprivation followed by 4 Gy of X-ray irradiation. Cells were analyzed 24 h after irradiation. Control cells were cultured in presence of glutamine. Data are mean ± s.d. Scale bars = 10 µm. (G) Comparative analysis of gene expression data from patient-derived primary cultures (PDPC) and Gln-deprived PCa cell lines. PDPC cultures were analyzed for their relative radioresistance using a 3-D radiobiological clonogenic assay. Data are mean ± s.d. Lists of genes significantly deregulated (p<0.05) in DU145 and LNCaP in response to glutamine starvation were compared with the list of genes differentially expressed (p < 0.05) between radioresistant (RR) and radiosensitive (RS) PDPC samples. For the genes present in both lists, Gln-/Gln+ and RR/RS fold changes were calculated. Finally, the Pearson correlation for those fold change values was determined. *p < 0.05; **p < 0.01; ***p < 0.001.
Figure 3
Figure 3
Genetic and chemical inhibition of Gln metabolism results in PCa cell radiosensitization. (A) Analysis of the relative PCa radiosensitivity in response to siRNA-mediated knockdown of MYC or GLS in cells grown with or without Gln supplementation for 24 h. Data are mean ± s.d. (B) Western blot analysis of PCa cells after siRNA-mediated knockdown of MYC or GLS gene expression, with or without Gln starvation. (C) Radiobiological colony-forming assay of PCa cells with or without inhibition of GLS. Cells were pretreated with GLS inhibitor CB-839 at LD50 concentrations for 48 h directly prior clonogenic analysis. Cells were irradiated with indicated X-ray doses directly upon plating. Data are mean ± s.d. (D) Cells were incubated overnight with LD50 concentrations of GLS inhibitor CB-839. The levels of Glu production were measured to confirm GLS enzymatic activity inhibition. Cells treated with DMSO were used as control. Data are mean ± s.d. (E) Radiobiological colony-forming assays of primary PCa and benign prostate hyperplasia (BPH) cultures were performed with or without inhibition of GLS. Cells were pretreated with GLS inhibitor CB-839 at indicated concentrations for 24 h directly prior 3-D clonogenic analysis. Cells treated with DMSO were used as control. For BPH and tumor cell cultures treated with the inhibitor, the survival fraction values at the different radiation doses were normalized to the values corresponding to the DMSO-treated cells at the same radiation doses. These values for tumor cell cultures and BPH called radiation enhancement or radiation diminishment ratio depending on the effect caused by chemical inhibitors, were statistically compared using Mann-Whitney test. Data are mean ± s.e.m. *p < 0.05; **p < 0.01, ***p < 0.001, ****p < 0.0001.
Figure 4
Figure 4
Regulation of PCa cell death upon glutamine deprivation. (A) Analysis of cell viability using Trypan blue exclusion assay. Data are mean ± s.d. (B) Western blot analysis of PARP cleavage after glutamine starvation of PCa cells for 24 h. Cells grown in the presence of glutamine were used as control. Data are mean ± s.e.m. (C) Cell death has been evaluated by flow cytometry using Annexin V-FITC and PI staining. Data are mean ± s.d. *p < 0.05; **p < 0.01.
Figure 5
Figure 5
Regulation of autophagy in response to glutamine deprivation. (A) Western blot detection of LC3B-II protein in PCa cells grown with or without glutamine starvation for 24 h. Cells treated with autophagy inhibitor Chloroquine (CQ) at a concentration of 20 μM for 24 h were used as control. Data are mean ± s.d. (B) Monitoring LC3-positive puncta (autophagosomes) in LNCaP cells starved for Gln for 24 h, treated with CQ at a concentration of 20 μM for 24 h, or both. Data are mean ± s.d. (C) PCR analysis of ATG5 expression in LNCaP and DU145, parental (P) and radioresistant (RR) cells. (D) Analysis of the radiosensitizing effect of autophagy inhibition in Gln starved cells. Cells were cultured in medium with or without Gln for 24 h before irradiation. For autophagy inhibitions, cells were treated with CQ at a concentration of 10 μM for 1 h before and 1 h after irradiation with 4 Gy of X-rays. Sham irradiated cells were used as control. Cells were used for radiobiological colony-forming assay. Plating efficiency values for each cell line were normalized to the values corresponding to 4Gy, - CQ, +Gln treatment condition. Data are mean ± s.d. (E) Radiobiological clonogenic analysis of PCa cells after ATG5 knockdown in combination with Gln starvation. Cells were transfected with two ATG5 siRNA or scrambled siRNA for 24 h and then supplemented with fresh media without glutamine. 24 h later, cells were used for radiobiological colony-forming assay. Data are mean ± s.d. (F) Representative Western blot analysis of DU145 and LNCaP cells transfected with ATG5 siRNA or scrambled siRNA. *p < 0.05.
Figure 6
Figure 6
Glutamine metabolism regulates tumor cell reprogramming and in vitro CSC properties. (A) Western blot analysis of H3K27me3 levels and quantification of the Western blot data. H3K27me3 levels were normalized to the levels of total H3. Data are mean ± s.e.m. (B) The intracellular levels of Glu, α-KG and succinate measured in ALDH+ and ALDH- cells by LC-MS/MS. Data are mean ± s.d. (C) Glutamine starvation significantly decreased the number and size of formed tumor spheres after 4 Gy of X-ray irradiation in DU145 cells. Inverse cumulative distribution function (CDF) was defined as a number of spheres larger than a given size. Representative images of spheres are shown for DU145 and LNCaP cells, which were depleted or replenished with Gln for 72 h in combination with 4 Gy of X-ray or sham irradiation. Data are mean ± s.d. (D) Flow cytometry analysis of ALDH positive cell population in response to Gln starvation for 72 h. Cells replenished with Gln were used as control. Data are mean ± s.d. *p < 0.05; **p < 0.01.
Figure 7
Figure 7
Glutamine metabolism regulates tumor growth and in vivo CSC frequency. Analysis tumor take and tumor growth for DU145 (A) and LNCaP (B) in NMRI (nu/nu) xenograft models. PCa cells were pre-incubated in the presence or absence of Gln for 72 h, irradiated with 6 Gy of X-rays or sham irradiated, and injected into the mice in Matrigel as 5×10³ viable cells/implant. (C) Analysis of tumor-initiating cell frequency. PCa cells were pre-incubated in the presence or absence of Gln for 72 h and injected into the NMRI (nu/nu) in Matrigel as 102, 103 and 104 viable cells/implant. Limiting dilution assay calculations were performed using the ELDA software and presented as plots of the log fraction of mice bearing no tumors at day 137 (DU145) or day 202 (LNCaP) (log fraction nonresponding) as a function of the number of cells injected in mice (dose). The slope of the lines indicate log-active cell fraction, dotted lines indicate 95% confidence interval (c.i.). Frequency of tumor-initiating cells (%) is shown on the bottom panel. Data are mean ± c.i. *p < 0.05; **p < 0.01.
Figure 8
Figure 8
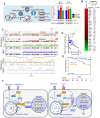
Gln metabolism as a prognostic biomarker in PCa. (A) Quantitative real-time PCR (RT-qPCR) and Western blot analysis of MYC and GLS expression in PC3-PT, PC3-L, and PC-BM sublines derived from primary PC3 xenograft tumors, lung metastases, and bone marrow metastases, correspondingly as described previously , . (B) Comparative analysis of the previously published gene expression profiling in the prostate tissues of wild-type and Myc transgenic mice showed significant enrichment of the CSC signature in Myc transgenic prostate tissue. Significance was calculated using Wilcoxon Signed Rank test. (C) Microarray-based comparative genomic hybridization (aCGH) analysis of single CTCs isolated from the blood of two patients with metastatic PCa by CellCelector system. (D) Blood plasma level of Gln measured by LC-MS/MS negatively correlated with prostate-specific antigen doubling time (PSA-DT) in PCa patients prior to radiotherapy. (E) MYC expression was correlated with PSA relapse-free survival in patients with PCa treated with radiotherapy at the Department of Radiotherapy and Radiation Oncology, University Hospital Carl Gustav Carus and Faculty of Medicine (n = 74). (F) The role of Gln metabolism in regulation of PCa radiosensitivity. Gln serves not only for energy production in the TCA cycle but also for maintaining the redox state by contribution to GSH production, DNA repair by regulation of ALKBH dioxygenases, and tumor epigenetic resetting by control of JmjC-domain-containing histone demethylases. The lack of glutamine leads to the oxidative stress, depletion of CSCs, and tumor radiosensitization. The blockade of Gln metabolism results in the activation of the pro-survival autophagy pathway, and autophagy inhibition can be a promising way for PCa radiosensitization if combined with Gln metabolism targeted drugs. GSH - glutathione; ROS - reactive oxygen species; α-KG - alpha ketoglutarate; TCA - tricarboxylic acid cycle; CQ - chloroquine; GLS - glutaminase; JMJC - Jumonji C (JmjC)-domain-containing histone demethylases; ALKBH - AlkB Homolog 1.

Similar articles

Cited by

References

    1. Chang AJ, Autio KA, Roach M 3rd, Scher HI. High-risk prostate cancer-classification and therapy. Nat Rev Clin Oncol. 2014;11:308–23. - PMC - PubMed
    1. Krause M, Dubrovska A, Linge A, Baumann M. Cancer stem cells: Radioresistance, prediction of radiotherapy outcome and specific targets for combined treatments. Adv Drug Deliv Rev. 2017;109:63–73. - PubMed
    1. Schulz A, Meyer F, Dubrovska A, Borgmann K. Cancer Stem Cells and Radioresistance: DNA Repair and Beyond. Cancers (Basel) 2019. 11. - PMC - PubMed
    1. Peitzsch C, Gorodetska I, Klusa D, Shi Q, Alves TC, Pantel K, Metabolic regulation of prostate cancer heterogeneity and plasticity. Semin Cancer Biol. 2020. - PubMed
    1. Hensley CT, Wasti AT, DeBerardinis RJ. Glutamine and cancer: cell biology, physiology, and clinical opportunities. The Journal of clinical investigation. 2013;123:3678–84. - PMC - PubMed

Publication types

MeSH terms