. 2021 Jul 6;11(16):7970-7983.
doi: 10.7150/thno.62138. eCollection 2021.

Environmentally-induced mdig contributes to the severity of COVID-19 through fostering expression of SARS-CoV-2 receptor NRPs and glycan metabolism

Affiliations

Environmentally-induced mdig contributes to the severity of COVID-19 through fostering expression of SARS-CoV-2 receptor NRPs and glycan metabolism

Qian Zhang et al. Theranostics. .

Abstract

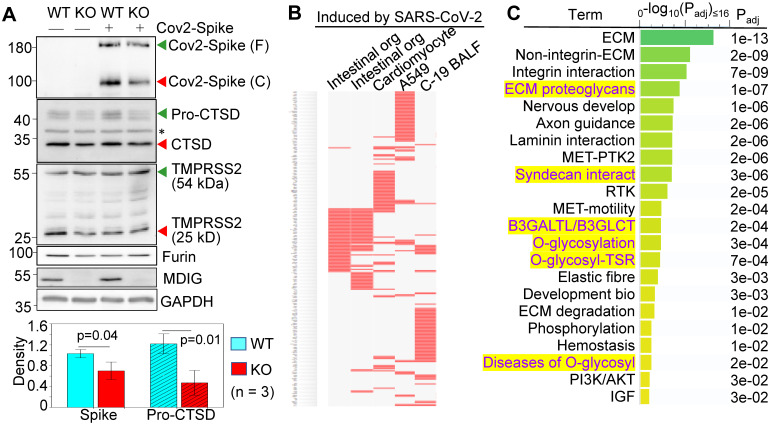
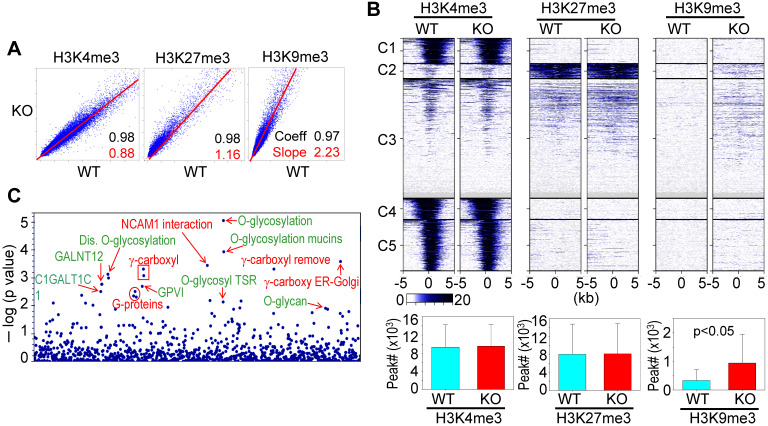
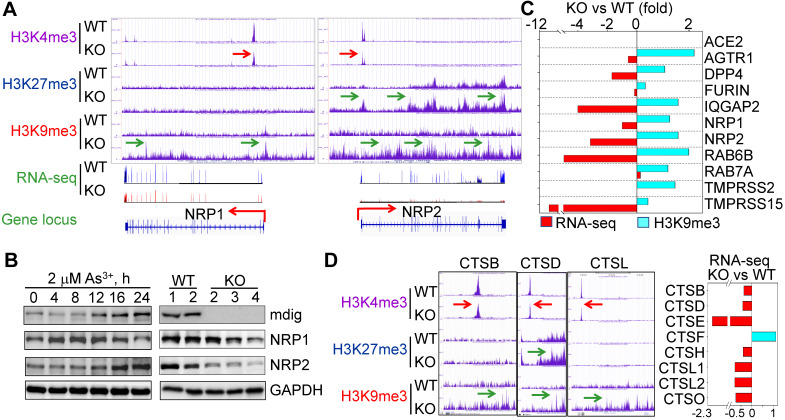
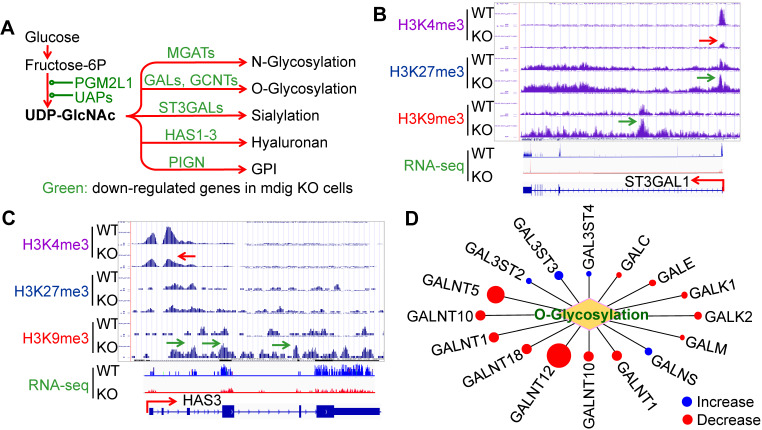
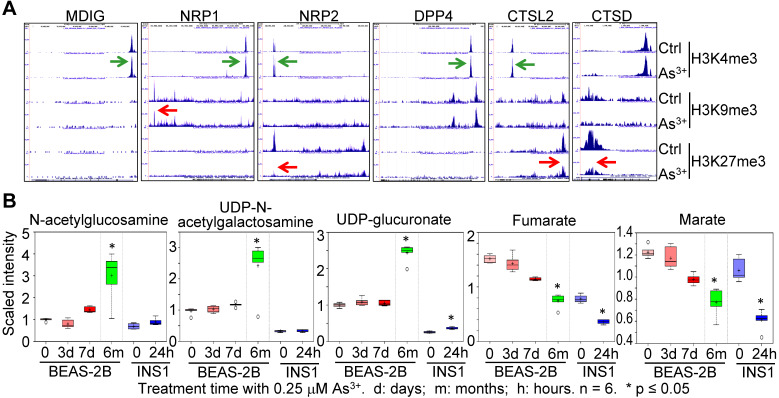
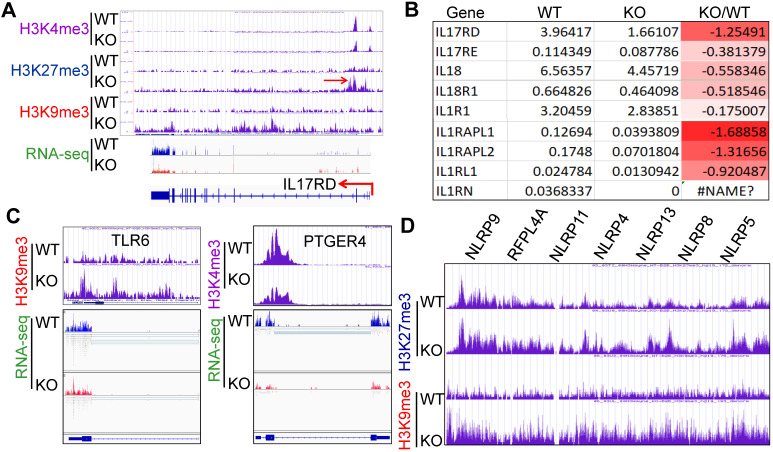
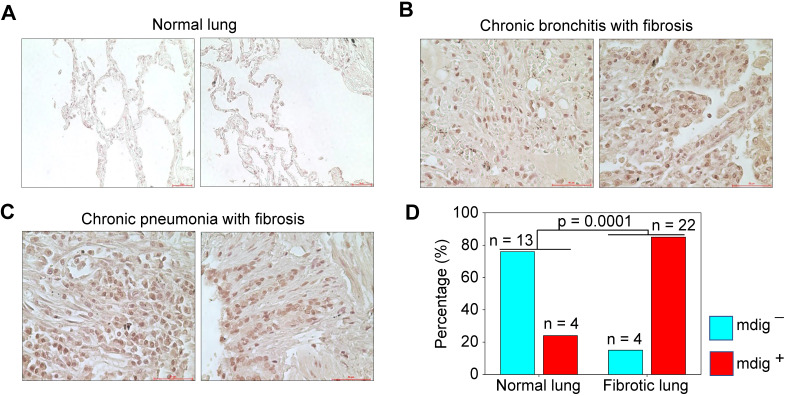
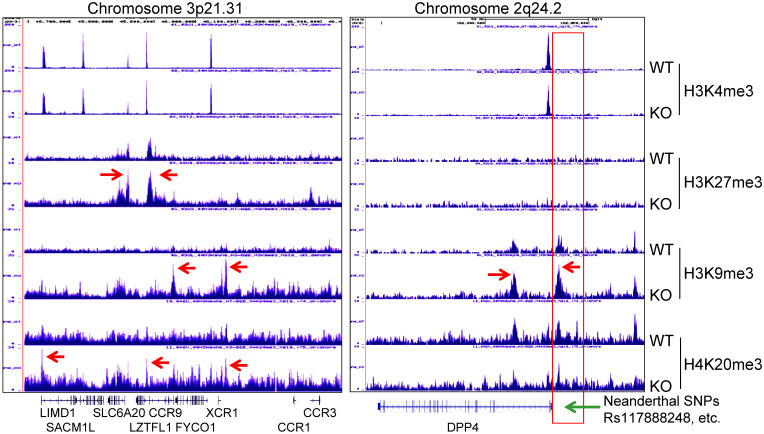
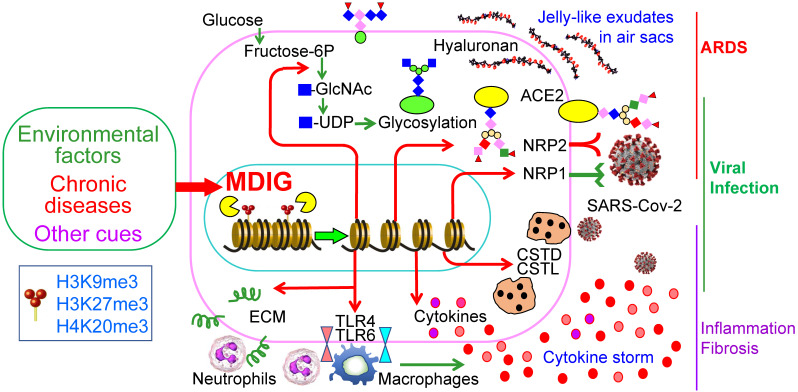
The novel β-coronavirus, SARS-CoV-2, the causative agent of coronavirus disease 2019 (COVID-19), has infected more than 177 million people and resulted in 3.84 million death worldwide. Recent epidemiological studies suggested that some environmental factors, such as air pollution, might be the important contributors to the mortality of COVID-19. However, how environmental exposure enhances the severity of COVID-19 remains to be fully understood. In the present report, we provided evidence showing that mdig, a previously reported environmentally-induced oncogene that antagonizes repressive trimethylation of histone proteins, is an important regulator for SARS-CoV-2 receptors neuropilin-1 (NRP1) and NRP2, cathepsins, glycan metabolism and inflammation, key determinants for viral infection and cytokine storm of the patients. Depletion of mdig in bronchial epithelial cells by CRISPR-Cas-9 gene editing resulted in a decreased expression of NRP1, NRP2, cathepsins, and genes involved in protein glycosylation and inflammation, largely due to a substantial enrichment of lysine 9 and/or lysine 27 trimethylation of histone H3 (H3K9me3/H3K27me3) on these genes as determined by ChIP-seq. Meanwhile, we also validated that environmental factor arsenic is able to induce mdig, NRP1 and NRP2, and genetic disruption of mdig lowered expression of NRP1 and NRP2. Furthermore, mdig may coordinate with the Neanderthal variants linked to an elevated mortality of COVID-19. These data, thus, suggest that mdig is a key mediator for the severity of COVID-19 in response to environmental exposure and targeting mdig may be the one of the effective strategies in ameliorating the symptom and reducing the mortality of COVID-19.

Keywords: COVID-19; Glycosylation; NRP1; NRP2; mdig.


Conflict of interest statement

Competing Interests: The authors have declared that no competing interest exists.

Figures

Figure 1
Figure 1
Knockout of mdig diminishes the expression of genes for SARS-CoV-2 infectivity. A. Western blotting shows decreased cleavage of the transfected SARS-CoV-2 S protein and the expression of CTSD in mdig KO BEAS-2B cells. Data are representatives of at least three independent experiments. Bottom panel shows ImageJ quantifications of the cleaved SARS-CoV-2 spike protein and pro-CTSD of three independent experiments of the WT and KO cells. The data were calibrated by the density of GAPDH or histone H3. B. The down-regulated genes in the mdig KO cells as determined by RNA-seq are highly represented for those gene induced by SARS-CoV-2 in intestinal organoids (GSE149312), cardiomyocytes (GSE150392), A549 cells (GSE147507), and bronchoalveolar lavage fluid (BALF) of COVID-19 patients. C. Reactome pathway assay shows the down-regulated genes in mdig KO cells as determined by RNA-seq are mostly in the pathways of extracellular matrix (ECM) regulation and glycan metabolism (highlighted in yellow).
Figure 2
Figure 2
ChIP-seq data revealed that mdig is antagonistic to H3K27me3 and H3K9me3. A. Pairwise Pearson correlation analyses were made through plotting the tag numbers of H3K4me3, H3K9me3 and H3K27me3 in the genome in mdig KO cells against the corresponding tag numbers in WT cells. B. Clustered heatmaps of ChIP-seq for H3K4me3, H3K27me3 and H3K9me3 in the promoter regions of WT cells and mdig KO cells. Bar graphs at the bottom show the total numbers of the indicated peaks in all regions of the genome in WT and mdig KO cells. C. Reactome pathway analysis of the genes showed significantly enhanced enrichment of H3K9me3 in mdig KO cells. The top-ranked pathways in glycan metabolism are marked in green color.
Figure 3
Figure 3
Diminished expression of genes related to SARS-CoV-2 infectivity. A. Down-regulation of S protein receptors NRP1 and NRP2 in mdig KO cells. Both ChIP-seq screenshot and RNA-seq spectrum for NRP1 and NRP2 were shown. Red arrows point to the reduced level of H3K4me3; green arrows denoted enhanced peaks of H3K9me3 and H3K27me3. B. Expression of NRP1 and NRP2 is mdig dependent. Left panels show time-dependent induction of mdig, NRP1 and NRP2 by As3+. Right panels show decreased level of NRP1 and NRP2 proteins in mdig KO cells as determined by Western blotting. C. The elevated enrichment of H3K9me3 as determined by ChIP-seq and reduced expression in RNA-seq of these indicated genes in mdig KO cells. D. Knockout of mdig elevated enrichment of H3K9me3 and/or H3K27me3 on the indicated cathepsin genes that also showed decreased enrichment of the active transcription marker, H3K4me3. Right panel: RNA-seq showed down-regulation of these indicated cathepsin genes in the mdig KO cells (except CTSF). Horizontal red and green arrows in Genome Browser screenshots indicate statistical differences, p < 0.05, of these enrichment peaks between WT and KO cells.
Figure 4
Figure 4
Depletion of mdig decreased expression of the genes in protein glycosylation. A. Diagram shows glucose metabolism and hexosamine biosynthetic pathway linked to glycan metabolism and glycosylation. The down-regulated genes in mdig KO cells are marked in green. B and C. Screenshot of ChIP-seq and RNA-seq for ST3GAL1 that catalyzes sialylation and HAS3 that catalyzes the generation of hyaluronan, respectively. Knockout of mdig enriched H3K9me3 and decreased H3K4me3, leading to the diminishment of the ST3GAL1 and HAS3 mRNA in RNA-seq. D. Down-regulation of O-glycosylation pathway genes in mdig KO cells. Red circles denote decreased, while blue circles denote an increased expression of the genes in mdig KO cells. The sizes of circles indicate the degree of increase or decrease of these gene expressions in mdig KO cells.
Figure 5
Figure 5
Environmental factor As3+ induces expression of genes for SARS-CoV-2 infection and increases metabolites in protein glycosylation. A. Screenshot of ChIP-seq of the indicated genes in control and As3+-transformed cells. B. Metabolomics analysis of the indicated precursor metabolites for protein glycosylation and metabolites in mitochondrial citric acid cycle in BEAS-2B and INS1 cells treated with 0.25 µM As3+ for the indicated times. d: days; m: months; h: hours.
Figure 6
Figure 6
Regulatory role of mdig on inflammation. A. ChIP-seq and RNA-seq of IL17RD in both WT and mdig KO cells. Red arrows point to the enhanced peaks of H3K27me3 and H3K9me3 on the IL17RD gene in mdig KO cells. B. RNA-seq shows down-regulation of these indicated inflammatory cytokine receptors or their regulatory protein in mdig KO cells. C. ChIP-seq shows increased enrichment of H3K9me3 on TLR6 gene and decreased enrichment of H3K4me3 on PTGER4 gene in mdig KO cells, which correlated to the diminished expression of these genes in RNA-seq (bottom panels). D. Enrichment of H3K27me3 and H3K9me3 on the NLRP gene loci that encode the key components of inflammasomes.
Figure 7
Figure 7
Immunohistochemical staining of mdig in normal and fibrotic human lung tissues. A. Staining of mdig in representative normal human lung tissues. A total of 17 normal lung tissue samples were investigated. B. Staining of mdig in fibrotic lung tissues from patients with chronic bronchitis. C. Staining of mdig in fibrotic lung tissues from patients with chronic pneumonia. D. Summary of mdig positive rates in normal and fibrotic human lung tissues.
Figure 8
Figure 8
Knockout of mdig enhances enrichment of the repressive histone trimethylation markers on the Neanderthal variants that increase the risk of severe COVID-19. Left panel shows Neanderthal haplotype region in Chromosome 3p21.31. Red arrows point to the elevated peaks of H3K9me3, H3K27me3 and H4K20me3 in the mdig KO cells. Right panel shows increased level of H3K9me3 in the gene body and promoter of DPP4 as indicated by red arrows. Red box denotes the promoter region of DPP4 encompassing all Neanderthal single nucleotide polymorphisms (SNPs) that increase the risk of severe COVID-19, including rs117888248, rs79624636, rs116906287, rs118098838, rs76135328, rs117460501, rs57355997, rs188765526, and others.
Figure 9
Figure 9
Schematic diagram shows regulatory roles of environmental factor-induced mdig on the infectivity of SARS-CoV-2 and the pathogenesis of COVID-19.

Similar articles

Cited by

References

    1. Hoffmann M, Kleine-Weber H, Schroeder S, Kruger N, Herrler T, Erichsen S. et al. SARS-CoV-2 Cell Entry Depends on ACE2 and TMPRSS2 and Is Blocked by a Clinically Proven Protease Inhibitor. Cell. 2020;181:271–80. e8. - PMC - PubMed
    1. Ou X, Liu Y, Lei X, Li P, Mi D, Ren L. et al. Characterization of spike glycoprotein of SARS-CoV-2 on virus entry and its immune cross-reactivity with SARS-CoV. Nat Commun. 2020;11:1620. - PMC - PubMed
    1. Segreto R, Deigin Y. The genetic structure of SARS-CoV-2 does not rule out a laboratory origin: SARS-COV-2 chimeric structure and furin cleavage site might be the result of genetic manipulation. Bioessays. 2021;43:e2000240. - PMC - PubMed
    1. Daly JL, Simonetti B, Klein K, Chen KE, Williamson MK, Anton-Plagaro C. et al. Neuropilin-1 is a host factor for SARS-CoV-2 infection. Science. 2020;370:861–5. - PMC - PubMed
    1. Cantuti-Castelvetri L, Ojha R, Pedro LD, Djannatian M, Franz J, Kuivanen S. et al. Neuropilin-1 facilitates SARS-CoV-2 cell entry and infectivity. Science. 2020;370:856–60. - PMC - PubMed

Publication types

MeSH terms