

Long-term predictions of current confirmed and dead cases of COVID-19 in China by the non-autonomous delayed epidemic models
- PMID: 34335995
- PMCID: PMC8312358
- DOI: 10.1007/s11571-021-09701-1
Long-term predictions of current confirmed and dead cases of COVID-19 in China by the non-autonomous delayed epidemic models
Abstract
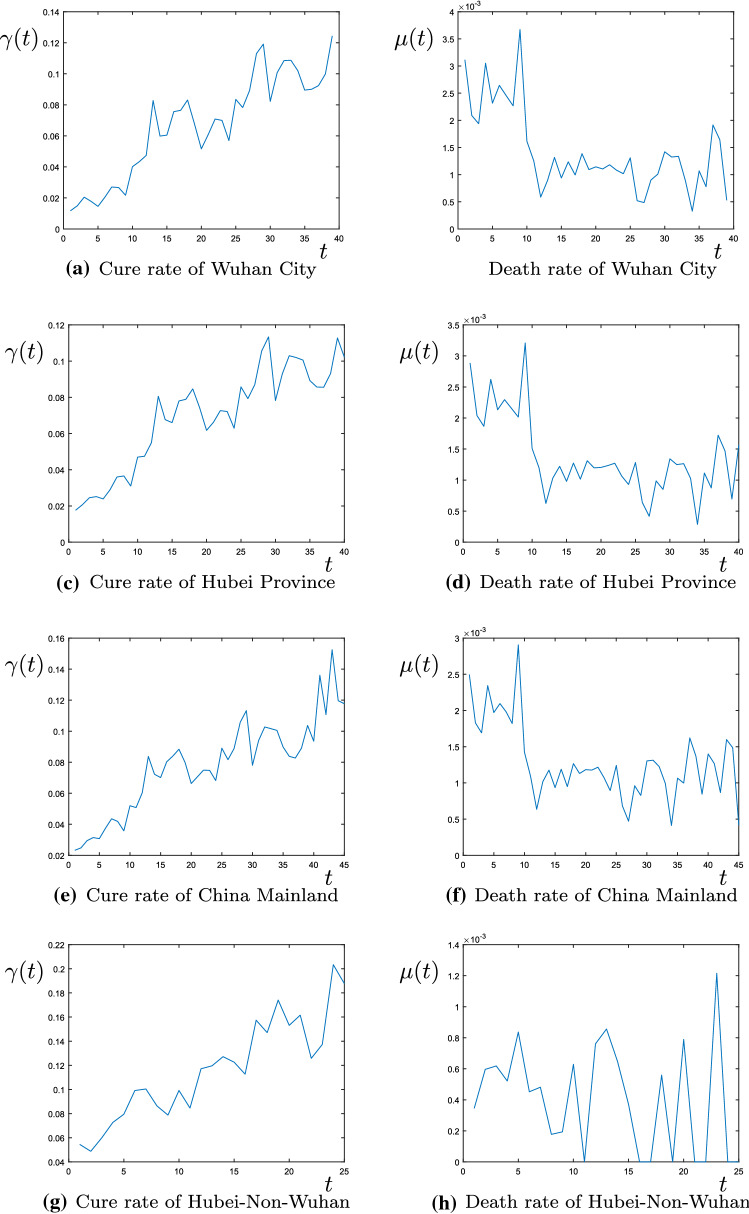
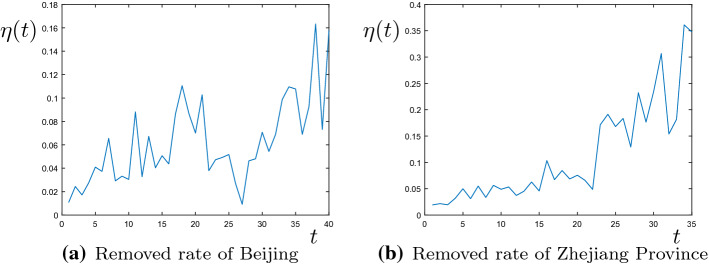
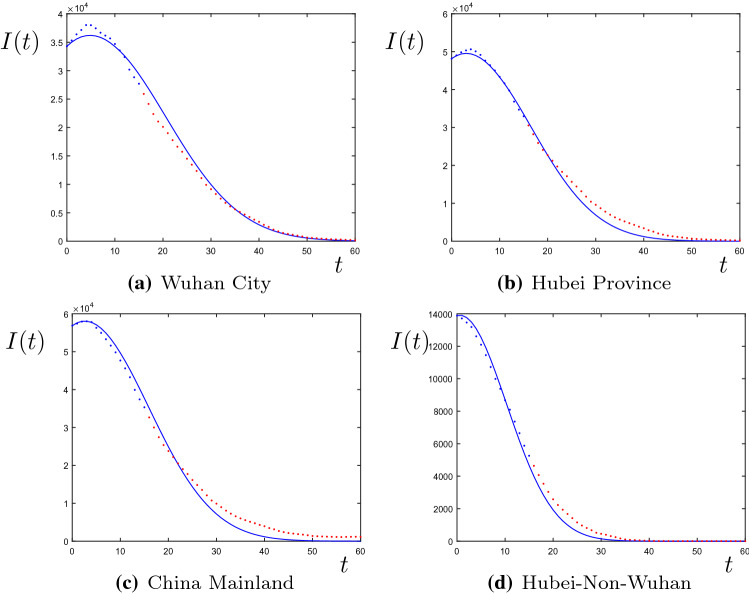
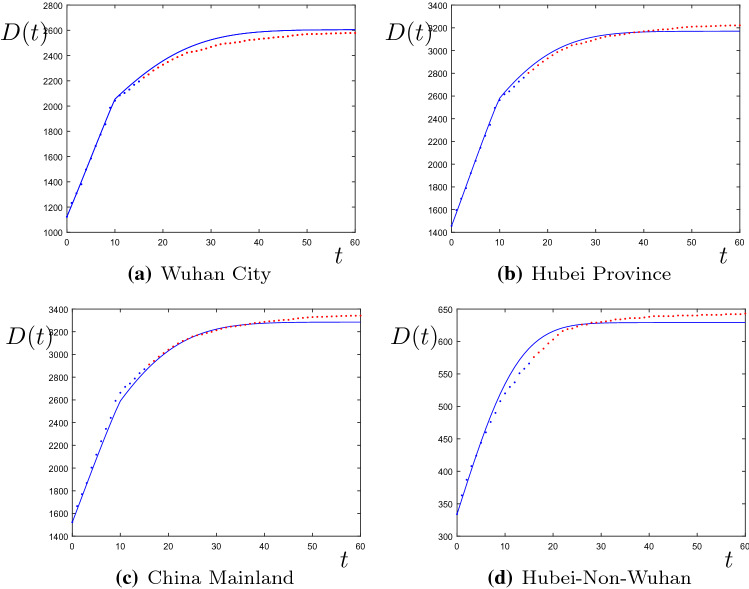
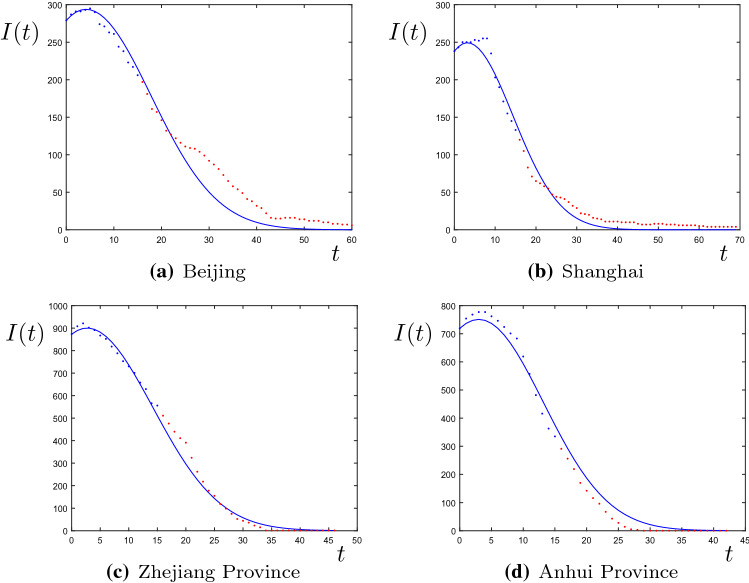
In this paper, we make long-term predictions based on numbers of current confirmed cases, accumulative dead cases of COVID-19 in different regions in China by modeling approach. Firstly, we use the SIRD epidemic model (S-Susceptible, I-Infected, R-Recovered, D-Dead) which is a non-autonomous dynamic system with incubation time delay to study the evolution of the COVID-19 in Wuhan City, Hubei Province and China Mainland. According to the data in the early stage issued by the National Health Commission of China, we can accurately estimate the parameters of the model, and then accurately predict the evolution of the COVID-19 there. From the analysis of the issued data, we find that the cure rates in Wuhan City, Hubei Province and China Mainland are the approximately linear increasing functions of time t and their death rates are the piecewisely decreasing functions. These can be estimated by finite difference method. Secondly, we use the delayed SIRD epidemic model to study the evolution of the COVID-19 in the Hubei Province outside Wuhan City. We find that its cure rate is an approximately linear increasing function and its death rate is nearly a constant. Thirdly, we use the delayed SIR epidemic model (S-Susceptible, I-Infected, R-Removed) to predict those of Beijing, Shanghai, Zhejiang and Anhui Provinces. We find that their cure rates are the approximately linear increasing functions and their death rates are the small constants. The results indicate that it is possible to make accurate long-term predictions for numbers of current confirmed, accumulative dead cases of COVID-19 by modeling. In this paper the results indicate we can accurately obtain and predict the turning points, the end time and the maximum numbers of the current infected and dead cases of the COVID-19 in China. In spite of our simple method and small data, it is rather effective in the long-term prediction of the COVID-19.
Keywords: COVID-19; End time; Long-term prediction; Maximum numbers; Parameter estimation; SIR; SIRD; Turning point.
© The Author(s), under exclusive licence to Springer Nature B.V. 2021.
Figures
Similar articles
-
Long-term prediction of the sporadic COVID-19 epidemics induced by -virus in China based on a novel non-autonomous delayed SIR model.Eur Phys J Spec Top. 2022;231(18-20):3649-3662. doi: 10.1140/epjs/s11734-022-00622-6. Epub 2022 Jul 4. Eur Phys J Spec Top. 2022. PMID: 35813987 Free PMC article.
-
Prediction of numbers of the accumulative confirmed patients (NACP) and the plateau phase of 2019-nCoV in China.Cogn Neurodyn. 2020 Jun;14(3):411-424. doi: 10.1007/s11571-020-09588-4. Epub 2020 Apr 27. Cogn Neurodyn. 2020. PMID: 32341718 Free PMC article.
-
Risk estimation and prediction of the transmission of coronavirus disease-2019 (COVID-19) in the mainland of China excluding Hubei province.Infect Dis Poverty. 2020 Aug 24;9(1):116. doi: 10.1186/s40249-020-00683-6. Infect Dis Poverty. 2020. PMID: 32831142 Free PMC article.
-
Modeling the epidemic dynamics and control of COVID-19 outbreak in China.Quant Biol. 2020;8(1):11-19. doi: 10.1007/s40484-020-0199-0. Epub 2020 Mar 11. Quant Biol. 2020. PMID: 32219006 Free PMC article.
-
Basic reproduction number and predicted trends of coronavirus disease 2019 epidemic in the mainland of China.Infect Dis Poverty. 2020 Jul 16;9(1):94. doi: 10.1186/s40249-020-00704-4. Infect Dis Poverty. 2020. PMID: 32678056 Free PMC article.
Cited by
-
Modeling the impact of hospitalization-induced behavioral changes on the spread of COVID-19 in New York City.Infect Dis Model. 2025 May 27;10(4):1055-1092. doi: 10.1016/j.idm.2025.05.001. eCollection 2025 Dec. Infect Dis Model. 2025. PMID: 40547859 Free PMC article.
-
Panel Associations Between Newly Dead, Healed, Recovered, and Confirmed Cases During COVID-19 Pandemic.J Epidemiol Glob Health. 2022 Mar;12(1):40-55. doi: 10.1007/s44197-021-00019-z. Epub 2021 Dec 11. J Epidemiol Glob Health. 2022. PMID: 34893956 Free PMC article.
References
-
- Al-Raeei M. The basic reproduction number of the new coronavirus pandemic with mortality for India, the Syrian Arab Republic, the United States. Yemen, China, France, Nigeria and Russia with different rate of cases. Clin Epidemiol Glob Health. 2021;9:147–149. doi: 10.1016/j.cegh.2020.08.005. - DOI - PMC - PubMed
-
- Alenezi MN, Al-Anzi FS, Alabdulrazzaq H. Building a sensible SIR estimation model for COVID-19 outspread in Kuwait. AEJ - Alex Eng J. 2021;60(3):3161–3175. doi: 10.1016/j.aej.2021.01.025. - DOI
-
- Ananthi P, Begum SJ, Jothi VL, et al. Survey on Forecasting the vulnerability of COVID-19 in Tamil Nadu. J Phys Conf Ser. 2021;1767(1):012006. doi: 10.1088/1742-6596/1767/1/012006. - DOI
-
- Bittihn P, Golestanian R (2020) Containment strategy for an epidemic based on fluctuations in the SIR model. arXiv 1–6
LinkOut - more resources
Full Text Sources
