. 2021 Jul 16:9:700634.
doi: 10.3389/fcell.2021.700634. eCollection 2021.

Metabolic Profile and Neurogenic Potential of Human Amniotic Fluid Stem Cells From Normal vs. Fetus-Affected Gestations

Affiliations

Metabolic Profile and Neurogenic Potential of Human Amniotic Fluid Stem Cells From Normal vs. Fetus-Affected Gestations

Giedrė Valiulienė et al. Front Cell Dev Biol. .

Abstract

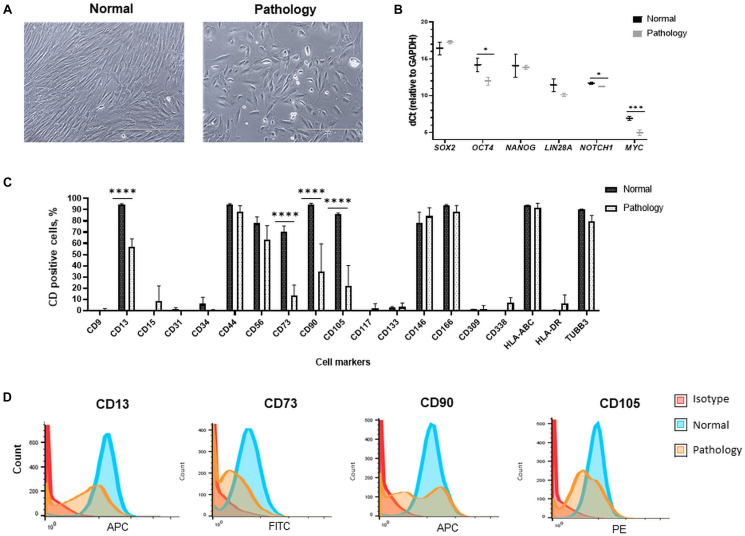
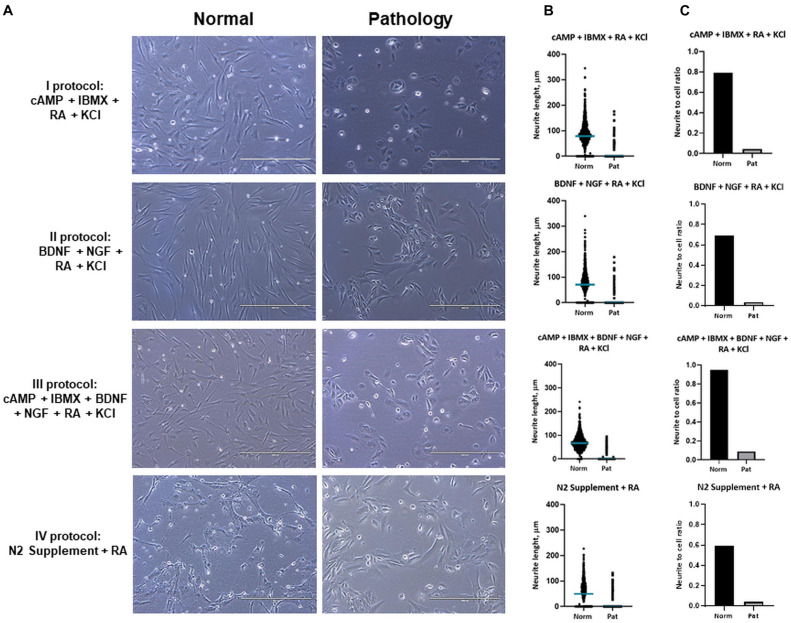
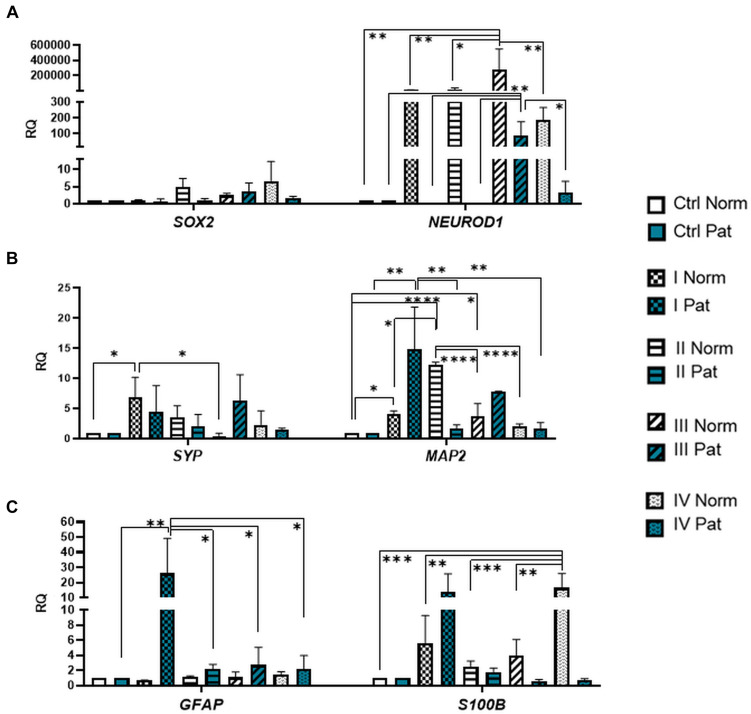
Human amniotic fluid stem cells (hAFSCs) possess some characteristics with mesenchymal stem cells (MSCs) and embryonic stem cells and have a broader differentiation potential compared to MSCs derived from other sources. Although hAFSCs are widely researched, their analysis mainly involves stem cells (SCs) obtained from normal, fetus-unaffected gestations. However, in clinical settings, knowledge about hAFSCs from normal gestations could be poorly translational, as hAFSCs from healthy and fetus-diseased gestations may differ in their differentiation and metabolic potential. Therefore, a more thorough investigation of hAFSCs derived from pathological gestations would provide researchers with the knowledge about the general characteristics of these cells that could be valuable for further scientific investigations and possible future clinical applicability. The goal of this study was to look into the neurogenic and metabolic potential of hAFSCs derived from diseased fetuses, when gestations were concomitant with polyhydramnios and compare them to hAFSCs derived from normal fetuses. Results demonstrated that these cells are similar in gene expression levels of stemness markers (SOX2, NANOG, LIN28A, etc.). However, they differ in expression of CD13, CD73, CD90, and CD105, as flow cytometry analysis revealed higher expression in hAFSCs from unaffected gestations. Furthermore, hAFSCs from "Normal" and "Pathology" groups were different in oxidative phosphorylation rate, as well as level of ATP and reactive oxygen species production. Although the secretion of neurotrophic factors BDNF and VEGF was of comparable degree, as evaluated with enzyme-linked immunosorbent assay (ELISA) test, hAFSCs from normal gestations were found to be more prone to neurogenic differentiation, compared to hAFSCs from polyhydramnios. Furthermore, hAFSCs from polyhydramnios were distinguished by higher secretion of pro-inflammatory cytokine TNFα, which was significantly downregulated in differentiated cells. Overall, these observations show that hAFSCs from pathological gestations with polyhydramnios differ in metabolic and inflammatory status and also possess lower neurogenic potential compared to hAFSCs from normal gestations. Therefore, further in vitro and in vivo studies are necessary to dissect the potential of hAFSCs from polyhydramnios in stem cell-based therapies. Future studies should also search for strategies that could improve the characteristics of hAFSCs derived from diseased fetuses in order for those cells to be successfully applied for regenerative medicine purposes.

Keywords: cell differentiation; energy metabolism; mesenchymal stem cells; neurogenesis; polyhydramnios.


Conflict of interest statement

The authors declare that the research was conducted in the absence of any commercial or financial relationships that could be construed as a potential conflict of interest.

Figures

FIGURE 1
FIGURE 1
Morphological, gene expression, and cell surface marker characterization of hAFSCs derived from normal and fetus-affected gestations. (A) Morphology of hAFSCs cells from a healthy donor (Normal) and pathological gestation (Pathology [Pat1]) amniotic fluid samples (representative images; scale bar = 400 μm). (B) RT-qPCR analysis of pluripotency gene markers in samples of hAFSCs of normal (Normal, n = 3) and fetus-pathological (Pathology, n = 3) gestations. mRNA expression levels were normalized to GAPDH and presented as mean values of ΔCt ± SD. *Denotes significant difference with p < 0.05 and ***denotes significant difference with p < 0.005, as evaluated using two sample t-test. (C) Cell surface marker expression of CD9, CD13, CD15, CD31, CD34, CD44, CD56, CD73, CD90, CD105, CD117, CD133, CD146, CD166, CD309, CD338, HLA-ABC, and HLA-DR and cell expression of TUBB3 determined in hAFSCs from healthy and fetus-affected gestations by flow cytometry analysis. Data shown as percentage (n = 3) and values are indicated as mean ± SD. ****Denotes significant difference with p < 0.0001, as evaluated using one-way ANOVA with Tukey’s post hoc test. (D) The immunophenotypic characteristics of representative samples of hAFSCs of a healthy (Normal) gestation and hAFSCs from polyhydramnios (Pathology, [Pat1]) samples, determined by flow cytometric analysis after incubation with fluorescent-conjugated antibodies against cell surface antigens CD13, CD73, CD90, and CD105.
FIGURE 2
FIGURE 2
Cellular bioenergetics analysis of hAFSCs from normal and fetus-affected gestations. (A) Assessment of cellular energy flux for hAFSCs, obtained from fetus-unaffected (Normal, n = 3) and fetus-affected (Pathology, n = 3) gestations, shown as a percentage relative to hAFSCs from fetus-unaffected gestations. Comparative measurements were taken using Abcam Extracellular oxygen consumption assay (ab197243) and Abcam Glycolysis assay (ab197244). (B) Analysis of mitochondrial membrane potential (Δψm) of hAFSCs, obtained from fetus-unaffected (Normal, n = 3) and fetus-affected (Pathology, n = 3) gestations; values are indicated as mean ± SD. Analysis was performed using Abcam TMRE Mitochondrial membrane potential assay kit (ab113852). (C) Assessment of cellular energy content (ATP) of hAFSCs, obtained from fetus-unaffected (Normal, n = 3) and fetus-affected (Pathology, n = 3) gestations. Measurements were performed using Abcam Luminescent ATP detection assay kit (ab113849). (D–F) ROS production measurement in hAFSCs, obtained from fetus-unaffected (Normal, n = 3) and fetus-affected (Pathology, n = 3) gestations, performed using Abcam DCFDA Cellular ROS detection assay kit (ab113851). Qualitative evaluation with fluorescence microscopy (D): representative images of ROS production in Normal and Pathology groups (scale bar = 400 μm). Quantitative evaluation with flow cytometry (E,F) representative images of ROS production (E) and median fluorescence intensity evaluation (F) in Normal and Pathology [Pat2] groups. (G) RT-qPCR analysis of genes related to cell metabolism and respiration: HIF1A, NRF1, PPARGC1A, ERRA, PKM, LDHA, PDK1, CAT1, SOD2, and GPX1 in control hAFSCs from normal and fetus-affected gestations. mRNA expression levels were normalized to GAPDH and RPL13A and presented as mean values of ΔCt ± SD. *Denotes significant difference with p < 0.05, as evaluated using Student’s t-test.
FIGURE 3
FIGURE 3
Neuronal differentiation of hAFSCs from normal and fetus-affected gestations. (A) Representative images of hAFSCs from normal (Normal) and fetus-pathological (Pathology [Pat1]) gestations upon 72-h treatments with different neuronal differentiation inducing cell culture medias, denoted as I–IV protocols (see Table 1 in section “Materials and Methods”; scale bars = 400 μm). (B) Neurite length (μm) estimation for neuro-differentiated hAFSCs, obtained from fetus-unaffected (Normal, n = 3) and fetus-affected (Pathology, n = 3) gestations was performed using ImageJ program with the NeuronJ plugin; all estimated values (n > 1,000) were presented in scatter plot with median value denoted. (C) Neurite number per cell for neuro-differentiated hAFSCs, obtained from fetus-unaffected (Normal, n = 3) and fetus-affected (Pathology, n = 3) gestations was estimated and presented as neurite-to-cell ratio (n > 1,000).
FIGURE 4
FIGURE 4
Cytoskeletal reorganization and neural marker expression of control and neural differentiation-induced hAFSCs derived from normal and fetus-affected gestations. Representative images of healthy hAFSCs (Normal) and fetus-affected gestations (Pathology [Pat3]) shown. Neural differentiation was induced after 24-h exposure to pre-induction media, enriched with 20 ng/ml FGF and 20 ng/ml EGF, and further 3-h treatment with neuronal differentiation-inducing cell culture media, supplemented with 1 mM 8-Bromo-cAMP, 0.3 mM IBMX, 50 ng/ml BDNF, 100 ng/ml NGF, 5 mM KCl, and 2 μM RA (see III protocol in section “Materials and Methods,” Table 1). Immunofluorescence analysis of hAFSCs showing positive cells for neural marker TUBB3 and cytoskeletal protein Vimentin (green) as well as neural marker NCAM1 and cytoskeletal protein F-actin (red). Nuclei were counterstained with DAPI (blue); scale bar = 50 μm.
FIGURE 5
FIGURE 5
Gene expression profile of neuronal markers, neurotransmitter-producing enzymes, and cytoskeletal proteins in hAFSCs from normal and fetus-affected gestations induced to neuronal differentiation. RT-qPCR analysis of hAFSCs (A) neuronal markers NCAM1, NCAM2, and NSE; (B) cytoskeletal protein genes NES, VIM, and TUBB3; and (C) neurotransmitter-producing enzyme genes TPH1, TPH2, and GAD1. Gene expression analysis was performed using control hAFSCs (not treated, Ctrl) and neuronal differentiation-induced hAFSCs (treated for 72 h with I–IV differentiation protocols; see Table 1 in section “Materials and Methods”) from normal (Norm, n = 3) and fetus-pathological (Pat, n = 3) gestations. RT-qPCR data are represented as relative fold change over undifferentiated control, normalized for the housekeeping genes GAPDH and RPL13A; values are indicated as mean ± SD. *Denotes significant difference with p < 0.05, **denotes significant difference with p < 0.01, ***denotes significant difference with p < 0.005, and ****denotes significant difference with p < 0.0001, as evaluated using one-way ANOVA with Tukey’s post hoc test.
FIGURE 6
FIGURE 6
Gene expression profile of neuronal transcription factors and post-mitotic neuronal and glial markers in hAFSCs from normal and fetus–affected gestations induced to neuronal differentiation. RT-qPCR analysis of (A) hAFSCs neuronal transcription factors SOX2 and NEUROD1, (B) markers of differentiated post-mitotic neural cells SYP and MAP2, and (C) glial markers GFAP and S100B. Gene expression analysis was performed using control hAFSCs (not treated, Ctrl) and neuronal differentiation-induced hAFSCs (treated for 72 h with I–IV differentiation protocols; see Table 1 in section “Materials and Methods”) from normal (Norm, n = 3) and fetus-pathological (Pat, n = 3) gestations. RT-qPCR data are represented as relative fold change over undifferentiated control, normalized for the housekeeping genes GAPDH and RPL13A; values are indicated as mean ± SD. *Denotes significant difference with p < 0.05, **denotes significant difference with p < 0.01, ***denotes significant difference with p < 0.005, and ****denotes significant difference with p < 0.0001, as evaluated using one-way ANOVA with Tukey’s post hoc test.
FIGURE 7
FIGURE 7
Gene expression profile of growth and neurotrophic factors in hAFSCs from normal and fetus–affected gestations induced to neuronal differentiation. RT-qPCR analysis of (A) growth factor receptors FGFR1 and PDGFRA, (B) growth factors VEGFA, TGFB1, and HBEGF, as well as (C) neurotrophic factors BDNF, NGF, NTF3, and NTF4 and (D) their receptors NTRK1, NTRK2, and NTRK3. Gene expression analysis was performed using control hAFSCs (not treated, Ctrl) and neuronal differentiation-induced hAFSCs (treated for 72 h with I–IV differentiation protocols; see Table 1 in section “Materials and Methods”) from normal (Norm, n = 3) and fetus-pathological (Pat, n = 3) gestations. RT-qPCR data are represented as relative fold change over undifferentiated control, normalized for the housekeeping genes GAPDH and RPL13A; values are indicated as mean ± SD. *Denotes significant difference with p < 0.05, **denotes significant difference with p < 0.01, ***denotes significant difference with p < 0.005, and ****denotes significant difference with p < 0.0001, as evaluated using one-way ANOVA with Tukey’s post hoc test.
FIGURE 8
FIGURE 8
Gene expression of ion channels and protein expression of neuro-induced hAFSCs from fetus-affected vs. fetus-unaffected gestations. (A) Expression analysis of neuronal differentiation-associated proteins Nestin, Musashi 1, LIN28a, and TUBB3. Protein expression was evaluated flow cytometrically, estimating the mean fluorescence intensity. Values are indicated as mean ± SD (n = 3). Neural differentiation was induced after 24-h exposure to pre-induction media, enriched with 20 ng/ml FGF and 20 ng/ml EGF, and further 72-h treatment with neuronal differentiation-inducing cell culture media, supplemented with 50 ng/ml BDNF, 100 ng/ml NGF, 5 mM KCl, and 2 μM RA (see II protocol in section “Materials and Methods,” Table 1). (B) RT-qPCR analysis of HCN2 (Hyperpolarization activated cyclic nucleotide gated potassium and sodium channel) and KCNJ2 (Potassium inwardly rectifying channel subfamily member 2) neural ion channel gene expression. Gene expression analysis was performed using control hAFSCs (not treated, Ctrl) and neuronal differentiation-induced hAFSCs (differentiated for 72 h using II protocol, see Table 1 in section “Materials and Methods”) from normal (Norm, n = 3) and fetus-pathological (Pat, n = 3) gestations. RT-qPCR data are represented as relative fold change over undifferentiated control, normalized for the housekeeping genes GAPDH and RPL13A; values are indicated as mean ± SD. (C–F) Secretion levels of differentiation-associated proteins BDNF (C), VEGF (D), and of pro-inflammatory cytokines IL-6 (E) and TNFα (F) in undifferentiated or differentiated toward neurogenic lineage (differentiated for 72 h using II protocol, see Table 1 in section “Materials and Methods”) hAFSCs from healthy (Normal, n = 3) and fetus-affected (Pathology, n = 3) gestations. Secretion of proteins was assessed by using ELISA kits from R&D Systems. (G) RT-qPCR analysis of TNFA gene in undifferentiated hAFSCs from healthy (Normal, n = 3) and fetus-affected (Pathology, n = 3) gestations. mRNA expression levels were normalized to GAPDH and RPL13A and presented as mean values of ΔCt ± SD. (H) RT-qPCR analysis of TNFα receptor genes TNFR1 and TNFR2 in undifferentiated or differentiated toward neurogenic lineage (differentiated for 72 h using II protocol, see Table 1 in section “Materials and Methods”) hAFSCs from healthy (Normal, n = 3) and fetus-affected (Pathology, n = 3) gestations. mRNA expression levels were normalized to GAPDH and RPL13A and presented as fold change over undifferentiated control. *Denotes significant difference with p < 0.05, **denotes significant difference with p < 0.01, and ****denotes significant difference with p < 0.0001, as evaluated using Student’s t-test.

Similar articles

Cited by

References

    1. Abe Y., Ochiai D., Masuda H., Sato Y., Otani T., Fukutake M., et al. (2019). In utero amniotic fluid stem cell therapy protects against myelomeningocele via spinal cord coverage and hepatocyte growth factor secretion. Stem Cells Transl. Med. 8 1170–1179. 10.1002/sctm.19-0002 - DOI - PMC - PubMed
    1. Abe Y., Ochiai D., Sato Y., Otani T., Fukutake M., Ikenoue S., et al. (2021). Amniotic fluid stem cells as a novel strategy for the treatment of fetal and neonatal neurological diseases. Placenta 104 247–252. 10.1016/j.placenta.2021.01.009 - DOI - PubMed
    1. Ahn S. Y., Park W. S., Sung S. I., Chang Y. S. (2021). Mesenchymal stem cell therapy for intractable neonatal disorders. Pediatr. Neonatol. 62 S16–S21. 10.1016/j.pedneo.2020.11.007 - DOI - PubMed
    1. Alessio N., Pipino C., Mandatori D., Di Tomo P., Ferone A., Marchiso M., et al. (2018). Mesenchymal stromal cells from amniotic fluid are less prone to senescence compared to those obtained from bone marrow: an in vitro study. J. Cell. Physiol. 233 8996–9006. 10.1002/jcp.26845 - DOI - PubMed
    1. Bonaventura G., Chamayou S., Liprino A., Guglielmino A., Fichera M., Caruso M., et al. (2015). Different tissue-derived stem cells: a comparison of neural differentiation capability. PLoS One 10:0140790. 10.1371/journal.pone.0140790 - DOI - PMC - PubMed