. 2021 Jul 14:8:679518.
doi: 10.3389/fmed.2021.679518. eCollection 2021.

S-Nitrosylation of RhoGAP Myosin9A Is Altered in Advanced Diabetic Kidney Disease

Affiliations

S-Nitrosylation of RhoGAP Myosin9A Is Altered in Advanced Diabetic Kidney Disease

Qi Li et al. Front Med (Lausanne). .

Abstract

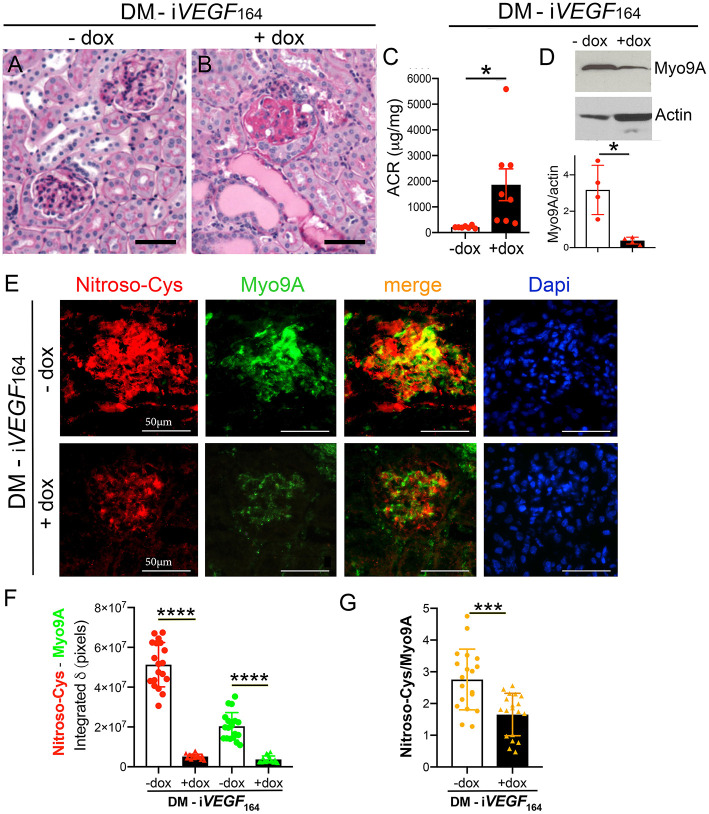
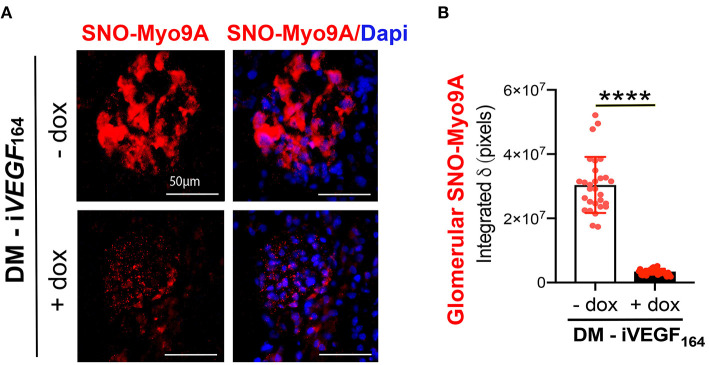
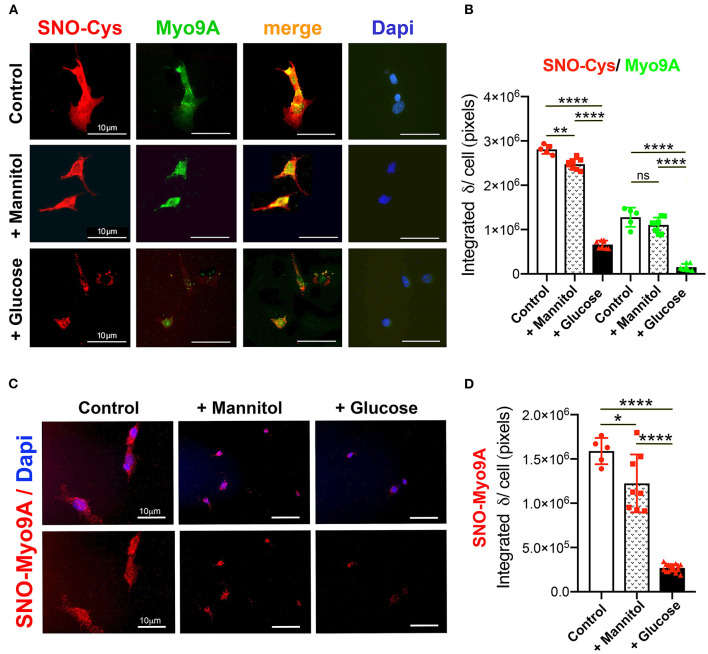
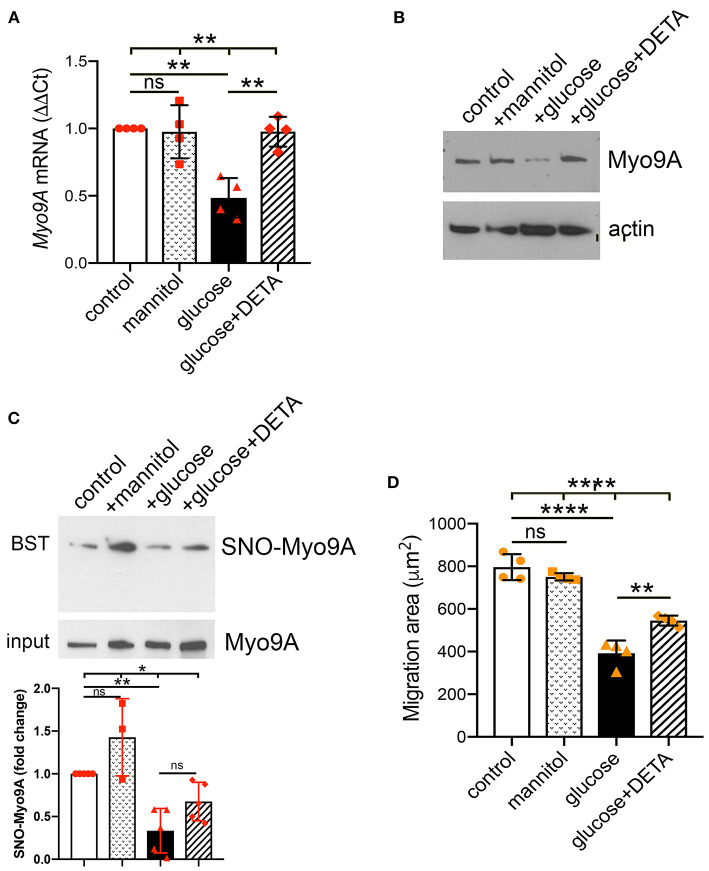
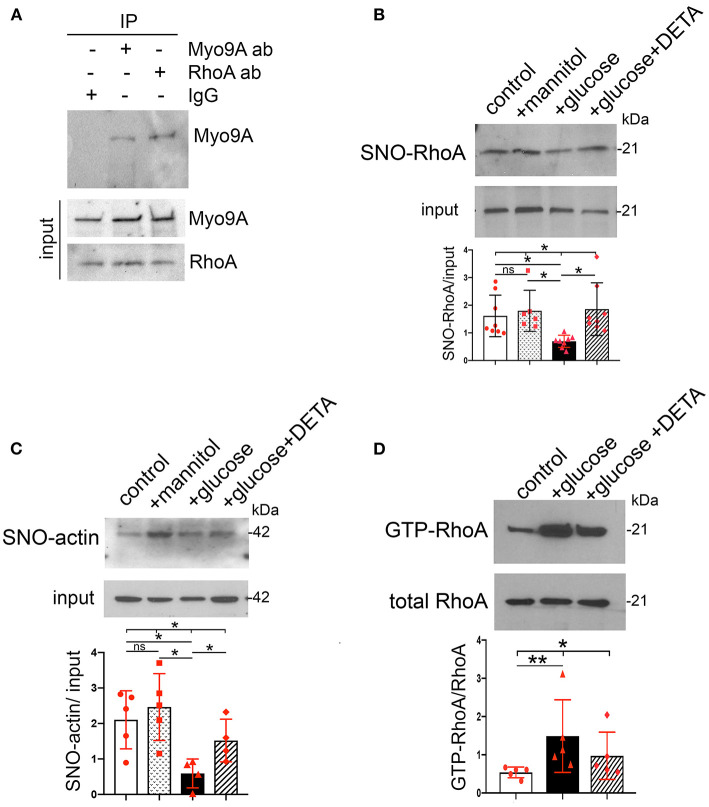
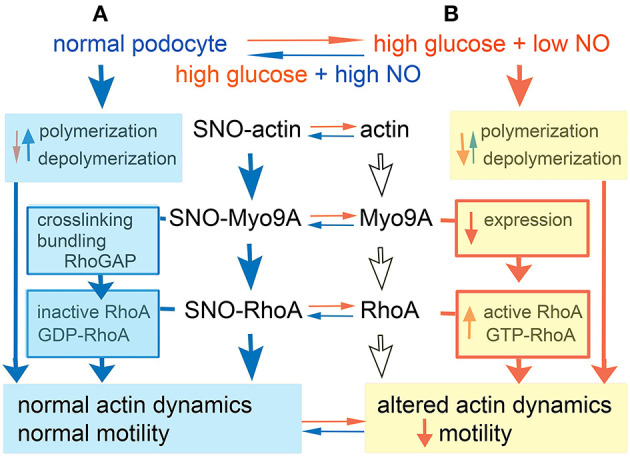
The molecular pathogenesis of diabetic kidney disease progression is complex and remains unresolved. Rho-GAP MYO9A was recently identified as a novel podocyte protein and a candidate gene for monogenic FSGS. Myo9A involvement in diabetic kidney disease has been suggested. Here, we examined the effect of diabetic milieu on Myo9A expression in vivo and in vitro. We determined that Myo9A undergoes S-nitrosylation, a post-translational modification dependent on nitric oxide (NO) availability. Diabetic mice with nodular glomerulosclerosis and severe proteinuria associated with doxycycline-induced, podocyte-specific VEGF 164 gain-of-function showed markedly decreased glomerular Myo9A expression and S-nitrosylation, as compared to uninduced diabetic mice. Immortalized mouse podocytes exposed to high glucose revealed decreased Myo9A expression, assessed by qPCR, immunoblot and immunocytochemistry, and reduced Myo9A S-nitrosylation (SNO-Myo9A), assessed by proximity link assay and biotin switch test, functionally resulting in abnormal podocyte migration. These defects were abrogated by exposure to a NO donor and were not due to hyperosmolarity. Our data demonstrate that high-glucose induced decrease of both Myo9A expression and SNO-Myo9A is regulated by NO availability. We detected S-nitrosylation of Myo9A interacting proteins RhoA and actin, which was also altered by high glucose and NO dependent. RhoA activity inversely related to SNO-RhoA. Collectively, data suggest that dysregulation of SNO-Myo9A, SNO-RhoA and SNO-actin may contribute to the pathogenesis of advanced diabetic kidney disease and may be amenable to therapeutic targeting.

Keywords: MYO9A; RhoA; S-nitrosylation; actin; cell cross-talk; diabetic kidney disease.


Conflict of interest statement

The authors declare that the research was conducted in the absence of any commercial or financial relationships that could be construed as a potential conflict of interest.

Figures

Figure 1
Figure 1
Myo9A is downregulated in advanced diabetic kidney disease. (A) Kidney PAS stain from uninduced diabetic mouse (DM-iVEGF164, - dox) showing mild mesangial proliferation; (B) kidney PAS stain from induced diabetic mouse (DM-iVEGF164, + dox) showing nodular glomerulosclerosis and large protein casts; (C) Urine ACR (albumin:creatinine ratio, mg/mg) shows mild albuminuria in uninduced diabetic mice (DM-iVEGF164, - dox, n = 7) and nephrotic range proteinuria in induced diabetic mice (DM-iVEGF164, + dox, n = 8), unpaired t-test with Welch's correction, P = 0.033; (D) representative immunoblot shows decreased kidney Myo9A expression in mice with advanced DKD (DM-iVEGF164, + dox); quantitation of Myo9A expression normalized to actin confirms significant Myo9A downregulation in n = 4 immunoblots (kidney lysates pooled from 4 to 6 mice/experimental group), mean ± SD, P < 0.05; (E) Fluorescence IHC shows S-nitrosylated proteins (red) and Myo9A (green) partially co-localized (merge) in glomeruli from uninduced diabetic kidneys (DM-iVEGF164, - dox), both Myo9A and nitroso-Cys IF signals are reduced in glomeruli from kidneys with advanced DKD (DM-iVEGF164, + dox); (F) quantitation of Myo9A and nitroso-Cys IF signals confirm a dramatic decrease in glomerular Myo9A expression and S-nitrosylated proteins in kidneys with advanced DKD (DM-iVEGF164, + dox), mean ± SD, n = 19 glomeruli/experimental group (each from 3 to 5 mice), unpaired t-test with Welch's correction, p < 0.0001; (G) quantitation of the IF signals' ratio Nitroso-Cys/Myo9A shows significant decrease in kidneys with advanced DKD, mean ± SD, n = 19 glomeruli/experimental group, unpaired t-test with Welch's correction, p = 0.0002. Scale bars = 50μm. *p < 0.05, ***p < 0.005, ****p < 0.0001.
Figure 2
Figure 2
Glomerular Myo9A is S-nitrosylated in diabetic mice. (A) Proximity link assay IF signal (red) identifies abundant S-nitrosylated Myo9A (SNO-Myo9a) in glomeruli from uninduced diabetic mice with mild DKD (DM-iVEGF164 - dox), whereas SNO-Myo9A is clearly reduced in glomeruli from induced diabetic mice with advanced DKD (DM-iVEGF164, + dox). Dapi (blue) identifies cell nuclei. Scale bars = 50 μm. (B) Quantification of PLA IF signals, mean ± SD, n = 29–31/experimental group, unpaired t-test with Welch's correction, ****p < 0.0001.
Figure 3
Figure 3
Podocyte Myo9A expression and S-nitrosylation are downregulated by high glucose. (A) IHC shows abundant SNO-Cys proteins (red) and Myo9A (green) partially co-localized in normal podocytes (top panels) and in podocytes exposed to mannitol (middle panels), whereas both SNO-Cys and Myo9A signals are clearly reduced in podocytes exposed to high glucose (bottom panels). Scale bars= 10μm. (B) Quantitation of IHC IF signals demonstrate highly significant decrease in Myo9A and SNO-Cys proteins in podocytes exposed to high glucose, data expressed as mean ± SD, n = 24–32 cells/experimental group, Welch's ANOVA p < 0.0001, unpaired t-test with Welch's correction p < 0.027 or n.s. control vs. mannitol, p < 0.0001 mannitol vs. high glucose. (C) Proximity link assay IF signal (red) identifies SNO-Myo9A in control podocytes, a mild decrease in podocytes exposed to mannitol and barely detected SNO-Myo9A in podocytes exposed to high glucose; Dapi (blue) identifies cell nuclei. Scale bars = 10μm. (D) Quantification of PLA IF signals, mean ± SD, n = 20–31 cells/experimental group, Welch's ANOVA p < 0.0001, unpaired t-test with Welch's correction p < 0.02 control vs. mannitol, p < 0.0001 mannitol vs. high glucose. *p < 0.05, **p < 0.01, ****p < 0.0001.
Figure 4
Figure 4
Podocyte Myo9A expression and SNO-Myo9A are regulated by glucose and NO. (A) qPCR shows that Myo9A mRNA is not affected by mannitol, decreases ~50% in podocytes exposed to high glucose and addition of NO donor prevents Myo9A mRNA downregulation, mean ± SD, n = 4 independent experiments; Welch's ANOVA p < 0.02, unpaired t-test with Welch's correction: n.s. control vs. mannitol, p < 0.02 control vs. high glucose, p < 0.02 high glucose vs. high glucose + DETA. (B) Immunoblots show that Myo9A protein expression is not altered by mannitol, decreases ≥50% in podocytes exposed to high glucose and addition of NO donor prevents Myo9A downregulation. (C) BST shows SNO-Myo9A in control podocytes, SNO-Myo9A ~50% decrease in podocytes exposed to high glucose, addition of NO donor partially prevents Myo9A de-nitrosylation. Input shows total Myo9A loading, mean ± SD, n = 3–5 independent experiments, Brown-Forsythe ANOVA test, p = 0.022, unpaired t-test with Welch's correction non-significant (n.s.) control vs. mannitol, **p = 0.0046 control vs. high glucose, p = 0.0575 (n.s.) high glucose vs. high glucose + DETA. (D) Migration ‘wound' assay shows that podocyte migration is not affected by mannitol, whereas high glucose clearly reduces podocyte migration and addition of NO donor partially prevents this defect, mean ± SD, n = 4 independent experiments; Welch's ANOVA p < 0.0001, unpaired t-test with Welch's correction non-significant (n.s.) control vs. mannitol, p < 0.005 control vs. high glucose, p < 0.02 high glucose vs. high glucose + DETA. *p < 0.05, **p < 0.01, ****p < 0.0001.
Figure 5
Figure 5
Podocyte SNO-RhoA, SNO-actin and RhoA activity regulation by glucose and NO. (A) Immunoprecipitation (IP): Myo9A and RhoA, WB: RhoA and Myo9A demonstrate Myo9A-RhoA interaction in podocytes. (B) BST shows SNO-RhoA in normal podocytes, ~50% SNO-RhoA decrease in podocytes exposed to high glucose, addition of NO donor prevents RhoA de-nitrosylation. Input shows total RhoA, mean ± SD, n = 6–8 independent experiments, Welch's ANOVA test, p = 0.002, unpaired t-test with Welch's correction non-significant (n.s.) control vs. mannitol, p < 0.01 control vs. high glucose, p < 0.01 high glucose vs. high glucose + DETA. (C) BST shows SNO-actin >50% decrease induced by high glucose, partially prevented by the NO donor DETA. Input shows actin loading, mean ± SD, n = 4–6 independent experiments, Welch's ANOVA test, p = 0.013; unpaired t-test with Welch's correction n.s. control vs. mannitol, p = 0.0011 control vs. high glucose, p < 0.05 high glucose vs. high glucose + DETA. (D) RhoA activity assay shows that exposure to high glucose increases active GTP-RhoA and addition of NO donor partially prevents activation of RhoA. Total RhoA shows equal input, mean ± SD, n = 5 independent experiments, Kruskall-Wallis test, p = 0.013; Mann-Whitney test p = 0.0079 control vs. high glucose. *p < 0.05 and **p < 0.01.
Figure 6
Figure 6
Model. (A) In normal podocyte culture conditions actin, Myo9A and RhoA are S-nitrosylated (SNO), whereby F actin polymerization predominates, Myo9A crosslinks and bundles actin and inactivates RhoA leading to normal actin dynamics and podocyte motility. (B) In high glucose + low NO conditions podocyte SNO-Myo9A, SNO-RhoA and SNO-actin decrease significantly (de-nitrosylate), actin depolymerization may predominate, Myo9A expression decreases and RhoA activity increases, together resulting in altered actin dynamics and reduced podocyte motility. Most of these changes are partially reversible by addition of NO donor.

Similar articles

Cited by

References

    1. Tuttle KR, Bakris GL, Bilous RW, Chiang JL, de Boer IH, Goldstein-Fuchs J, et al. . Diabetic kidney disease: a report from an ADA consensus conference. Am J Kidney Dis. (2014) 64:510–33. 10.1053/j.ajkd.2014.08.001 - DOI - PubMed
    1. Warren AM, Knudsen ST, Cooper ME. Diabetic nephropathy: an insight into molecular mechanisms and emerging therapies. Exp Opin Ther Targ. (2019) 23:579–91. 10.1080/14728222.2019.1624721 - DOI - PubMed
    1. Ingelfinger JR, Rosen CJ. Clinical credence - SGLT2 inhibitors, diabetes, and chronic kidney disease. N Engl J Med. (2019) 380:2371–73. 10.1056/NEJMe1904740 - DOI - PubMed
    1. Tonneijck L, Muskiet MH, Smits MM, Van Bommel EJ, Heerspink HJ, Van Raalte DH, et al. . Glomerular hyperfiltration in diabetes: mechanisms, clinical significance, and treatment. J Am Soc Nephrol. (2017) 28:1023–39. 10.1681/ASN.2016060666 - DOI - PMC - PubMed
    1. Reidy K, Kang HM, Hostetter T, Susztak K. Molecular mechanisms of diabetic kidney disease. J Clin Invest. (2014) 124:2333–40. 10.1172/JCI72271 - DOI - PMC - PubMed