

Uraemic Cardiomyopathy in Different Mouse Models
- PMID: 34336893
- PMCID: PMC8316724
- DOI: 10.3389/fmed.2021.690517
Uraemic Cardiomyopathy in Different Mouse Models
Abstract
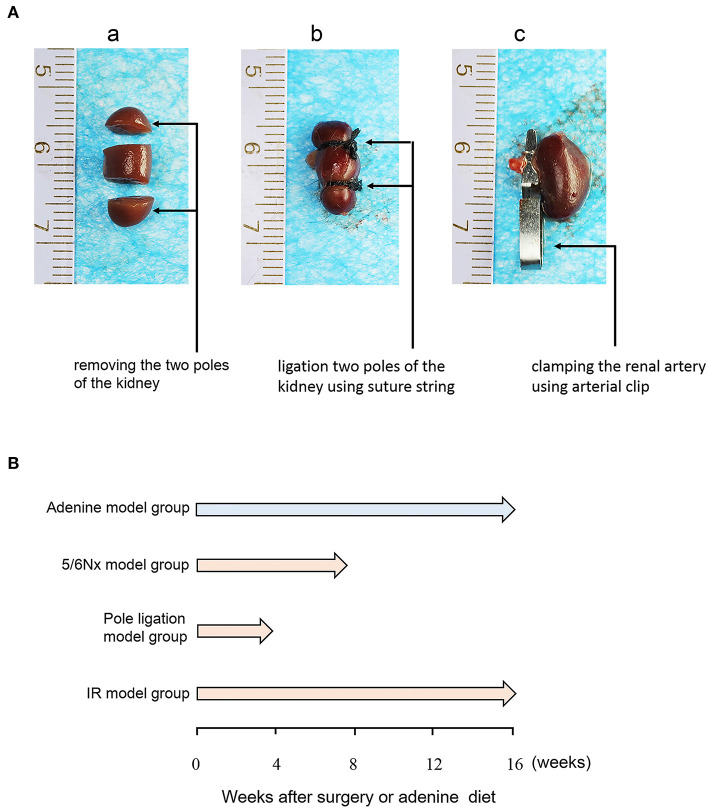
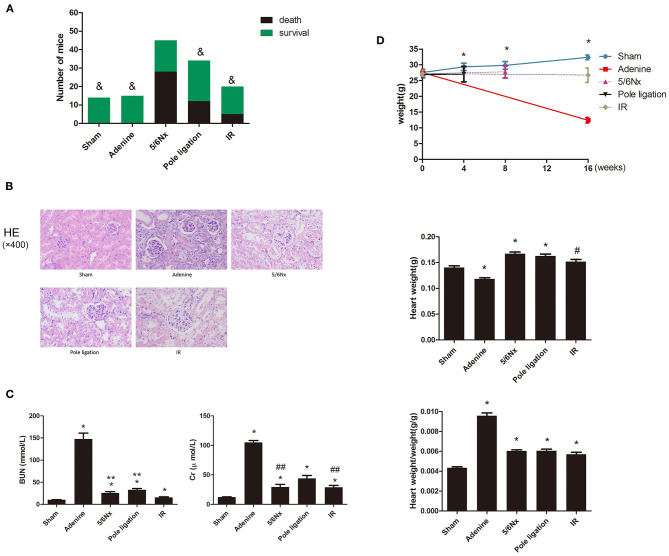
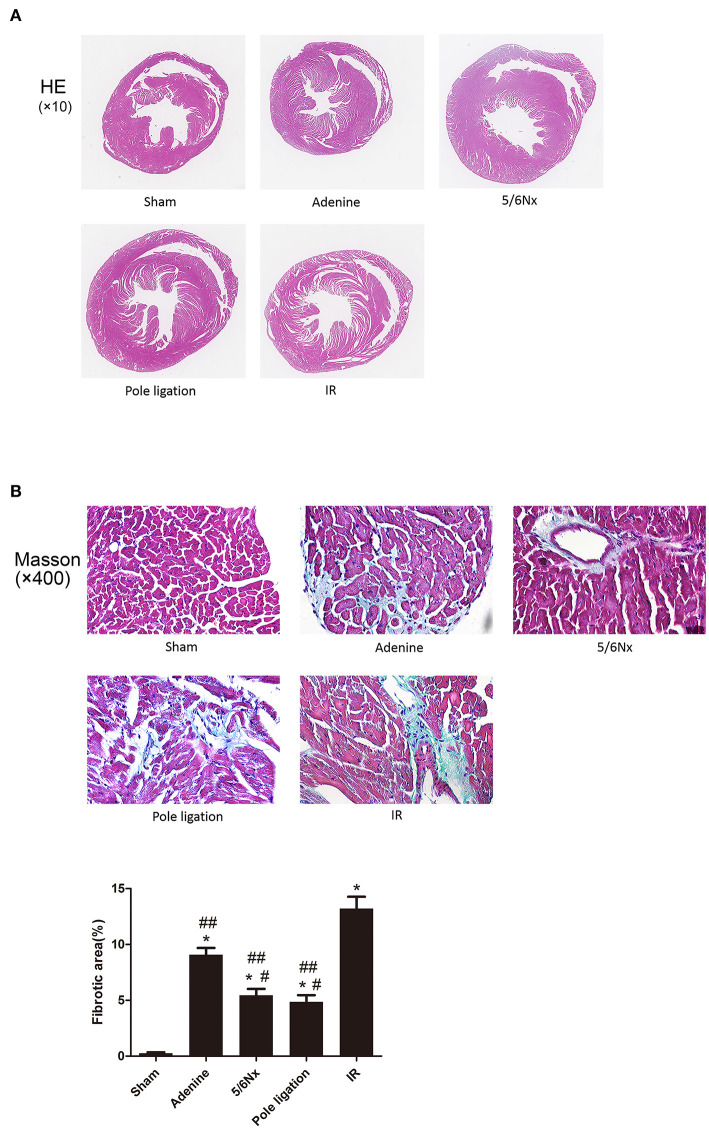
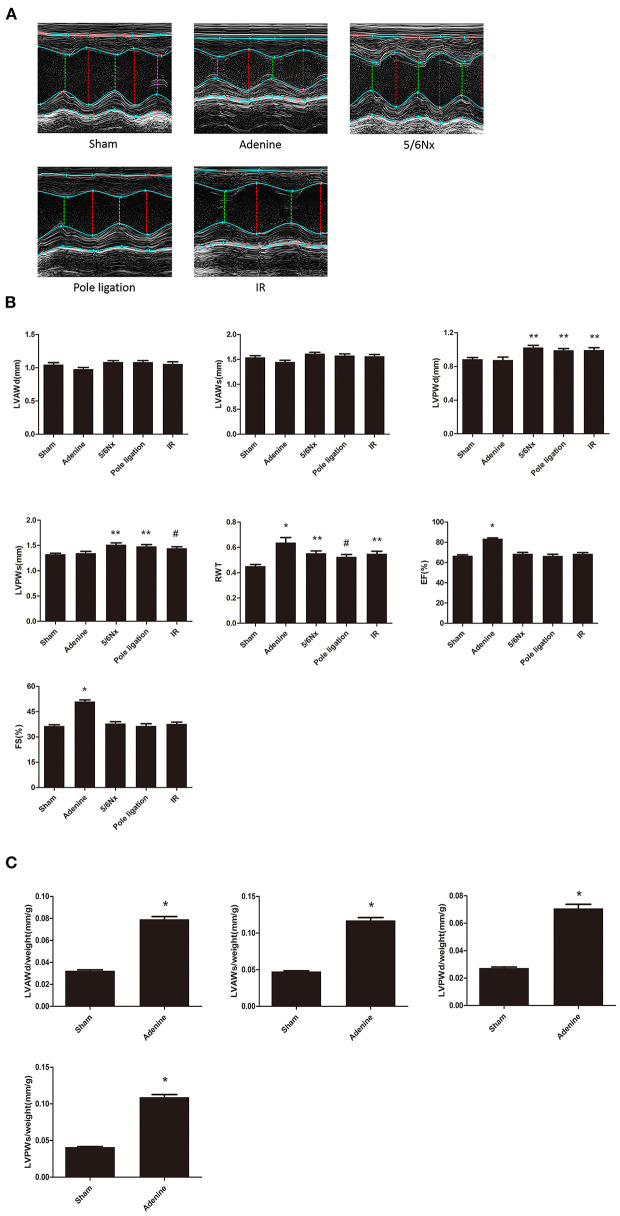
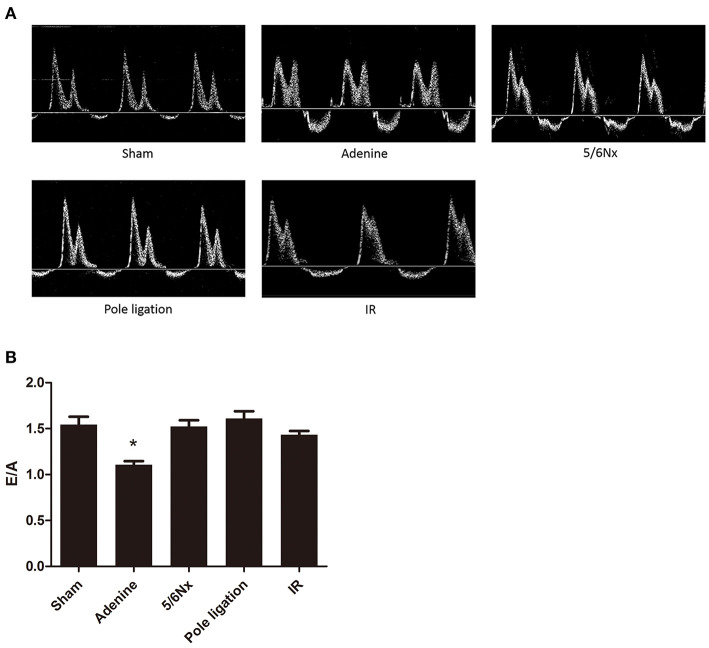
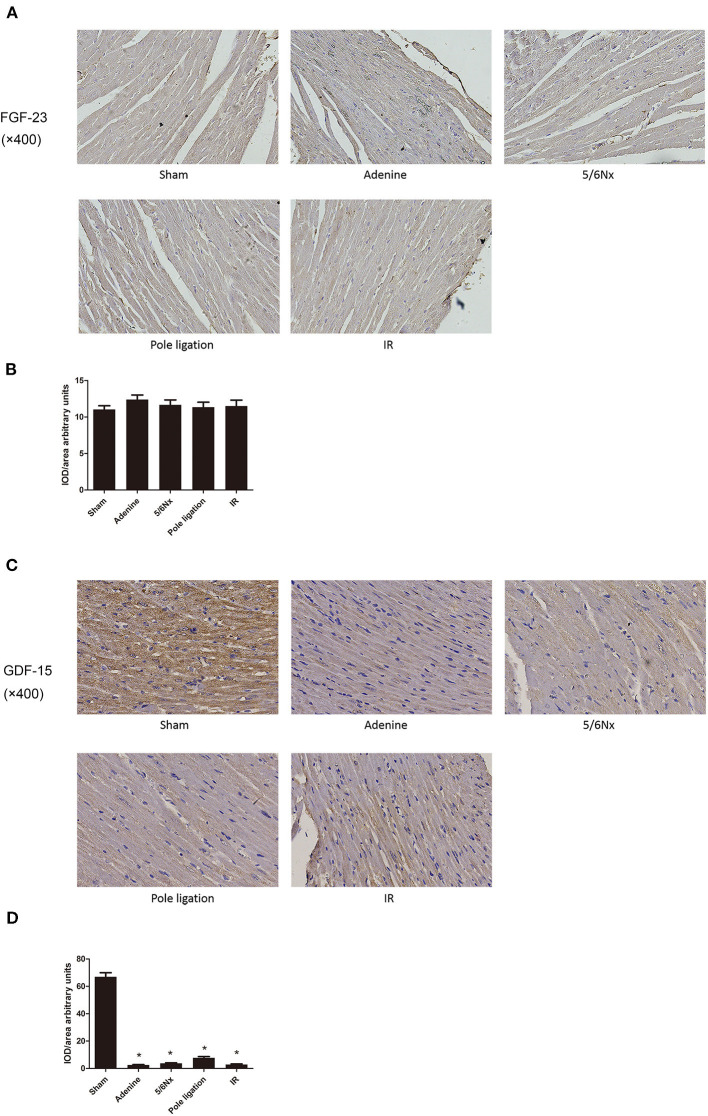
Uraemic cardiomyopathy (UCM) is one of the most common complications in chronic kidney disease (CKD). Our aim was to compare characteristics of various UCM mouse models. Mice were assigned to the following groups: the pole ligation group, 5/6 nephrectomy group (5/6Nx), uninephrectomy plus contralateral ischemia followed by reperfusion group (IR), adenine group, and sham group. Mice were sacrificed at 4, 8, and 16 weeks after surgery in the pole ligation, 5/6Nx, and IR groups, respectively. In the adenine group, mice were sacrificed at 16 weeks after the adenine diet. The structure and function of the heart and the expression of fibroblast growth factor 23 (FGF-23) and growth differentiation factor 15 (GDF-15) in hearts were assessed. The mortality in the 5/6 Nx group was significantly higher than that in the pole ligation, IR, and adenine groups. Echocardiogram and histological examination showed cardiac hypertrophy in the adenine,5/6Nx, ligation group, and IR group. In addition, cardiac fibrosis occurred in all CKD modeling groups. Interestingly, cardiac fibrosis was more serious in the IR and adenine groups. FGF-23 expression in sham mice was similar to that in modeling groups; however, the GDF-15 level was decreased in modeling groups. Our results suggest that the four models of UCM show different phenotypical features, molding time and mortality. GDF-15 expression in the hearts of UCM mice was downregulated compared with sham group mice.
Keywords: FGF-23; GDF-15; adenine; mouse models; surgical method; uraemic cardiomyopathy.
Copyright © 2021 Chen, Xie, Wu, Wu, Zhu, Mao and Xing.
Conflict of interest statement
The authors declare that the research was conducted in the absence of any commercial or financial relationships that could be construed as a potential conflict of interest.
Figures
Similar articles
-
Assessment of Thrombotic and Bleeding Tendency in Two Mouse Models of Chronic Kidney Disease: Adenine-Diet and 5/6th Nephrectomy.TH Open. 2020 Apr 16;4(2):e66-e76. doi: 10.1055/s-0040-1705138. eCollection 2020 Apr. TH Open. 2020. PMID: 32309772 Free PMC article.
-
A Mouse 5/6th Nephrectomy Model That Induces Experimental Uremic Cardiomyopathy.J Vis Exp. 2017 Nov 7;(129):55825. doi: 10.3791/55825. J Vis Exp. 2017. PMID: 29155790 Free PMC article.
-
Effect of parathyroidectomy on cardiac fibrosis and apoptosis: possible role of aldosterone.Nephron Physiol. 2006;103(3):p112-8. doi: 10.1159/000092244. Epub 2006 Mar 23. Nephron Physiol. 2006. PMID: 16557029
-
[Protective effects of Zhenwutang on cardiac function in mice with uremic cardiomyopathy induced by subtotal nephrectomy].Nan Fang Yi Ke Da Xue Xue Bao. 2015 Dec;35(12):1725-8. Nan Fang Yi Ke Da Xue Xue Bao. 2015. PMID: 26714905 Chinese.
-
Evolving concepts in the pathogenesis of uraemic cardiomyopathy.Nat Rev Nephrol. 2019 Mar;15(3):159-175. doi: 10.1038/s41581-018-0101-8. Nat Rev Nephrol. 2019. PMID: 30664681 Review.
Cited by
-
Cardiac transcriptomic changes induced by early CKD in mice reveal novel pathways involved in the pathogenesis of Cardiorenal syndrome type 4.Heliyon. 2024 Mar 8;10(6):e27468. doi: 10.1016/j.heliyon.2024.e27468. eCollection 2024 Mar 30. Heliyon. 2024. PMID: 38509984 Free PMC article.
-
Saikosaponin A protects against uremic toxin indole‑3 acetic acid‑induced damage to the myocardium.Mol Med Rep. 2023 Sep;28(3):159. doi: 10.3892/mmr.2023.13046. Epub 2023 Jul 7. Mol Med Rep. 2023. PMID: 37417356 Free PMC article.
-
The Sigma-1 Receptor Exacerbates Cardiac Dysfunction Induced by Obstructive Nephropathy: A Role for Sexual Dimorphism.Biomedicines. 2024 Aug 20;12(8):1908. doi: 10.3390/biomedicines12081908. Biomedicines. 2024. PMID: 39200372 Free PMC article.
-
Chronic Kidney Disease Induces Proarrhythmic Remodeling.Circ Arrhythm Electrophysiol. 2023 Jan;16(1):e011466. doi: 10.1161/CIRCEP.122.011466. Epub 2023 Jan 3. Circ Arrhythm Electrophysiol. 2023. PMID: 36595632 Free PMC article.
-
Cardiomyopathy in chronic kidney disease: clinical features, biomarkers and the contribution of murine models in understanding pathophysiology.Clin Kidney J. 2023 Apr 18;16(11):1786-1803. doi: 10.1093/ckj/sfad085. eCollection 2023 Nov. Clin Kidney J. 2023. PMID: 37915935 Free PMC article. Review.
References
LinkOut - more resources
Full Text Sources