. 2021 Jul 19;24(7):102713.
doi: 10.1016/j.isci.2021.102713. eCollection 2021 Jul 23.

A single cell transcriptomics map of paracrine networks in the intrinsic cardiac nervous system

Affiliations

A single cell transcriptomics map of paracrine networks in the intrinsic cardiac nervous system

Alison Moss et al. iScience. .

Abstract

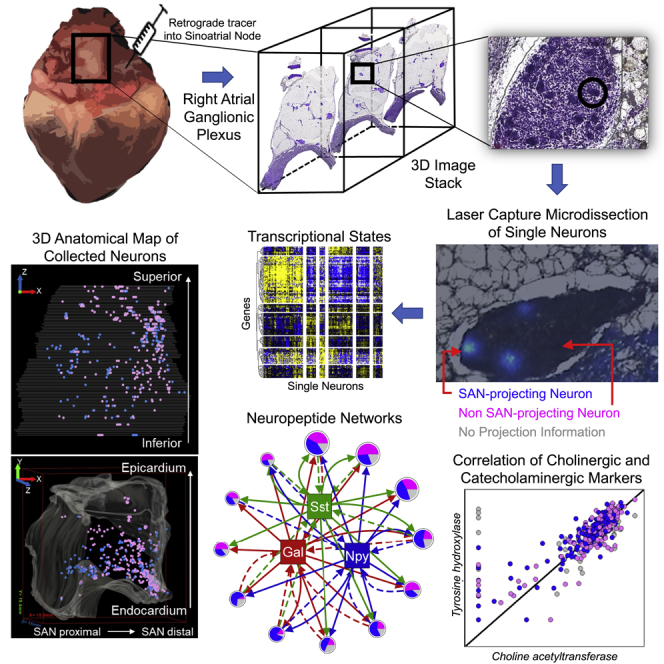
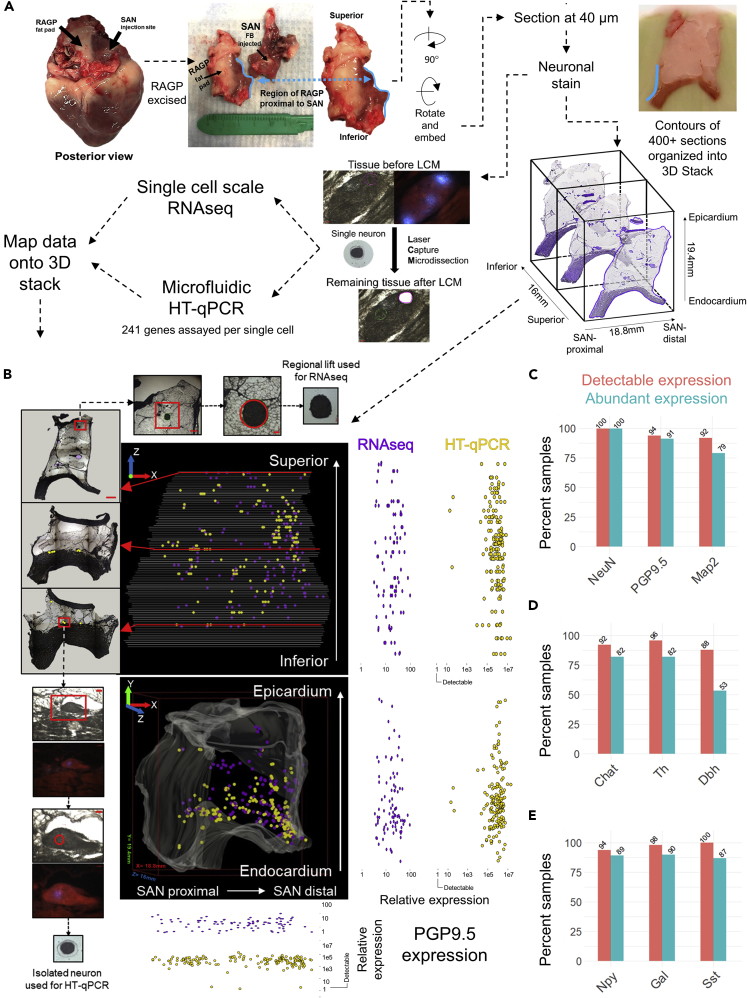
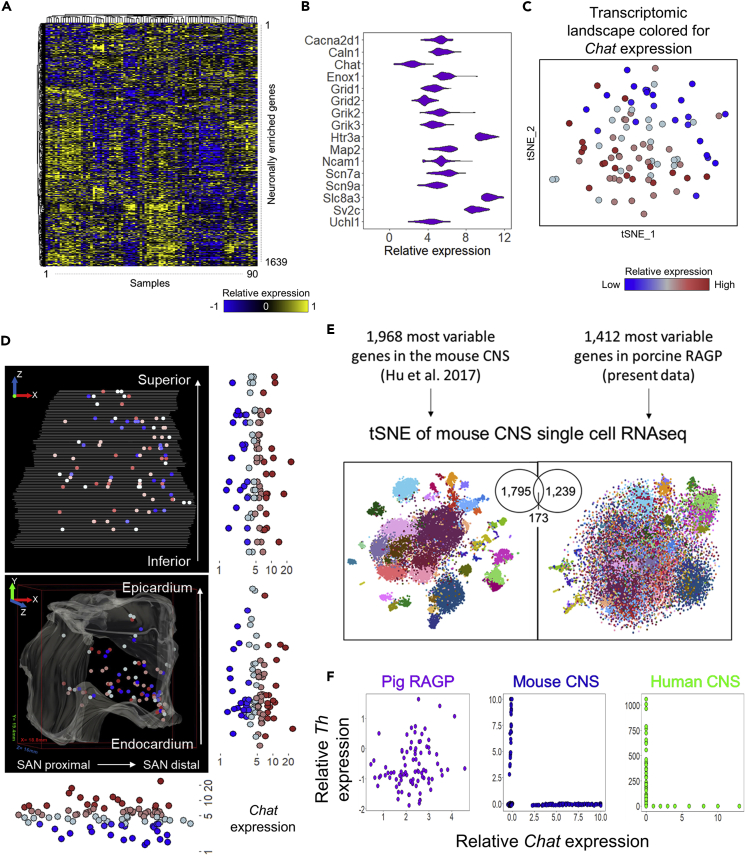
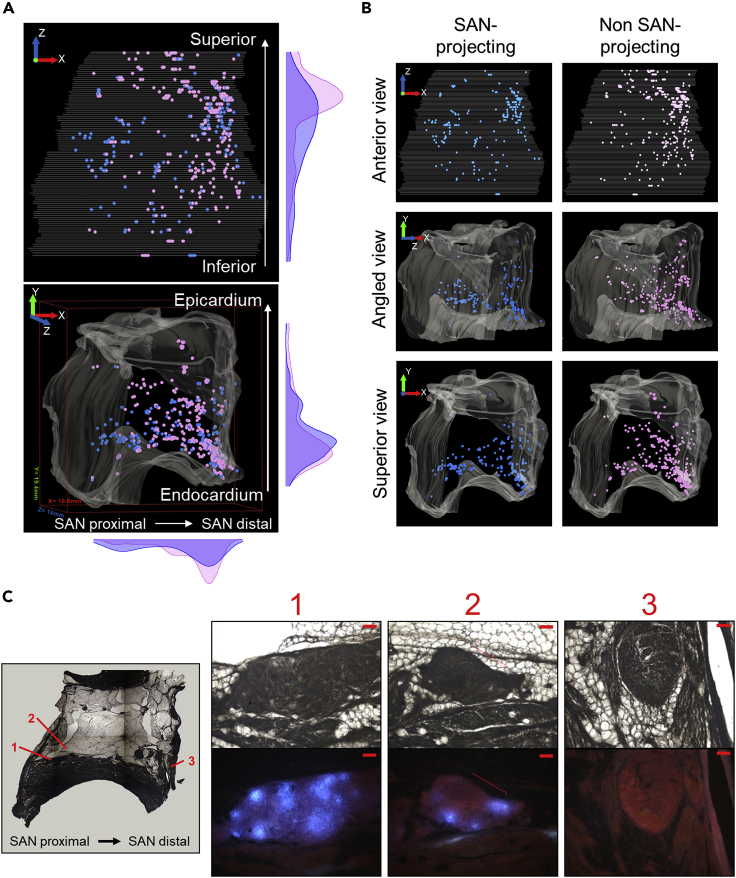
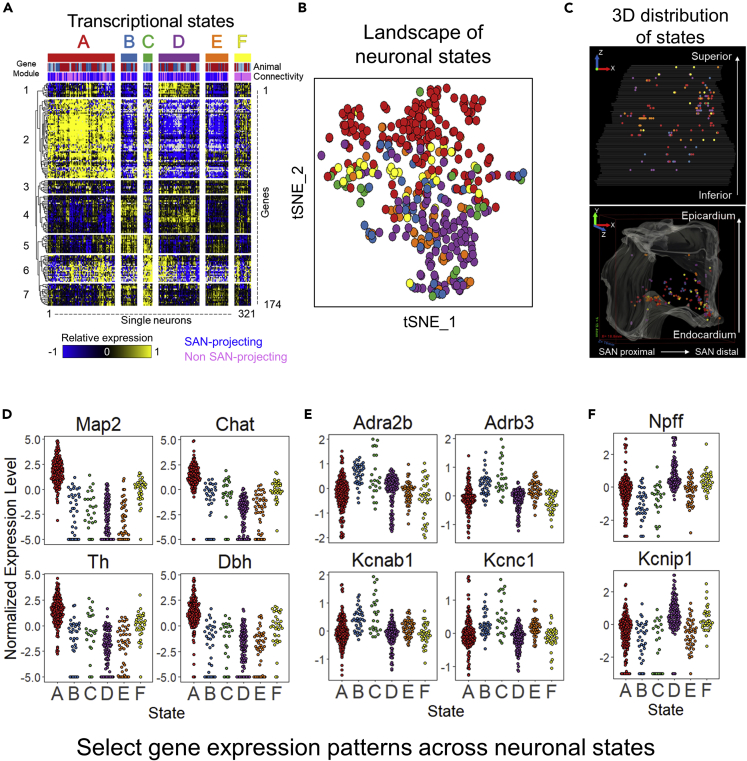
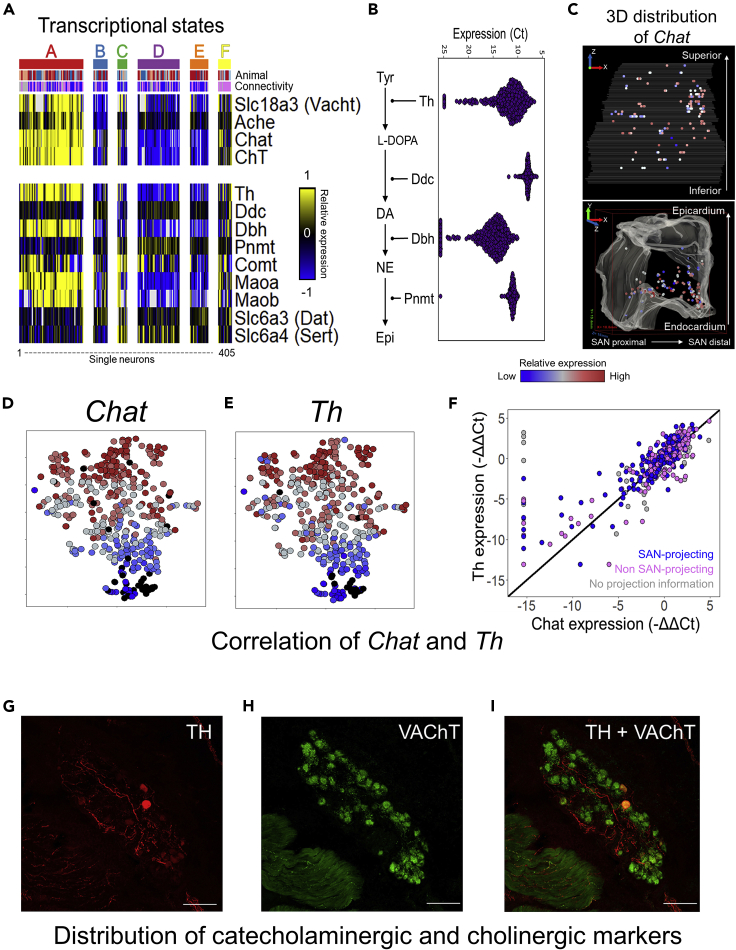
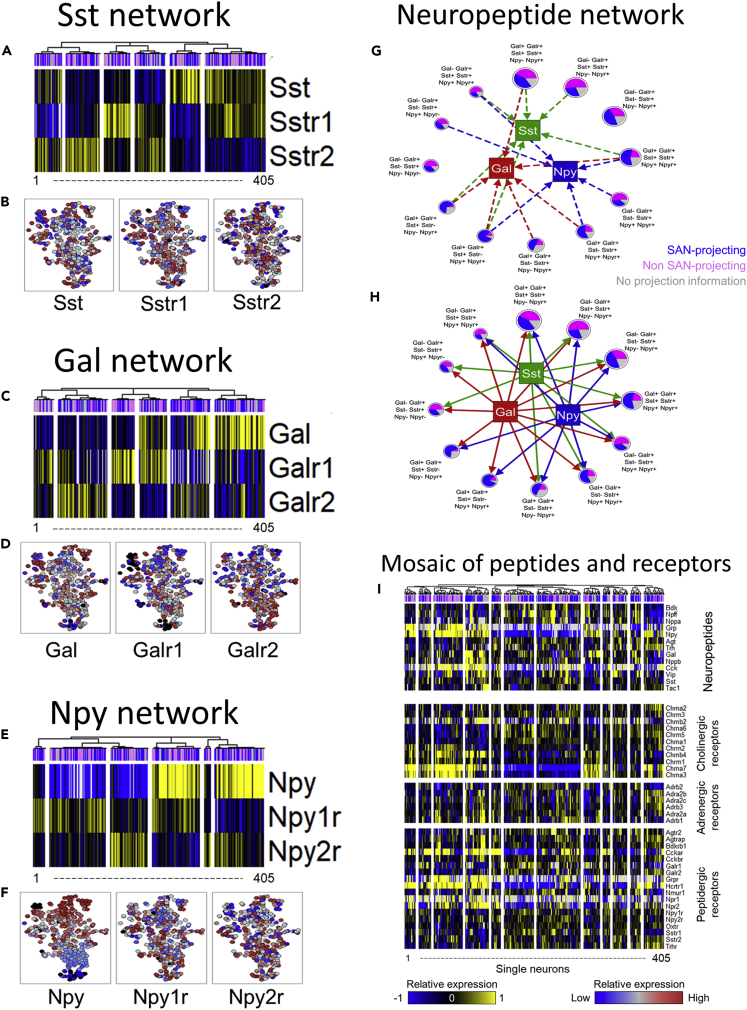
We developed a spatially-tracked single neuron transcriptomics map of an intrinsic cardiac ganglion, the right atrial ganglionic plexus (RAGP) that is a critical mediator of sinoatrial node (SAN) activity. This 3D representation of RAGP used neuronal tracing to extensively map the spatial distribution of the subset of neurons that project to the SAN. RNA-seq of laser capture microdissected neurons revealed a distinct composition of RAGP neurons compared to the central nervous system and a surprising finding that cholinergic and catecholaminergic markers are coexpressed, suggesting multipotential phenotypes that can drive neuroplasticity within RAGP. High-throughput qPCR of hundreds of laser capture microdissected single neurons confirmed these findings and revealed a high dimensionality of neuromodulatory factors that contribute to dynamic control of the heart. Neuropeptide-receptor coexpression analysis revealed a combinatorial paracrine neuromodulatory network within RAGP informing follow-on studies on the vagal control of RAGP to regulate cardiac function in health and disease.

Keywords: Cardiovascular medicine; Molecular physiology; Systems neuroscience; Transcriptomics.


Conflict of interest statement

Competing interests: University of California, Los Angeles has patents developed by KS and JLA relating to cardiac neural diagnostics and therapeutics. KS and JLA are co-founders of NeuCures, Inc. All the remaining authors declare no competing interests.

Figures

None
Graphical abstract
Figure 1
Figure 1
Mapping spatially-tracked single-cell transcriptomics onto an imaging-based 3D tissue reconstruction of pig right atrial ganglionic plexus (RAGP) (A) Integrated workflow starting from injection of neuronal tracer into the sinoatrial node (SAN) region of the pig heart, followed by isolation, embedding, and cryosectioning of the RAGP, acquisition of block face images for 3D reconstruction, staining for neuronal localization within the tissue, and obtaining spatially-tracked single neuron samples via laser capture microdissection (LCM) for downstream processing using RNA-seq and high-throughput real-time PCR (HT-qPCR), yielding transcriptomic data that is mapped onto a 3D anatomical framework. Scale bars: 50 μm. (B) Representative visualization of the 3D anatomical framework of an RAGP depicting the location of spatially-tracked single neurons sampled via LCM (purple dots - neuronal samples for RNA-seq; yellow dots - neuronal samples for HT-qPCR). The cross-sections of the stack show the corresponding tissue sections from which the neuronal samples were obtained. Scale bars: whole tissue sections, 500 μm; regional lift zoom 1, 500 μm; regional lift zoom 2, 100 μm; isolated neuron zoom 1, 100 μm; isolated neuron zoom 2, 50 μm. The relative expression of PGP9.5 in these spatially-tracked neuronal samples is shown with reference to the axes of the 3D stack. The bounding box on the lower panel shows 18.8 mm, 19.4 mm, and 16 mm on the x, y, and z axis, respectively. (C–E) Proportion of samples that showed detectable and abundant expression of select pan-neuronal markers (C), cholinergic and catecholaminergic markers (D), and neuropeptides (E), as assessed by HT-qPCR. Data shown is based on combining 405 single neuron samples across n = 4 animals.
Figure 2
Figure 2
Transcriptomic landscape of pig RAGP from a single-cell scale RNAseq analysis (A) Expression of 1,882 neuronally-enriched genes in 90 spatially-tracked neuronal clusters in RAGP based on single-cell scale RNA-seq profiling of laser capture microdissected samples. The genes included in the heatmap were selected by analyzing the GTEx database for those enriched in the neuronal tissues compared to other tissue types. Of the genes identified as neuronally enriched in the GTEx database, 1,639 genes were present in the RAGP neurons. (B) Distribution of select abundantly expressed neuronal genes. (C) Transcriptomic landscape as delineated by tSNE indicating the gradient of Chat throughout a distributed cloud. (D) Visualization within the 3D anatomical framework for a representative RAGP. The relative expression of choline acetyltransferase (Chat) in these spatially-tracked neuronal samples is shown with reference to the axes of the 3D stack. The bounding box on the lower panel shows 18.8 mm, 19.4 mm, and 16 mm on the x, y, and z axis, respectively. (E) A comparison of the distribution of CNS neuronal types based on the most-variable genes in mouse CNS (Hu et al., 2017) versus in pig RAGP (present data). The tSNE plots are colored based on 40 distinguishable mouse CNS neuronal states described in Hu et al. (2017). (F) Scatterplots comparing the expression of Th vs Chat in the pig RAGP (present data), mouse CNS (Hu et al., 2017), and human CNS (Human Multiple Cortical Areas SMART-seq, 2019) (https://portal.brain-map.org/atlases-and-data/rnaseq/human-multiple-cortical-areas-smart-seq).
Figure 3
Figure 3
Broad RAGP anatomy of SAN-projecting and non SAN-projecting neurons (A) Visualization within the 3D anatomical framework of both SAN-projecting (blue) and non SAN-projecting (purple) neurons that were comprehensively identified in select sections of a representative RAGP. Panels along the right side and bottom show density plots representing the density of projecting and non-projecting neurons along each axis. The bounding box on the lower panel shows 18.8 mm, 19.4 mm, and 16 mm on the x, y, and z axis, respectively. (B) Anterior (top), angled (middle) and superior (bottom) views of a representative RAGP showing only the SAN-projecting neurons (left) or non SAN-projecting neurons (right). The X, Y, Z measurements are consistent with those in panel (A). (C) A select section of the RAGP (7,040 μm from the superior aspect) zooming in on three different neuron clusters showing a high percentage of neurons within the cluster projecting to the SAN toward the SAN-proximal side of the RAGP (1), a cluster with no SAN-projecting neurons toward the SAN-distal side of the RAGP (3) and a cluster with a mix of both projecting and non-projecting neurons in between (2). Scale bars: 100 μm. Tissue measured 18.8 mm from left to right (xaxis) and 19.4 mm top to bottom (yaxis). For an animated visualization see Video S1.
Figure 4
Figure 4
Landscape of neuronal transcriptional states in the pig RAGP (A) Expression of 174 genes, each assayed in 321 single neurons (n = 3 animals) through HT-qPCR, yielding six transcriptional states using a combination of clustering and template matching analysis. A majority of the states consisted of both SAN-projecting and non SAN-projecting neurons. Sample annotations at the top of the heatmap indicate whether the single neurons were SAN-projecting or non SAN-projecting and indicate the distribution across animals. A complete heatmap with 405 neurons from all 4 RAGP is shown in Figure S3. (B) Landscape of neuronal transcriptional states visualized as a tSNE plot. Colors correspond to the states shown in panel (A). (C) Visualization of the neuronal states within the 3D anatomical framework for a representative RAGP. The bounding box on the lower panel shows 18.8 mm, 19.4 mm, and 16 mm on the x, y, and z axis, respectively. (D–F) Expression distribution of select genes with enrichment in specific transcriptional states: (D) state (A)Map2, Chat, Th, Dbh; (E) states B and CAdrab2b, Adrb3, Kcnab1, Kcnc1; and (F) states D and FNpff and Kcnip1. Enrichment assessed by a one-way ANOVA and post hoc Tukey Honest Significant Difference test pvalue < 0.01.
Figure 5
Figure 5
Correlated cholinergic and catecholaminergic gene expression in RAGP neurons (A) Transcriptional state-wise gene expression of the components of acetylcholine and catecholamine biosynthesis and transport processes, across 405 single neurons assayed through HT-qPCR in RAGP. (B) Beeswarm plot showing the abundance and the range of expression of key genes involved in catecholamine biosynthesis across 405 single RAGP neurons from n = 4 animals. (C) Visualization of Chat gene expression within the 3D anatomical framework for a representative RAGP. The bounding box on the lower panel shows 18.8 mm, 19.4 mm, and 16 mm on the x, y, and z axis, respectively. (D and E) The distributions of Chat and Th gene expression overlap within the transcriptional landscape as visualized in the tSNE plots. (F) Correlated gene expression of Chat and Th across single neurons in RAGP (R2 = 0.69, pvalue < 2.2 × 10−16). The pairwise comparison of gene expression levels is shown for SAN-projecting and non SAN-projecting neurons (n = 4 animals). The points marked gray correspond to RAGP neurons without information on SAN projection, as these were microdissected from a pig heart without a tracer injection into the SAN region. (G–I) Confocal images showing a cluster of neurons within RAGP double stained for TH (G) and VAChT (H). Colocalization of TH and VAChT in a subset of neurons (I).
Figure 6
Figure 6
Neuropeptidergic interaction networks in the pig RAGP (A,C, and E) Expression patterns of somatostatin (A), galanin (C), and neuropeptide Y (E) and their cognate receptors across 405 single RAGP neurons (n = 4 animals) assayed through HT-qPCR. (B,D, and F) The transcriptional landscape across all RAGP colored for expression of the neuropeptides and their cognate receptors. (G,H) Interaction networks of neuronal subtypes defined based on the combinatorial pattern of neuropeptides and their receptor expression. (G) The interaction network subset corresponding to the neuronal subtypes producing the neuropeptides somatostatin (Sst), galanin (Gal), and neuropeptide Y (Npy). The circular nodes denote the neuronal subtypes.The size of the node is proportional to the number of single neurons belonging to each subtype. The pie chart within each circular node indicates the proportion of the neurons within that subtype that are identified as projecting to the SAN region. The arrows from the circular nodes denoting the neuronal subtypes connect to the square-shaped nodes denoting the three neuropeptides, based on which subtypes show the corresponding neuropeptide gene expression above a specified threshold. The color of the arrows matches the color of the corresponding target square-shaped node. (H) The interaction network subset corresponding to the neuropeptide receptor expression across the neuronal subtypes. The notation of circular and square-shaped nodes is the same as in pane (G). The arrows connect each neuropeptide to the neuronal subtypes based on which subtypes express any the corresponding neuropeptide receptors above a specified threshold. The color of the arrows corresponds to the color of the neuropeptide node. (I) Combinatorial pattern of expression of a wide range of neuropeptides and receptors of neurotransmitters across single neurons in RAGP (n = 4 animals).

References

    1. Achanta S., Gorky J., Leung C., Moss A., Robbins S., Eisenman L., Chen J., Tappan S., Heal M., Farahani N. A comprehensive integrated anatomical and molecular atlas of rat intrinsic cardiac nervous system. iScience. 2020;23:101140. doi: 10.1016/j.isci.2020.101140. - DOI - PMC - PubMed
    1. Ardell J.L., Rajendran P.S., Nier H.A., KenKnight B.H., Armour J.A. Central-peripheral neural network interactions evoked by vagus nerve stimulation: functional consequences on control of cardiac function. Am. J. Physiol. Heart Circ. Physiol. 2015;309:H1740–H1752. doi: 10.1152/ajpheart.00557.2015. - DOI - PMC - PubMed
    1. Armour J.A. Potential clinical relevance of the “little brain” on the mammalian heart. Exp. Physiol. 2008;93:165–176. doi: 10.1113/expphysiol.2007.041178. - DOI - PubMed
    1. Bacher R., Chu L.-F., Leng N., Gasch A.P., Thomson J.A., Stewart R.M., Newton M., Kendziorski C. SCnorm: robust normalization of single-cell RNA-seq data. Nat. Methods. 2017;14:584–586. doi: 10.1038/nmeth.4263. - DOI - PMC - PubMed
    1. Beal M.F., Martin J.B. Neuropeptides in neurological disease. Ann. Neurol. 1986;20:547–565. doi: 10.1002/ana.410200502. - DOI - PubMed