

Different evolutionary pathways of HIV-1 between fetus and mother perinatal transmission pairs indicate unique immune selection in fetuses
- PMID: 34337555
- PMCID: PMC8324465
- DOI: 10.1016/j.xcrm.2021.100315
Different evolutionary pathways of HIV-1 between fetus and mother perinatal transmission pairs indicate unique immune selection in fetuses
Abstract
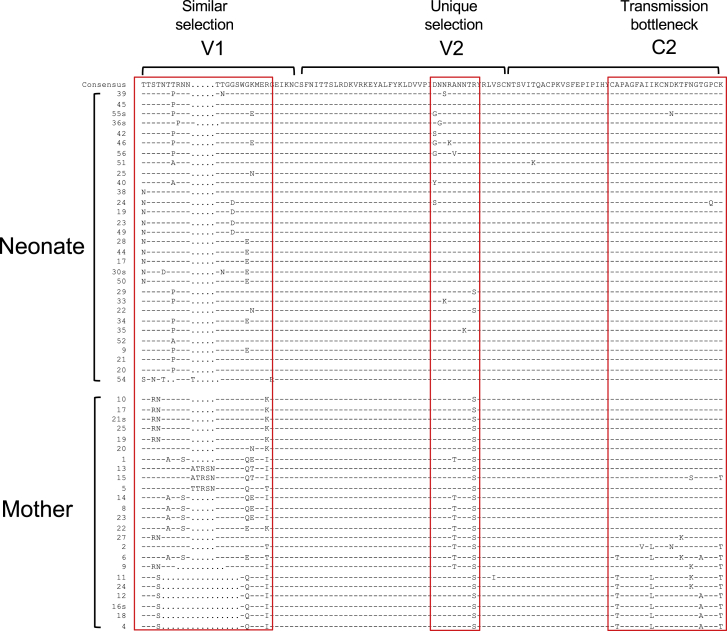
Study of evolution and selection pressure on HIV-1 in fetuses will lead to a better understanding of the role of immune responses in shaping virus evolution and vertical transmission. Detailed genetic analyses of HIV-1 env gene from 12 in utero transmission pairs show that most infections (67%) occur within 2 months of childbirth. In addition, the env sequences from long-term-infected fetuses are highly divergent and form separate phylogenetic lineages from their cognate maternal viruses. Host-selection sites unique to neonate viruses are identified in regions frequently targeted by neutralizing antibodies and T cell immune responses. Identification of unique selection sites in the env gene of fetal viruses indicates that the immune system in fetuses is capable of exerting selection pressure on viral evolution. Studying selection and evolution of HIV-1 or other viruses in fetuses can be an alternative approach to investigate adaptive immunity in fetuses.
Keywords: HIV-1; fetus; immune selection; in utero transmission; mother to child transmission; neonate; signature.
© 2021 The Authors.
Conflict of interest statement
The authors declare no competing interests.
Figures


Similar articles
-
Mutations that confer resistance to broadly-neutralizing antibodies define HIV-1 variants of transmitting mothers from that of non-transmitting mothers.PLoS Pathog. 2021 Apr 2;17(4):e1009478. doi: 10.1371/journal.ppat.1009478. eCollection 2021 Apr. PLoS Pathog. 2021. PMID: 33798244 Free PMC article.
-
Restricted genetic diversity of HIV-1 subtype C envelope glycoprotein from perinatally infected Zambian infants.PLoS One. 2010 Feb 18;5(2):e9294. doi: 10.1371/journal.pone.0009294. PLoS One. 2010. PMID: 20174636 Free PMC article.
-
Diversity of the human immunodeficiency virus type 1 (HIV-1) env sequence after vertical transmission in mother-child pairs infected with HIV-1 subtype A.J Virol. 2003 Mar;77(5):3050-7. doi: 10.1128/jvi.77.5.3050-3057.2003. J Virol. 2003. PMID: 12584330 Free PMC article.
-
Adaptive evolution in perinatal HIV-1.Best Pract Res Clin Obstet Gynaecol. 2005 Apr;19(2):211-29. doi: 10.1016/j.bpobgyn.2004.10.004. Epub 2005 Jan 5. Best Pract Res Clin Obstet Gynaecol. 2005. PMID: 15778111 Review.
-
Update: transmission of HIV-1 from mother to child.Curr Opin Obstet Gynecol. 1997 Dec;9(6):343-8. Curr Opin Obstet Gynecol. 1997. PMID: 9425574 Review.
Cited by
-
Optimal sequence-based design for multi-antigen HIV-1 vaccines using minimally distant antigens.PLoS Comput Biol. 2022 Oct 31;18(10):e1010624. doi: 10.1371/journal.pcbi.1010624. eCollection 2022 Oct. PLoS Comput Biol. 2022. PMID: 36315492 Free PMC article.
-
Higher HIV-1 evolutionary rate is associated with cytotoxic T lymphocyte escape mutations in infants.J Virol. 2024 Jul 23;98(7):e0007224. doi: 10.1128/jvi.00072-24. Epub 2024 May 30. J Virol. 2024. PMID: 38814066 Free PMC article.
-
Research on Maternal Vaccination for HIV Prevention.Clin Perinatol. 2024 Dec;51(4):769-782. doi: 10.1016/j.clp.2024.08.007. Epub 2024 Sep 11. Clin Perinatol. 2024. PMID: 39487019 Review.
References
-
- UNAIDS Global HIV & AIDS statistics — 2020 fact sheet. https://www.unaids.org/en/resources/fact-sheet.
-
- Wolinsky S.M., Wike C.M., Korber B.T., Hutto C., Parks W.P., Rosenblum L.L., Kunstman K.J., Furtado M.R., Muñoz J.L. Selective transmission of human immunodeficiency virus type-1 variants from mothers to infants. Science. 1992;255:1134–1137. - PubMed
-
- Mahy M., Stover J., Kiragu K., Hayashi C., Akwara P., Luo C., Stanecki K., Ekpini R., Shaffer N. What will it take to achieve virtual elimination of mother-to-child transmission of HIV? An assessment of current progress and future needs. Sex. Transm. Infect. 2010;86(Suppl 2):ii48–ii55. - PMC - PubMed
-
- Dorenbaum A., Cunningham C.K., Gelber R.D., Culnane M., Mofenson L., Britto P., Rekacewicz C., Newell M.L., Delfraissy J.F., Cunningham-Schrader B., International PACTG 316 Team Two-dose intrapartum/newborn nevirapine and standard antiretroviral therapy to reduce perinatal HIV transmission: a randomized trial. JAMA. 2002;288:189–198. - PubMed
-
- Bailey H., Zash R., Rasi V., Thorne C. HIV treatment in pregnancy. Lancet HIV. 2018;5:e457–e467. - PubMed
Publication types
MeSH terms
Substances
Grants and funding
LinkOut - more resources
Full Text Sources
Molecular Biology Databases
