. 2021 Sep;33(37):e2008111.
doi: 10.1002/adma.202008111. Epub 2021 Aug 1.

Engineering the Dynamics of Cell Adhesion Cues in Supramolecular Hydrogels for Facile Control over Cell Encapsulation and Behavior

Affiliations

Engineering the Dynamics of Cell Adhesion Cues in Supramolecular Hydrogels for Facile Control over Cell Encapsulation and Behavior

Mani Diba et al. Adv Mater. 2021 Sep.

Abstract

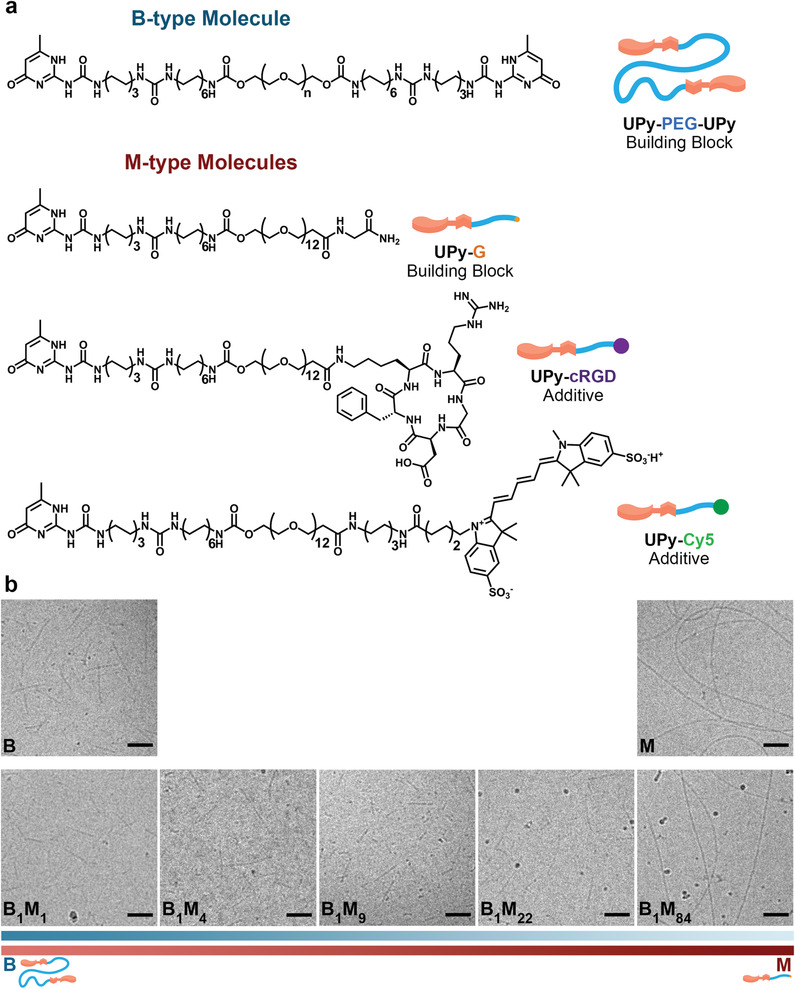
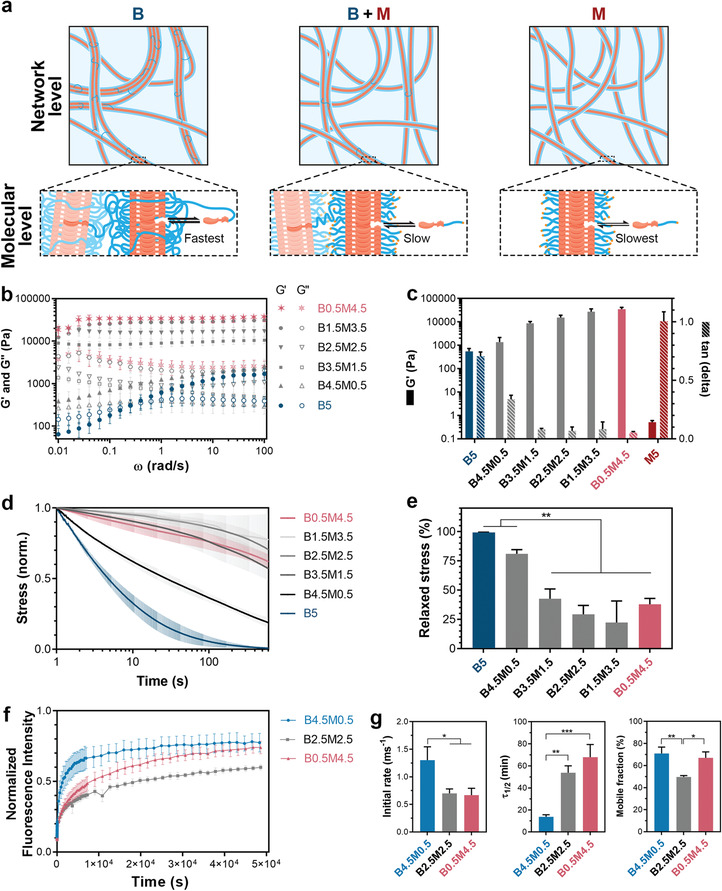
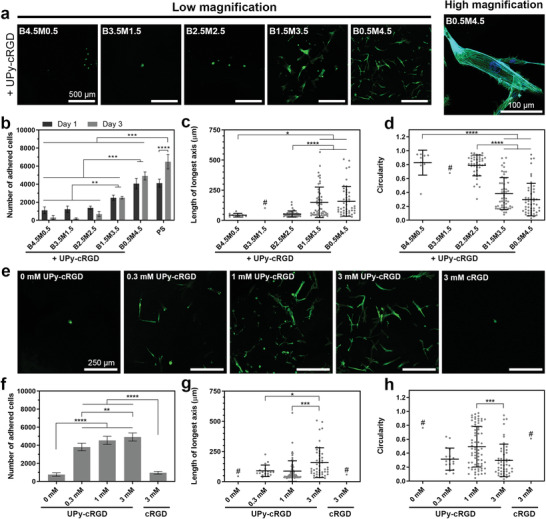
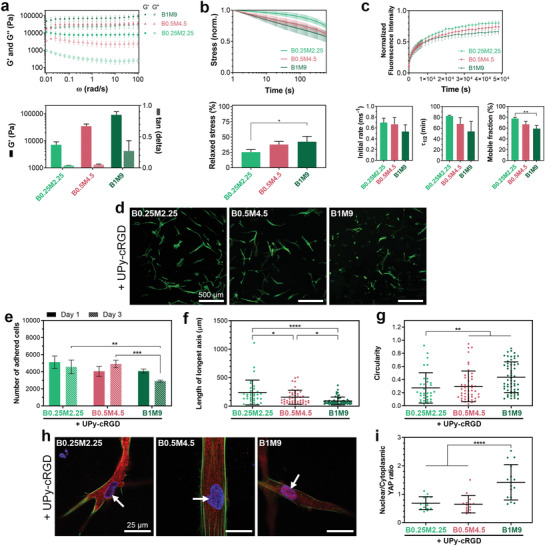
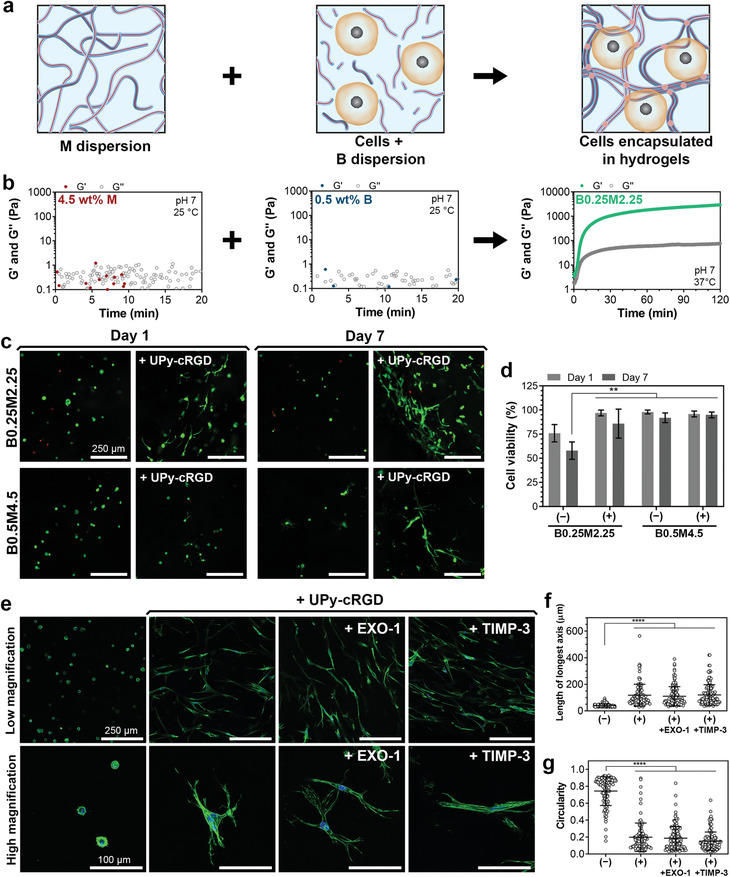
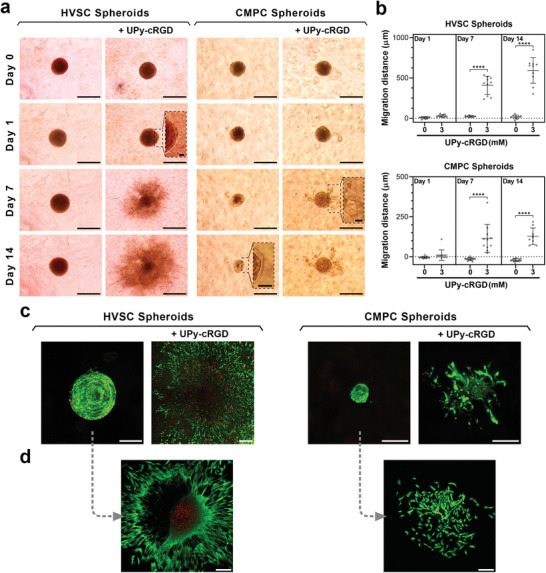
The extracellular matrix (ECM) forms through hierarchical assembly of small and larger polymeric molecules into a transient, hydrogel-like fibrous network that provides mechanical support and biochemical cues to cells. Synthetic, fibrous supramolecular networks formed via non-covalent assembly of various molecules are therefore potential candidates as synthetic mimics of the natural ECM, provided that functionalization with biochemical cues is effective. Here, combinations of slow and fast exchanging molecules that self-assemble into supramolecular fibers are employed to form transient hydrogel networks with tunable dynamic behavior. Obtained results prove that modulating the ratio between these molecules dictates the extent of dynamic behavior of the hydrogels at both the molecular and the network level, which is proposed to enable effective incorporation of cell-adhesive functionalities in these materials. Excitingly, the dynamic nature of the supramolecular components in this system can be conveniently employed to formulate multicomponent supramolecular hydrogels for easy culturing and encapsulation of single cells, spheroids, and organoids. Importantly, these findings highlight the significance of molecular design and exchange dynamics for the application of supramolecular hydrogels as synthetic ECM mimics.

Keywords: cell encapsulation; dynamic hydrogels; molecular exchange dynamics; supramolecular biomaterials; synthetic extracellular matrix.


Conflict of interest statement

The authors would like to disclose a submitted patent application related to the supramolecular hydrogels reported in this manuscript. International Patent Application filed with the European Patent Office on July 13, 2020 by the Eindhoven University of Technology (Priority date: July 12, 2019), with PCT Application No. PCT/EP2020/069787. Inventors: M.D., S.S., and P.Y.W.D.

Figures

Figure 1
Figure 1
Supramolecular building blocks and their self‐assembly into fibers. a) Molecular structures of bivalent (B)‐type and monovalent (M)‐type molecules as the supramolecular building blocks and additives. For UPy‐PEG‐UPy, n is on average 226 (M n = 10 kDa). b) Representative Cryo‐TEM images showing the morphology of fibers assembled from B‐type and M‐type molecules at different molar ratios. The ureido‐pyrimidinone (UPy)‐based molecules self‐assemble into fibers (of multiple stacks) at physiological pH and temperature, through dimerization via quadruple hydrogen bonds, and lateral stacking induced by flanking urea moieties forming a hydrophobic pocket shielded from the water. Scale bars = 100 nm.
Figure 2
Figure 2
Hydrogels formulated from different ratios of supramolecular building blocks. a) Schematic illustration of different supramolecular formulations at network and molecular levels. Blue linkages between fibers at network level indicate interfiber cross‐links formed by B‐type molecules, and labels of black arrows at molecular level indicate the rate of molecular exchange dynamics for different formulations. b) Frequency dependence of storage (G′) and loss (G″) moduli of different compositions of supramolecular hydrogels. c) G′ and damping factor (tan(delta)) values of hydrogels measured at 1 rad s−1 and 1% strain. d) Stress relaxation behavior of supramolecular hydrogels measured by subjecting the hydrogels to 1% strain. e) Quantification of stress relaxation in hydrogels after 10 min. f) Fluorescence recovery after photo‐bleaching (FRAP) tests performed on hydrogels containing 20 µm of UPy‐Cy5 supramolecular additives. g) Quantified FRAP results showing the rate of fluorescence recovery during the first 60 s after photo‐bleaching (Initial rate), the timespan during which the Cy5 fluorescence intensity recovers to half its mobile fraction (τ1/2), and the fraction of fluorescence intensity that recovers when fluorescence intensity curves reach plateau values (Mobile fraction). b–g) All hydrogels contained a total polymer content of 5 wt%, and all measurements were performed at 37 °C. All data are shown for n = 3 independent tests per group, and as mean ± s.d. e,g) *, p < 0.05; **, p < 0.01; ***, p ≤ 0.001; one‐way analysis of variance (ANOVA) followed by Bonferroni post hoc.
Figure 3
Figure 3
Cell adhesion and spreading on hydrogels with different compositions. a) Representative images of HVSCs after 1 day of culture on different supramolecular hydrogel compositions. b) Number of cells adhered onto hydrogel surfaces after 1 and 3 days of culture. PS indicates polystyrene control. c) Length of longest axis and d) circularity of cells after 1 day of culture on supramolecular hydrogels with different compositions. a–d) Hydrogels contained 3 mm of UPy‐cRGD additives. e) Representative images of HVSCs after 1 day of culture and f) number, g) length of longest axis, h) and circularity of cells adhered after 1 (g,h) or 3 (f) days of culture on B0.5M4.5 supramolecular hydrogels containing different concentrations of UPy‐cRGD or cRGD additives. a,e) Green and blue colors in images indicate actin and nucleus staining, respectively. b–d,f–h) *, p < 0.05; **, p < 0.01; ***, p ≤ 0.001; ****, p ≤ 0.0001; two‐way (b) or one‐way (c,d,f–h) analysis of variance (ANOVA) followed by Bonferroni post hoc. All results were obtained from three to four biologically independent experiments per group, and all values are shown as mean ± s.d. # indicates the groups for which the number of cells present was insufficient for statistically relevant comparison. c,d,g,h) Data points represent features of individual cells, with n comprising the total number of cells per group that were detectable/analyzed among three experiments.
Figure 4
Figure 4
Concentration‐dependent behavior of hydrogels. a) Frequency dependence of viscoelastic behavior, and quantified storage moduli (G′) and tan(delta) values (at 1 rad s−1 and 1% strain) of hydrogels with different total polymer concentrations and a fixed M/B ratio. b) Stress relaxation behavior of supramolecular hydrogels measured by subjecting the hydrogels to 1% strain. c) Fluorescence recovery after photo‐bleaching (FRAP) tests performed on hydrogels containing 20 µm of UPy‐Cy5 additives. Quantified results show the rate of fluorescence recovery during the first 60 s after photo‐bleaching (Initial rate), the timespan during which the fluorescence intensity recovers to half its mobile fraction (τ1/2), and the fraction of fluorescence intensity that recovers when fluorescence intensity curves reach plateau values (Mobile fraction). a–c) All measurements were performed at 37 °C. d) Representative images of HVSCs after 1 day of culture on hydrogels with different polymer concentrations. Green color in images indicates actin staining. e) Number of cells adhered onto hydrogel surfaces after 1 and 3 days of culture. f) Length of longest axis and g) circularity of cells after 1 day of culture on supramolecular hydrogels. h) Representative images of HVSCs upon immunofluorescence staining for nucleus (blue), actin (green), and YAP (red) after 1 day of culture on hydrogels with different polymer concentrations. Arrows indicate the nuclei. i) Quantification of the nuclear/cytoplasmic ratio of the YAP concentration in cells after 1 day of culture. d–i) Hydrogels contained 3 mm of UPy‐cRGD additives. b,c,e,f,g,i) *, p < 0.05; **, p < 0.01; ***, p ≤ 0.001; ****, p ≤ 0.0001; one‐way (b,c,f,g,i) or two‐way (e) analysis of variance (ANOVA) followed by Bonferroni post hoc. All results were obtained from three to four independent experiments per group, and all values are shown as mean ± s.d. f,g,i) Data points represent features of individual cells, with n comprising the total number of cells per group that were detectable/analyzed among three experiments.
Figure 5
Figure 5
Cell encapsulation and spreading in supramolecular hydrogels. a) Schematic illustration of cell encapsulation in hydrogels via mixing of pre‐assembled supramolecular fibers. b) Representative viscoelastic properties of dispersions of 4.5 wt% M or 0.5 wt% B supramolecular fibers and their mixture measured over time. c) Representative images of HVSCs encapsulated within supramolecular hydrogels without or with 3 mm of UPy‐cRGD additives, after live (green color) and dead (red color) staining. d) Quantification of viability of cells encapsulated in the hydrogels without (−) or with (+) 3 mm of UPy‐cRGD additives, as shown in (c). e) Representative images of HVSCs encapsulated in supramolecular hydrogels of B0.25M2.25 composition without or with 3 mm of UPy‐cRGD additives after 3 days of culture. During the culture period, additional EXO‐1 (120 nm) or TIMP‐3 (5 nm) treatments are carried out to block exocytosis and protein remodeling, respectively. Green and blue colors in images indicate actin and nucleus staining, respectively. f) Length of longest axis and g) circularity of cells after 3 days of culture in supramolecular hydrogels without (−) or with (+) 3 mm of UPy‐cRGD additives, as shown in (e). d) **, p < 0.01; two‐way analysis of variance (ANOVA) followed by Bonferroni post hoc. f,g) ****, p ≤ 0.0001; one‐way ANOVA followed by Bonferroni post hoc. All biological results were obtained from three independent experiments per group, and their values are shown as mean ± s.d. f,g) Data points represent features of individual cells, with n comprising the total number of cells per group that were detectable/analyzed among three experiments.
Figure 6
Figure 6
Multicellular spheroids encapsulated in supramolecular hydrogels. a) Representative images of HVSC and CMPC spheroids encapsulated in supramolecular hydrogels without or with 3 mm of UPy‐cRGD additives. Scale bars = 500 µm (main images of HVSC spheroids), 250 µm (main images of CMPC spheroids), and 50 µm (insets). b) Quantification of migration distance of cells from the initial surface of spheroids into hydrogel matrices. ****, p ≤ 0.0001; one‐way analysis of variance (ANOVA) followed by Bonferroni post hoc. Results were obtained from four biologically independent experiments per group, and the values are shown as mean ± s.d. Data points represent cell migration distance from initial spheroid surface, with n comprising the total number of spheroids per group that were detectable/analyzed among four experiments. c) Representative images of HVSC and CMPC spheroids after 14 days of culture in supramolecular hydrogels without or with 3 mm of UPy‐cRGD additives. d) Representative images of HVSC and CMPC cells after 2 days of culture of spheroids extracted from hydrogels without UPy‐cRGD. c,d) Green and red colors indicate live and dead cells, respectively; Scale bars = 200 µm. a–d) All hydrogels were of B0.25M2.25 composition.

References

    1. Burla F., Mulla Y., Vos B. E., Aufderhorst‐Roberts A., Koenderink G. H., Nat. Rev. Phys. 2019, 1, 249.
    1. Frantz C., Stewart K. M., Weaver V. M., J. Cell Sci. 2010, 123, 4195. - PMC - PubMed
    1. Discher D. E., Mooney D. J., Zandstra P. W., Science 2009, 324, 1673. - PMC - PubMed
    1. Tibbitt M. W., Anseth K. S., Biotechnol. Bioeng. 2009, 103, 655. - PMC - PubMed
    1. Cruz‐Acuña R., Quirós M., Farkas A. E., Dedhia P. H., Huang S., Siuda D., García‐Hernández V., Miller A. J., Spence J. R., Nusrat A., García A. J., Nat. Cell Biol. 2017, 19, 1326. - PMC - PubMed

LinkOut - more resources