. 2021 Dec;89(12):1787-1799.
doi: 10.1002/prot.26199. Epub 2021 Aug 31.

Assessment of the CASP14 assembly predictions

Affiliations

Assessment of the CASP14 assembly predictions

Burcu Ozden et al. Proteins. 2021 Dec.

Abstract

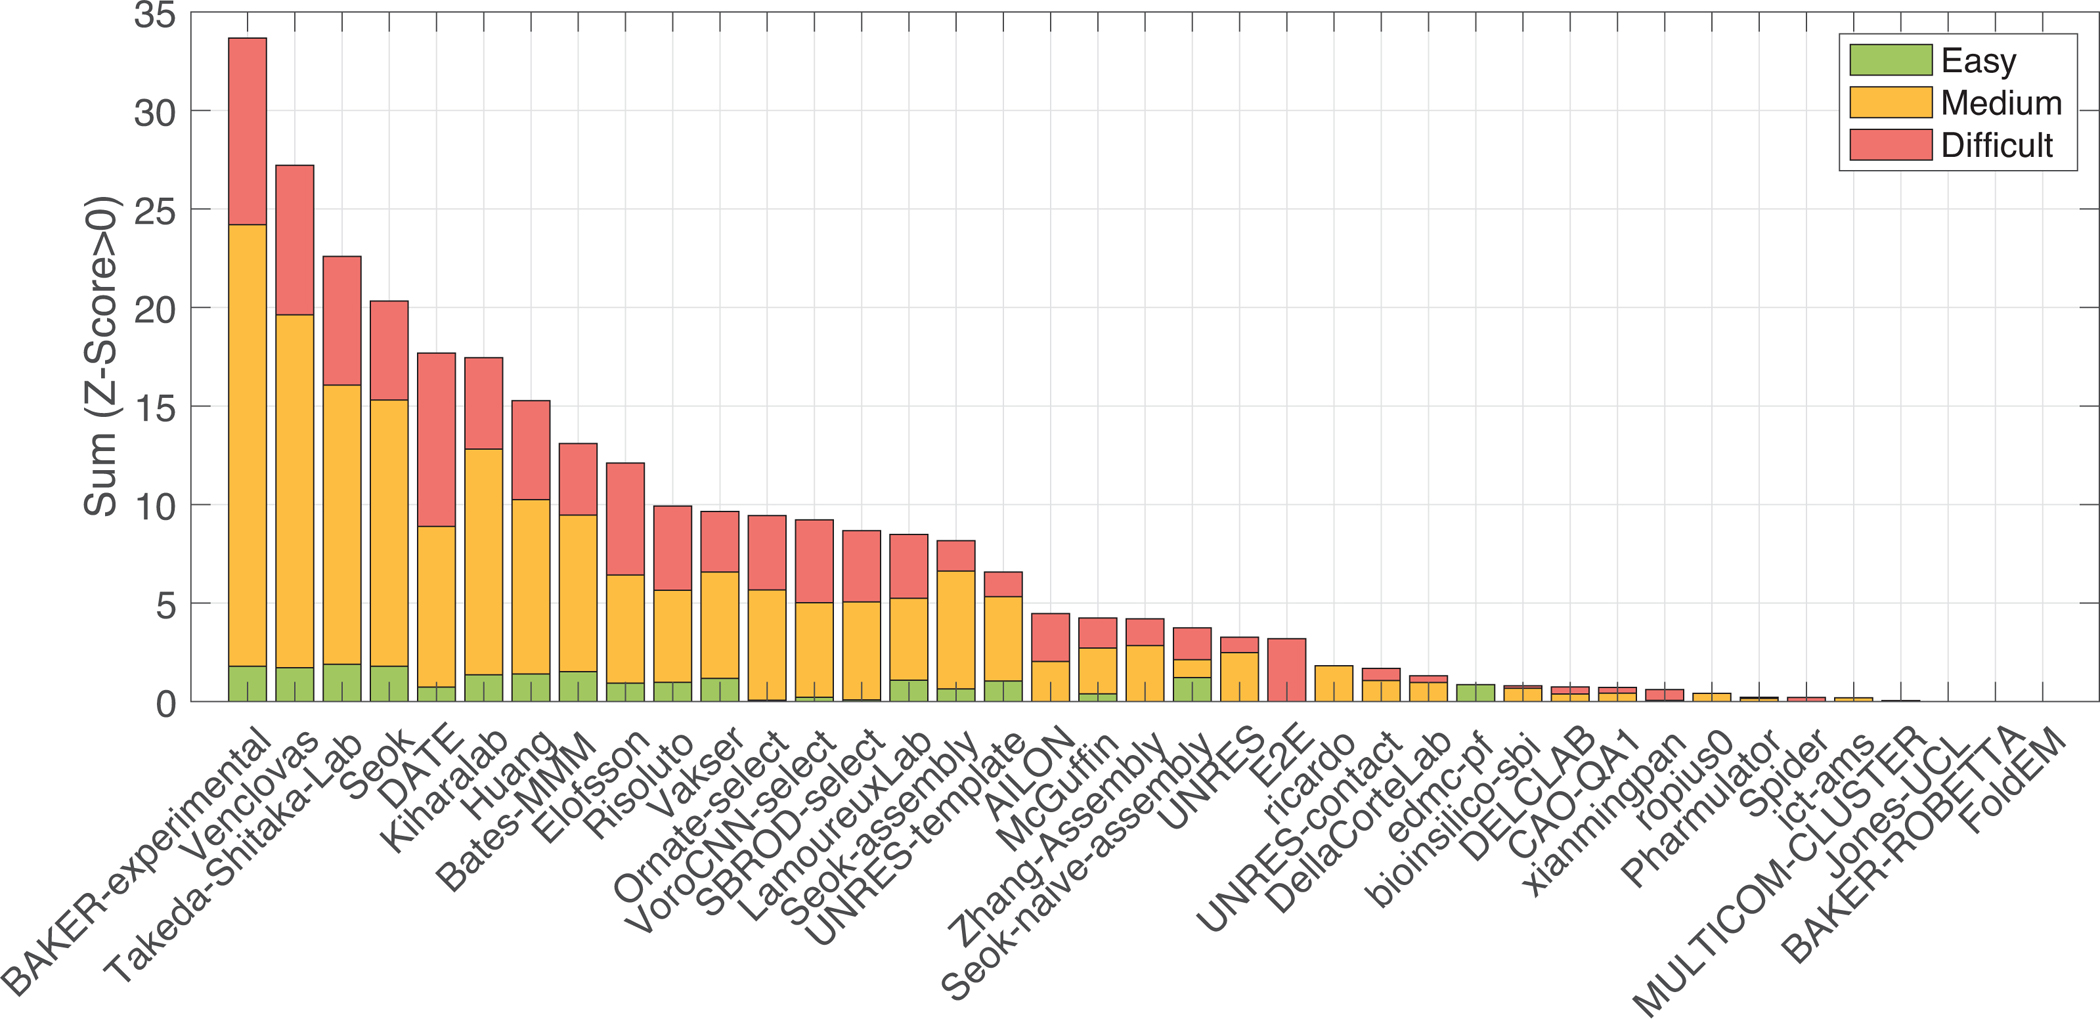
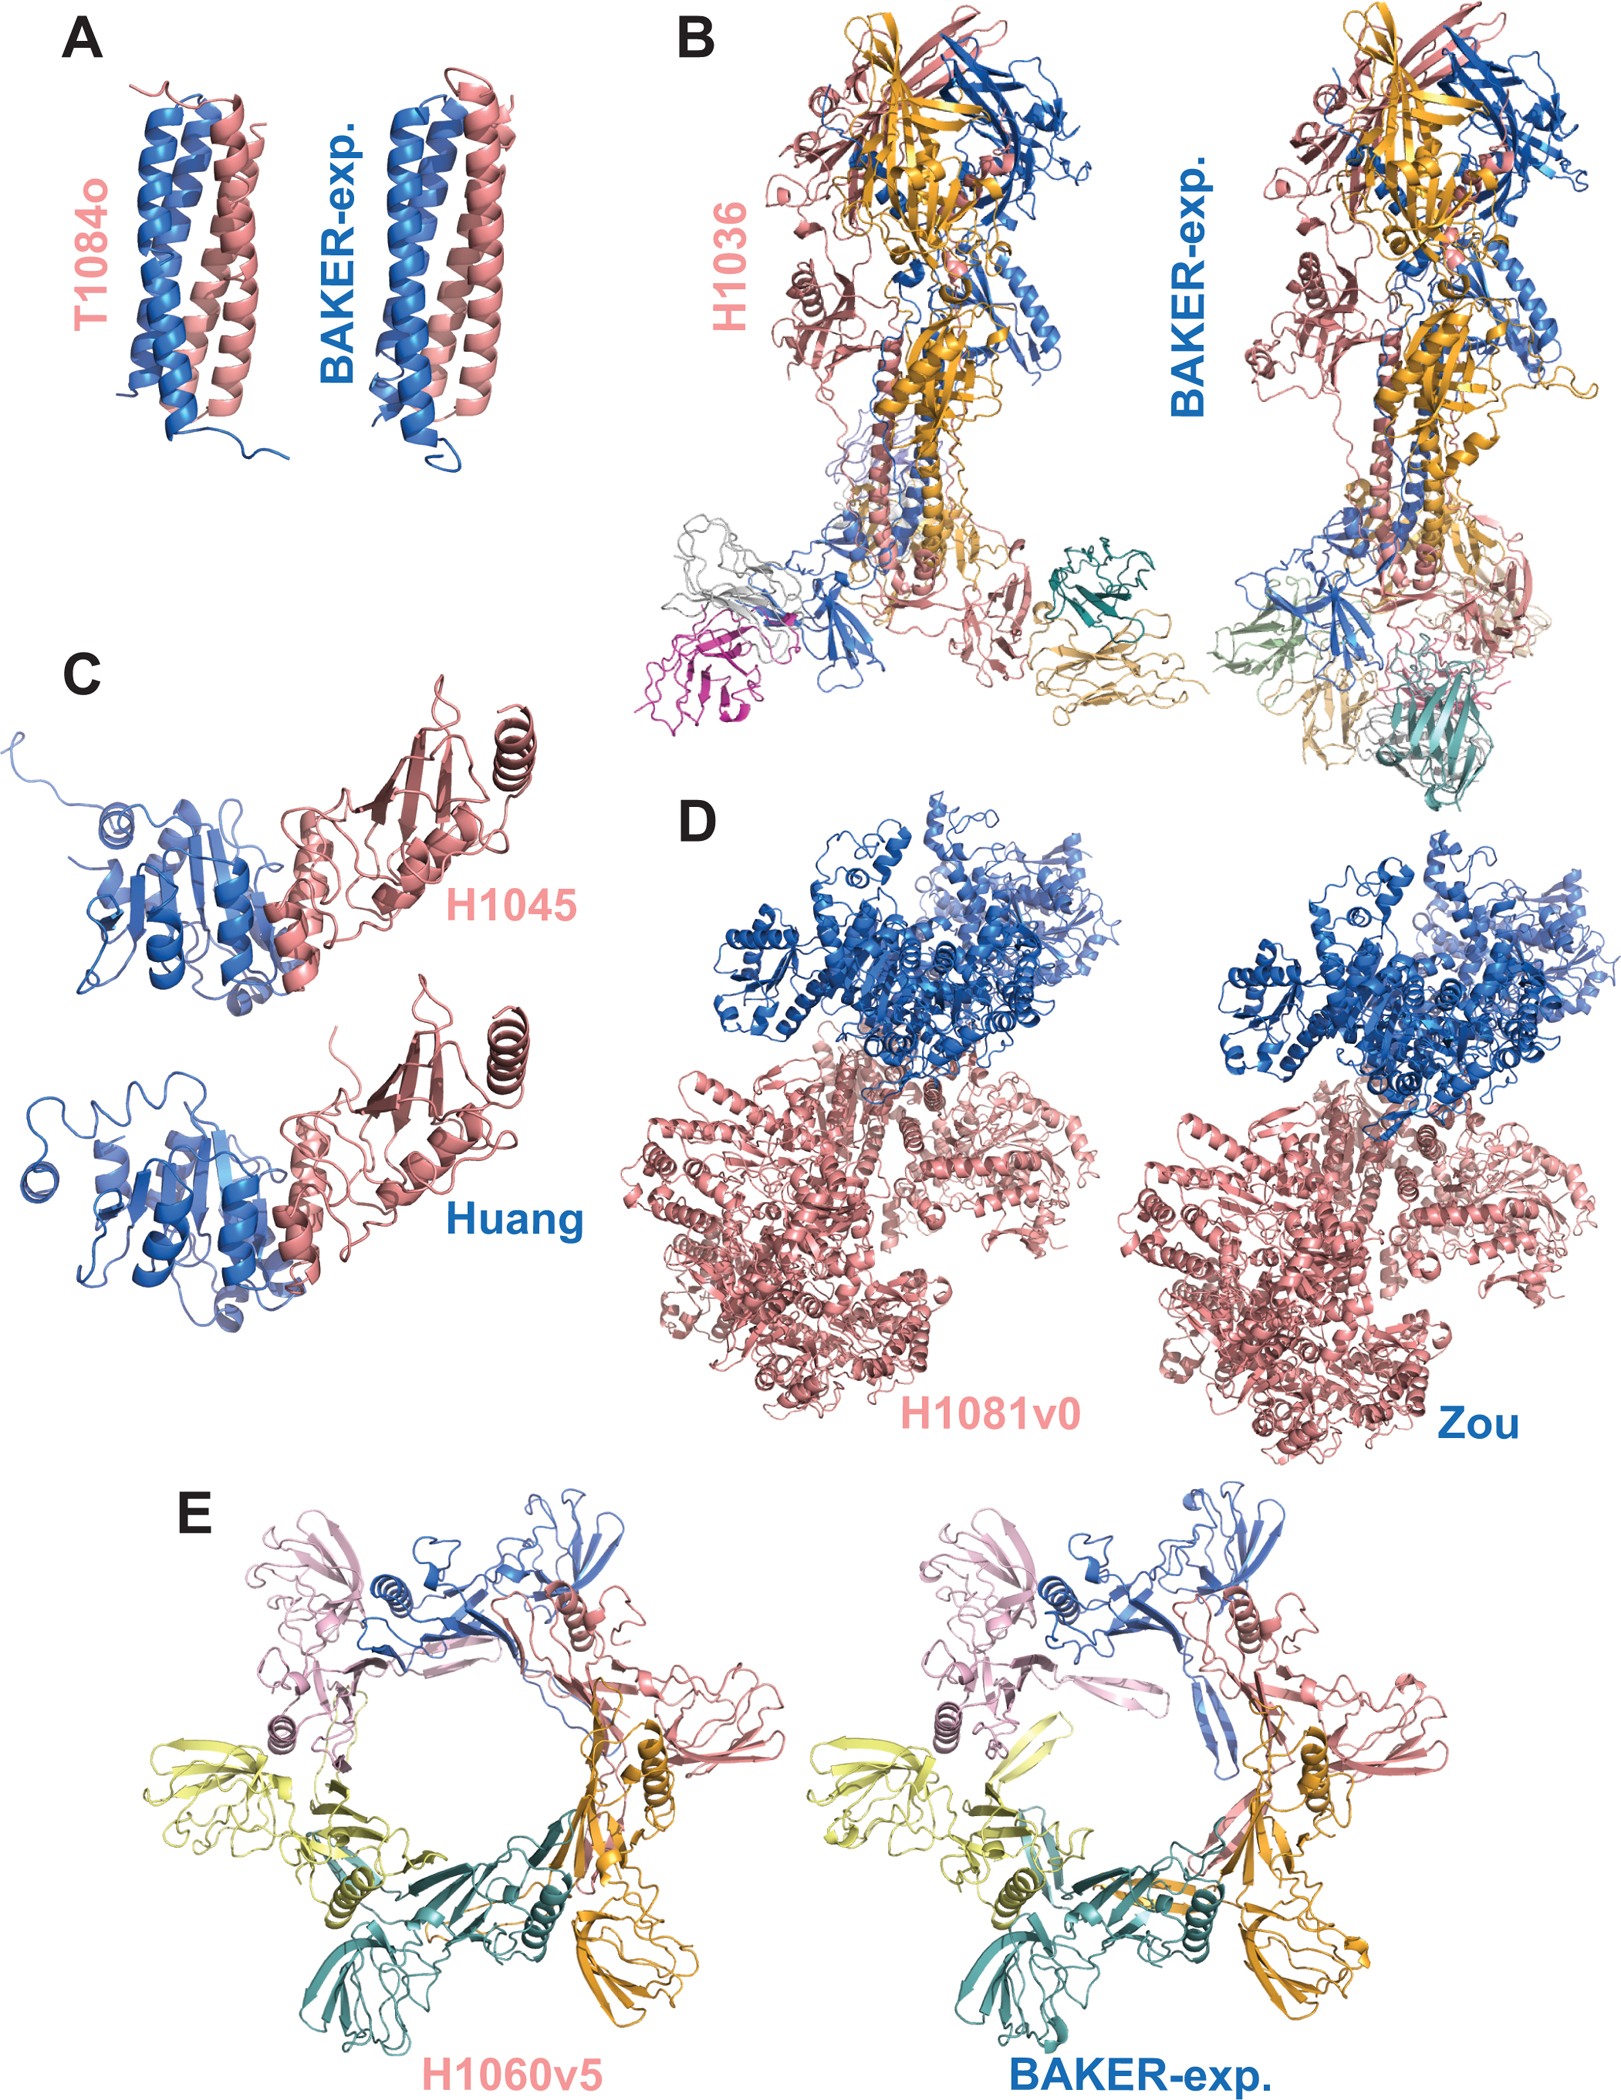
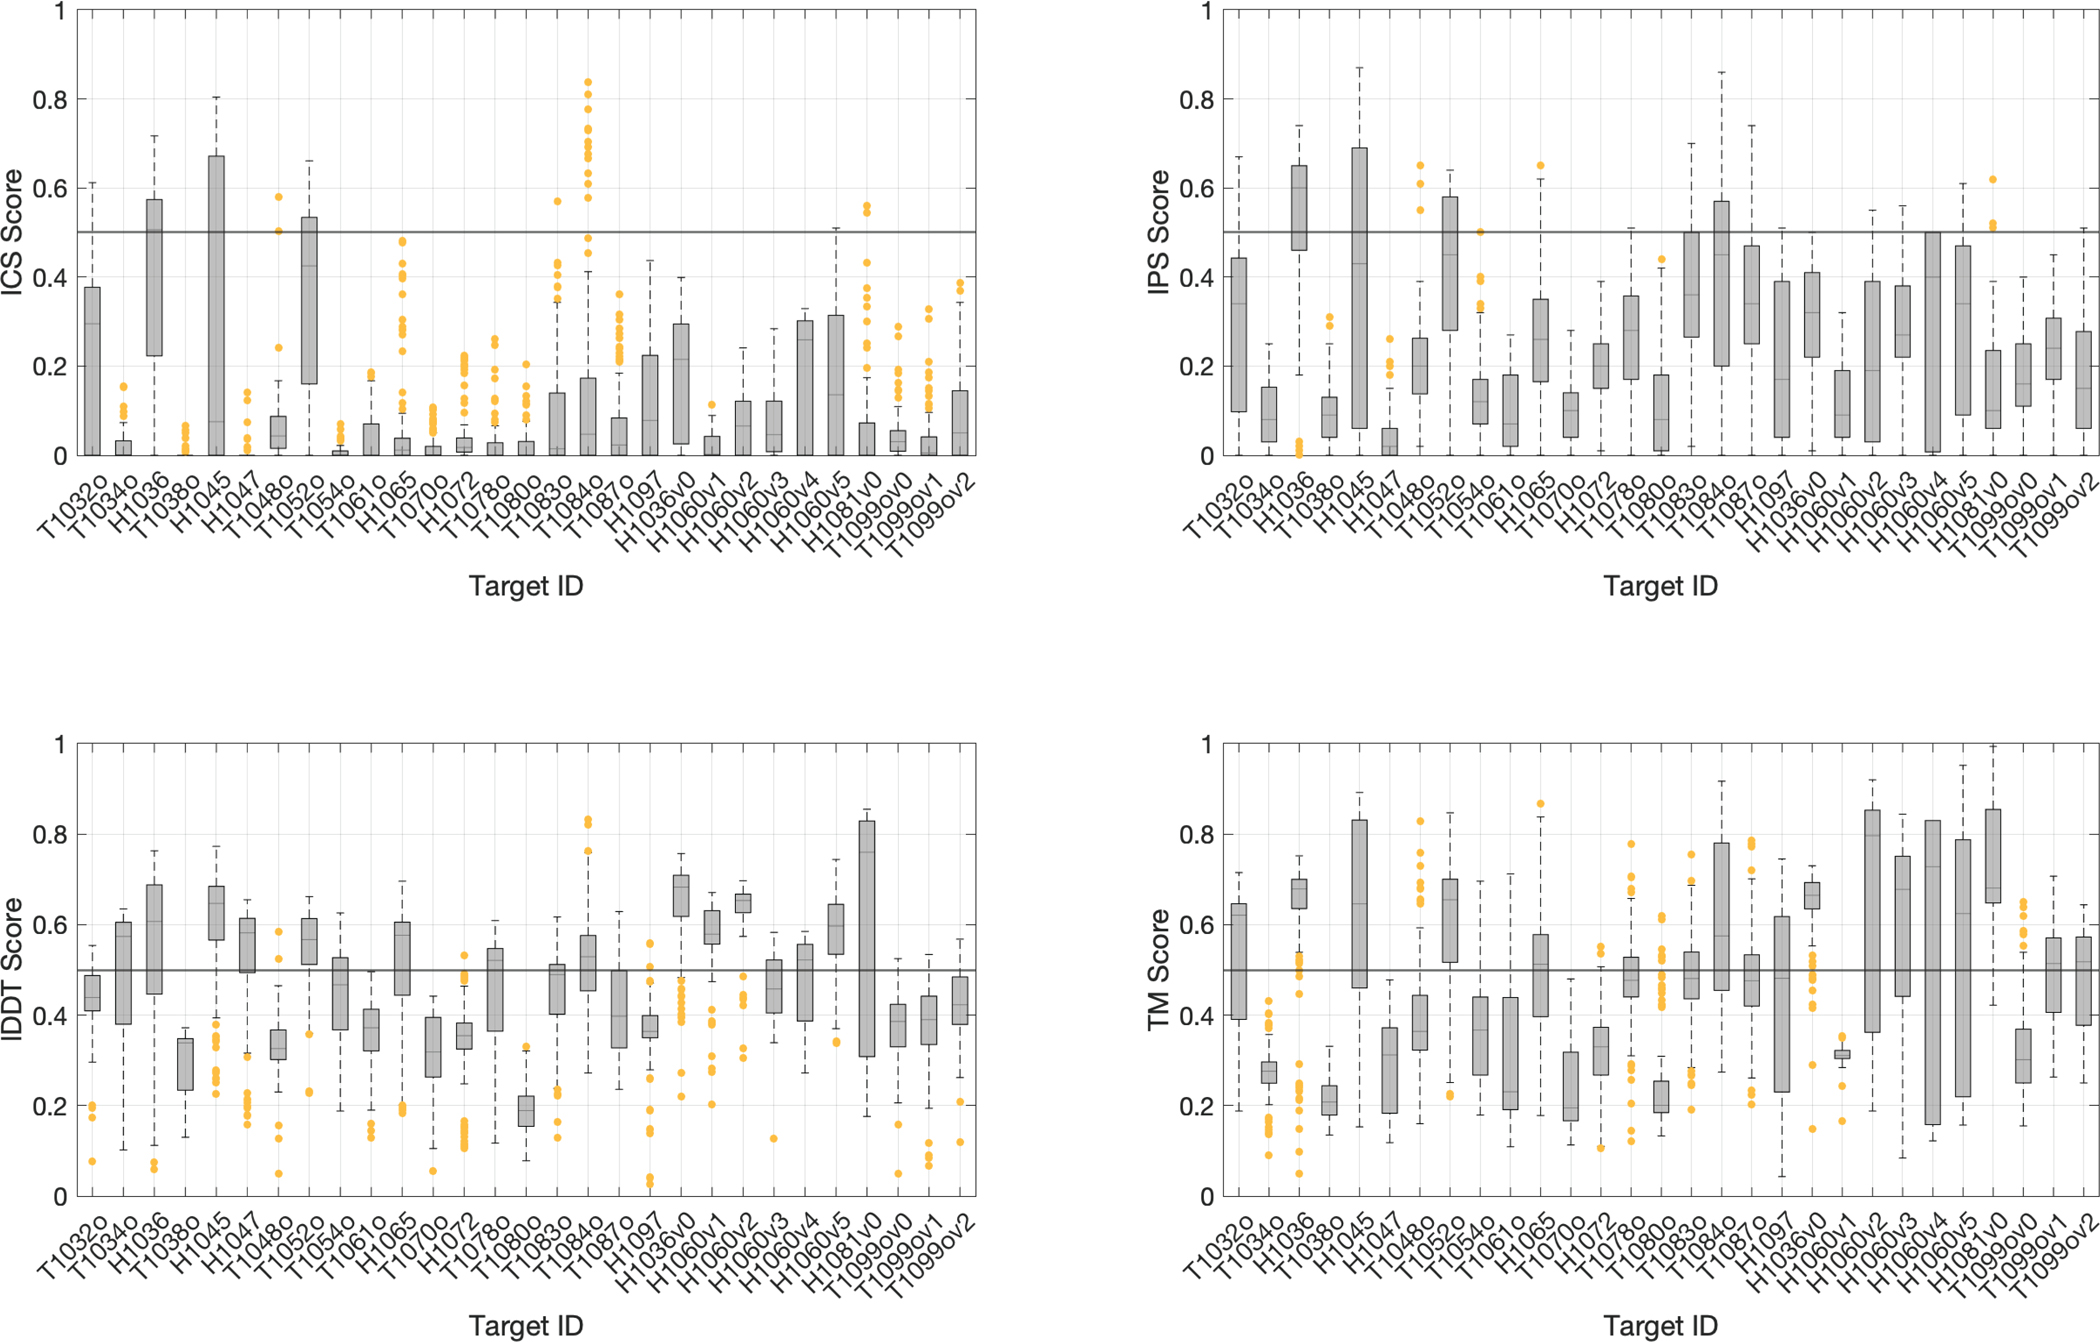
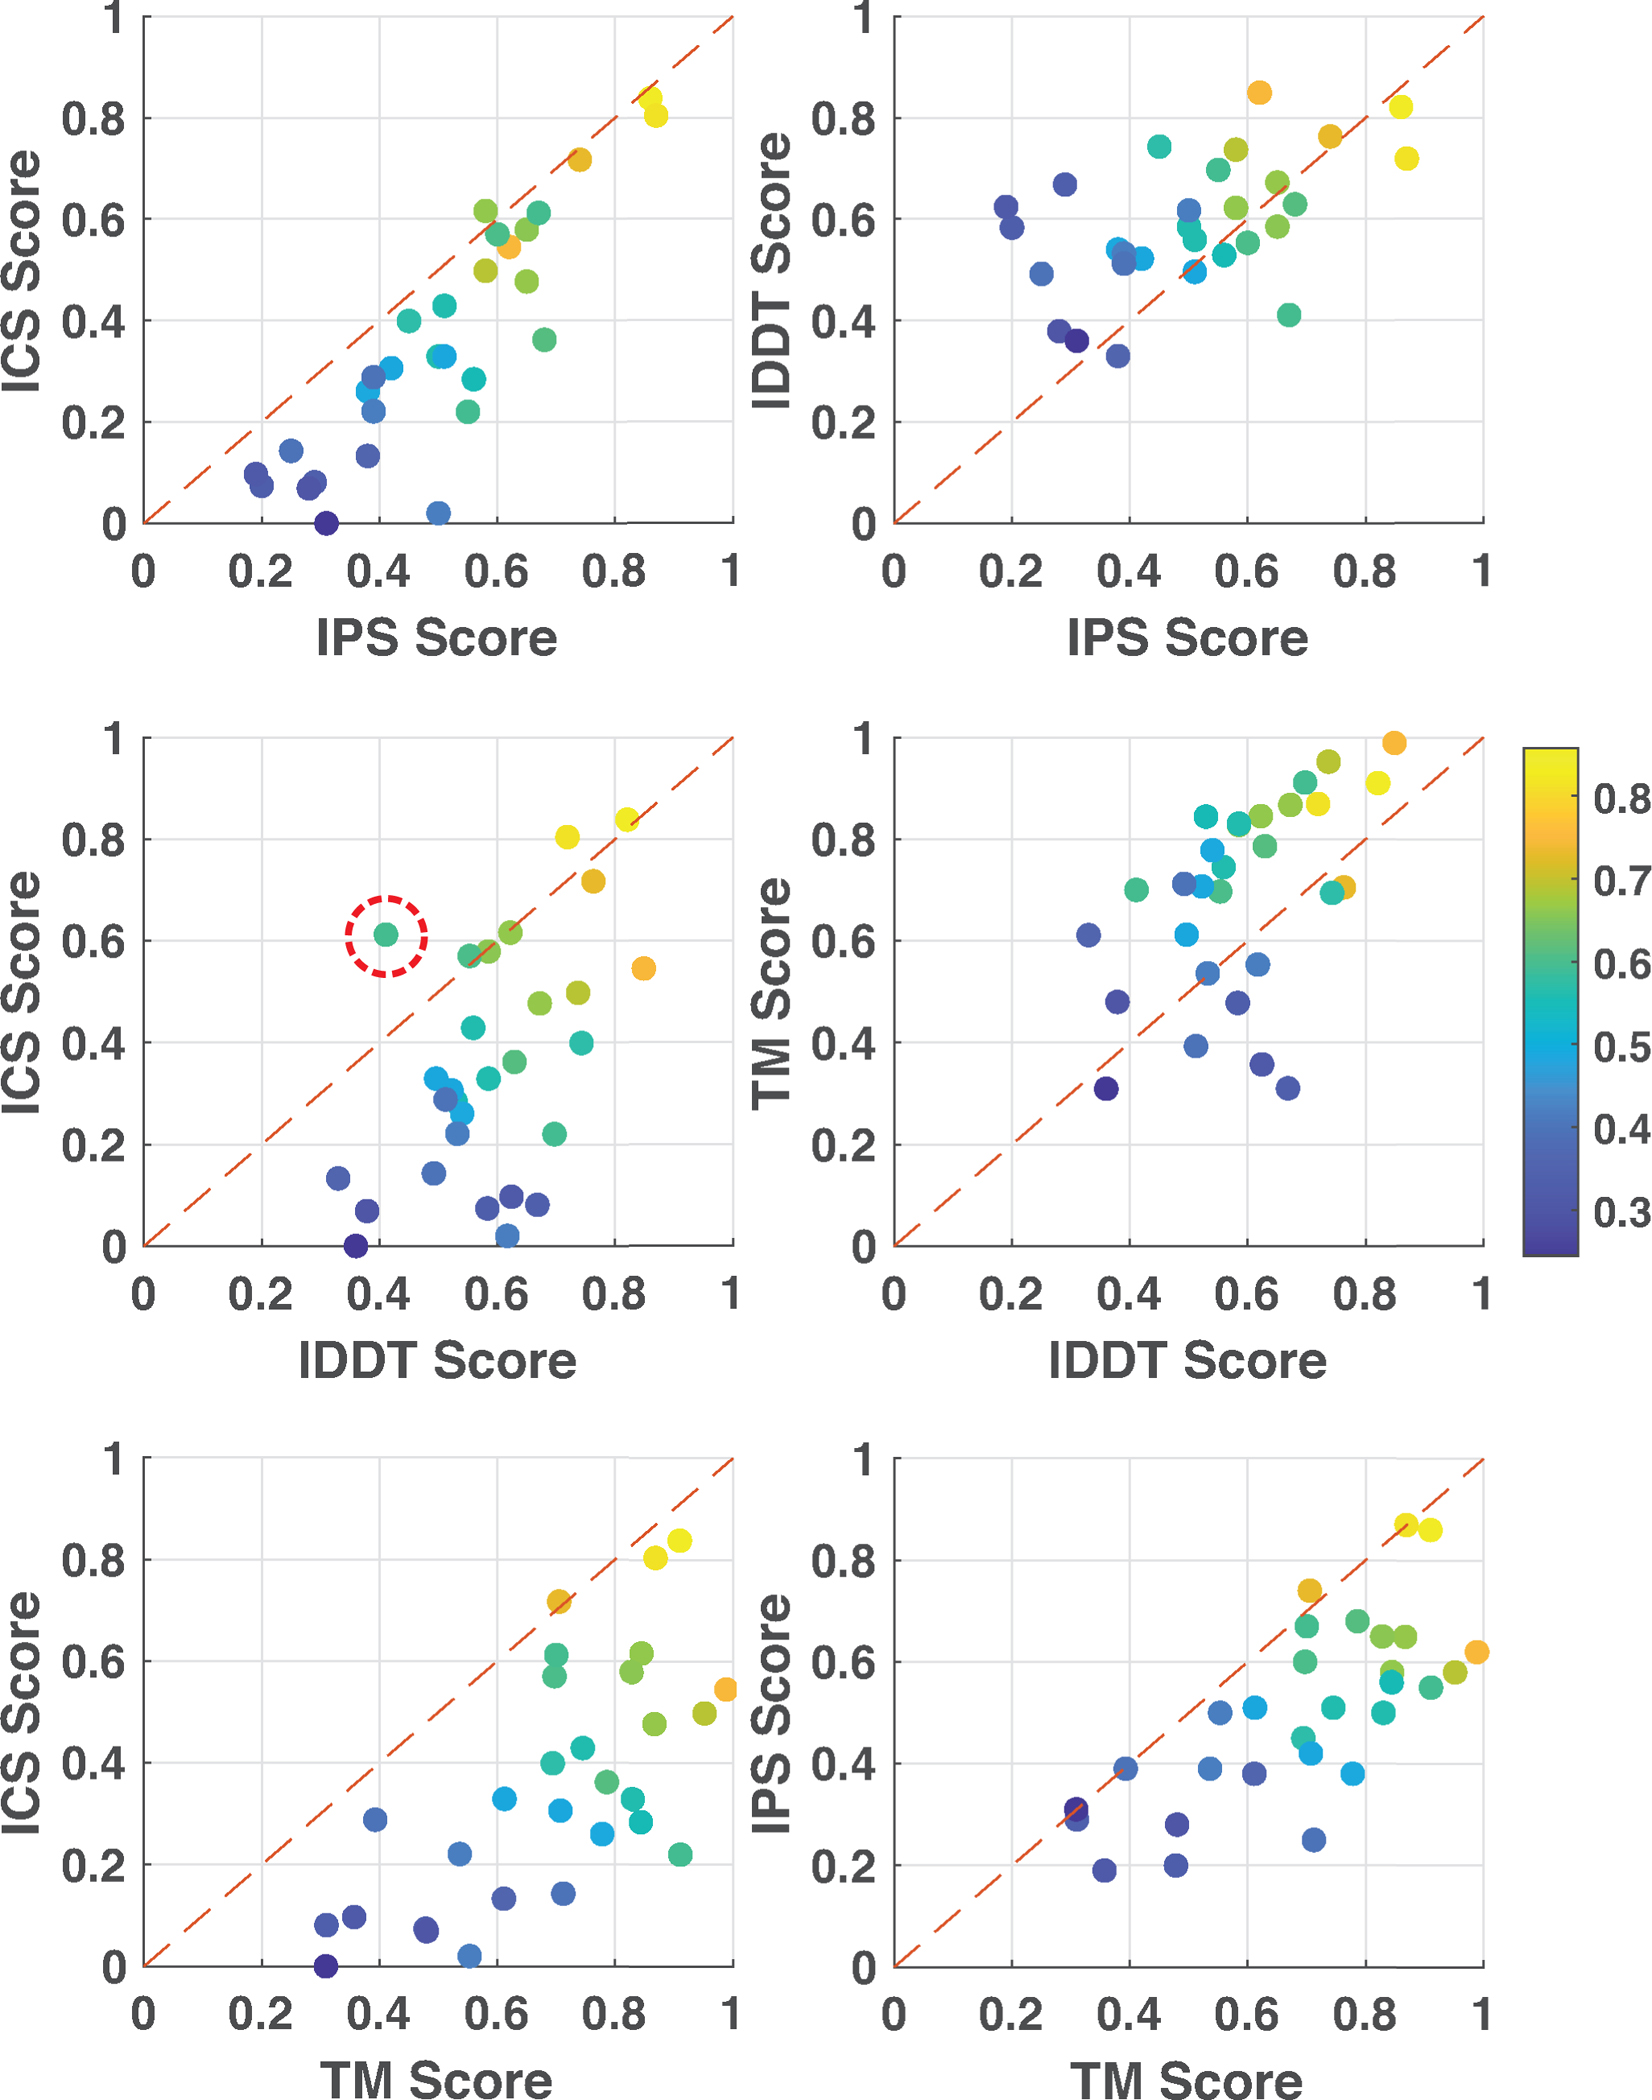
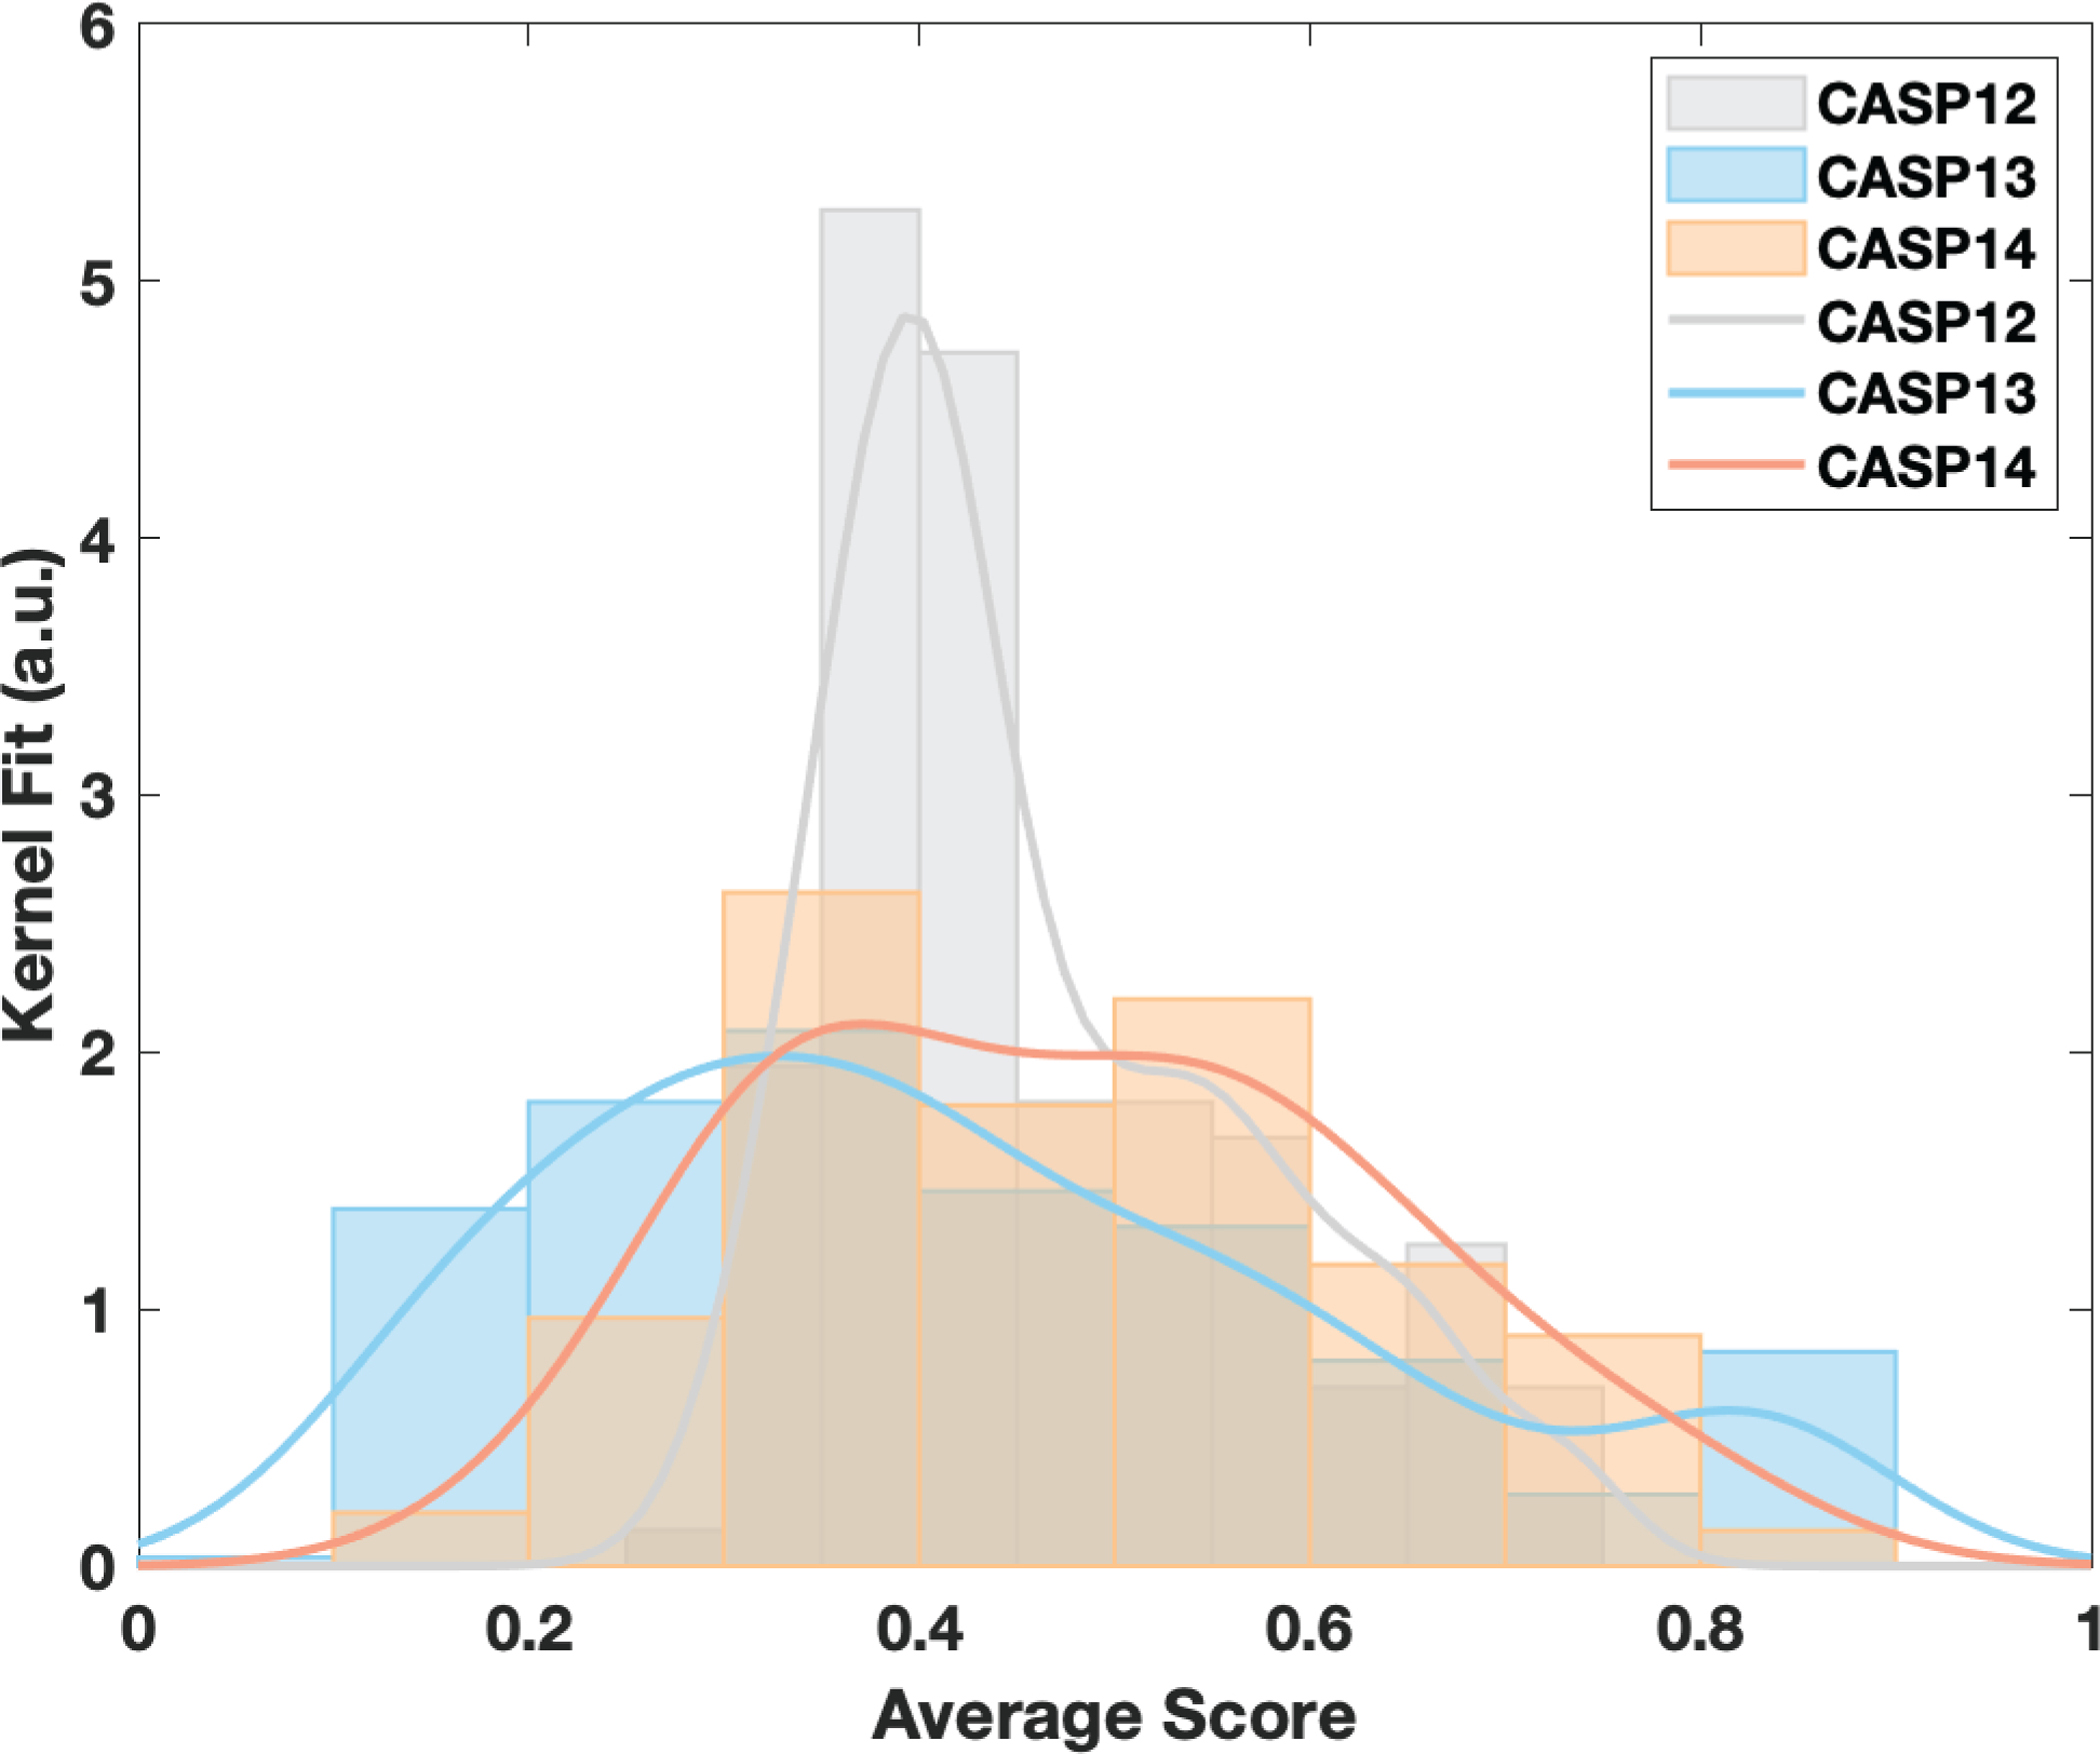
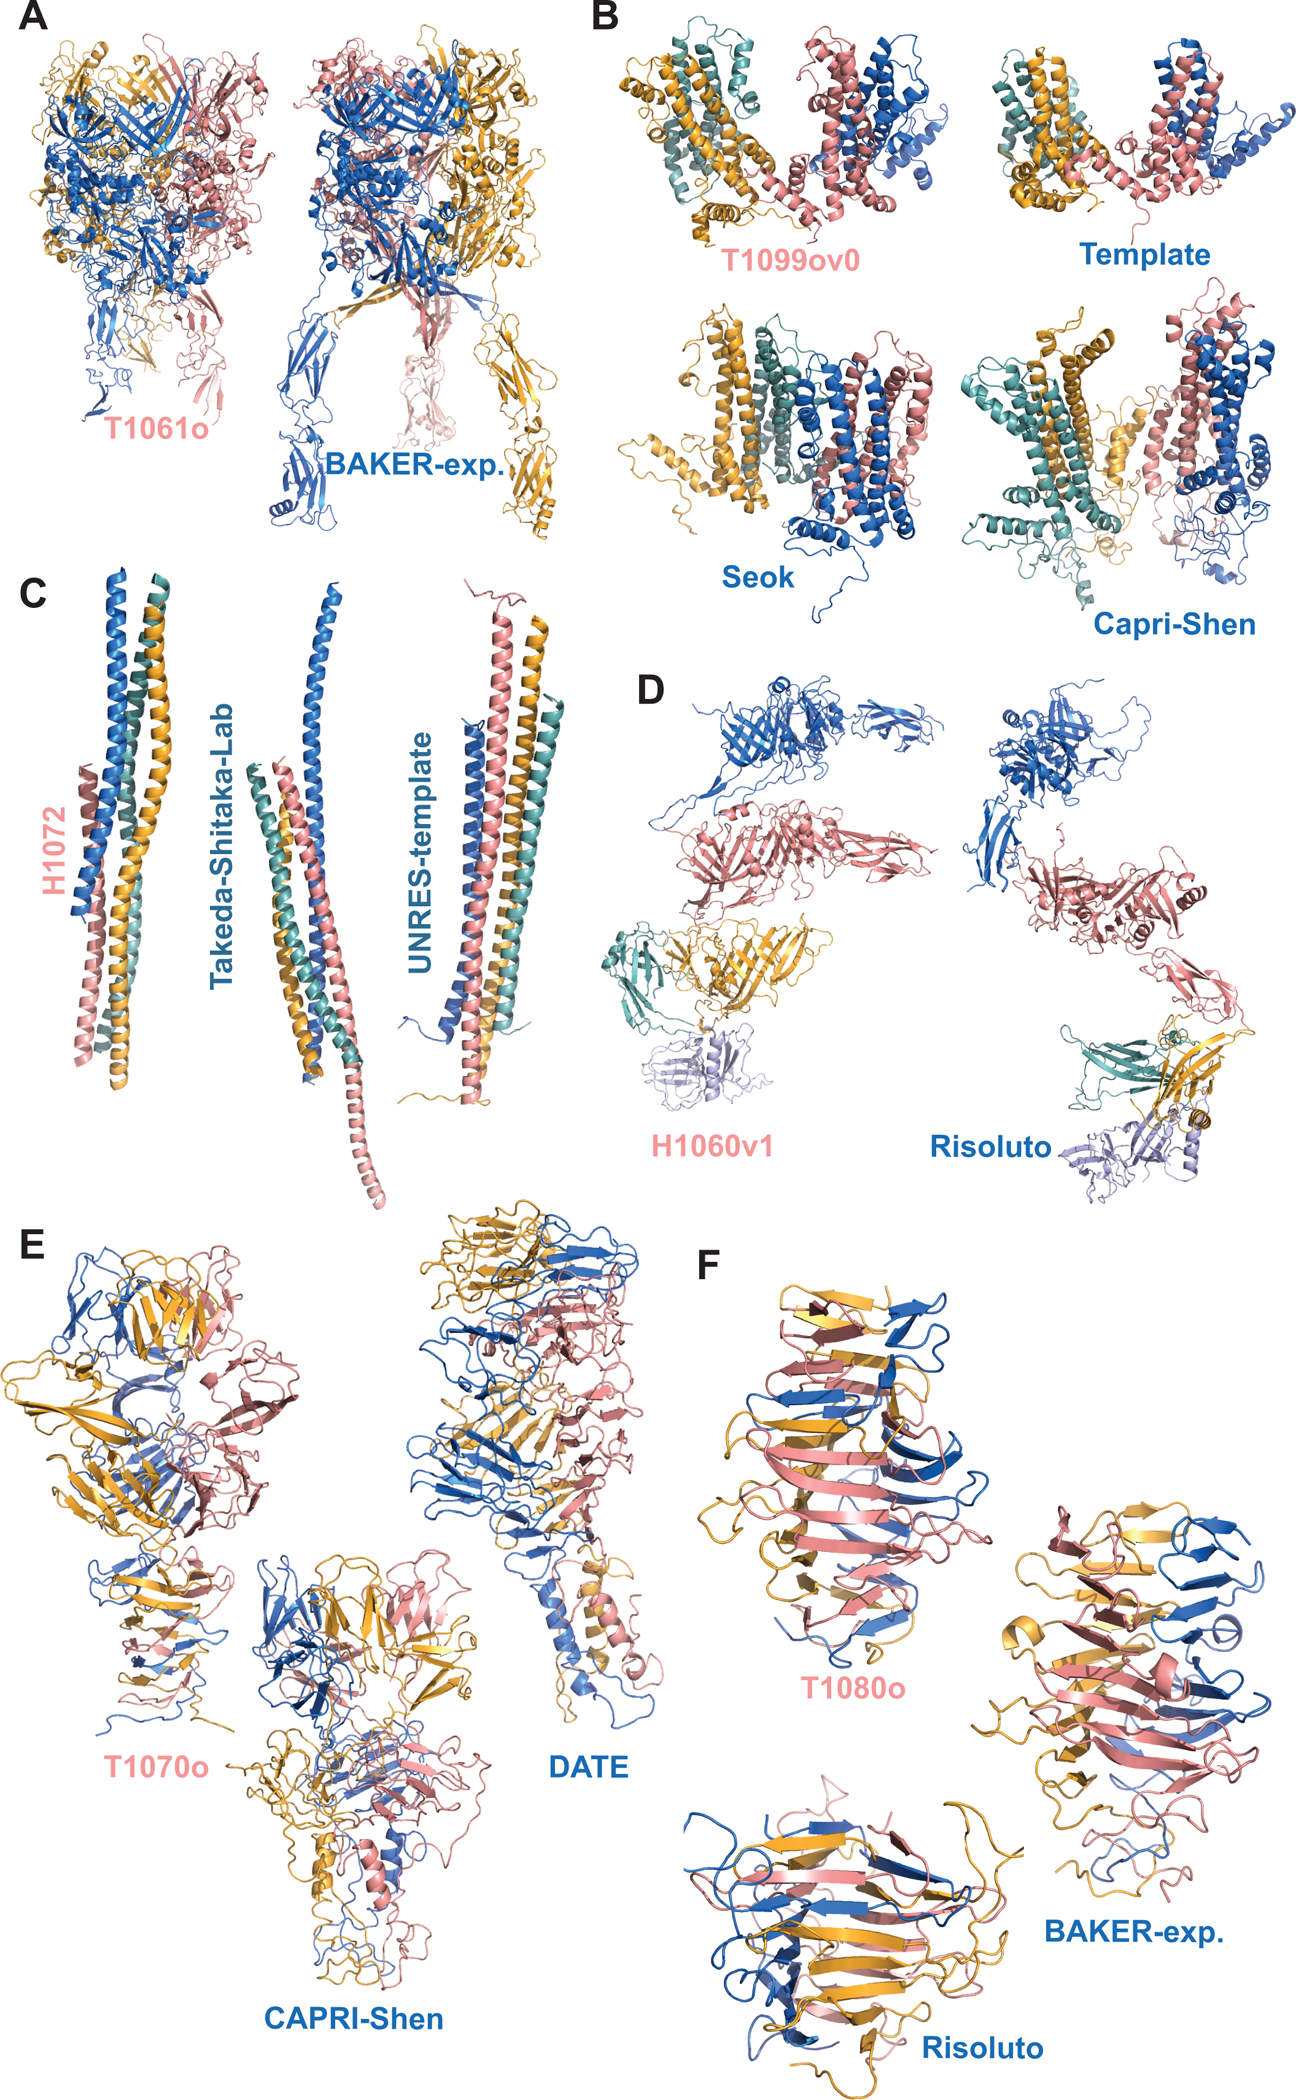
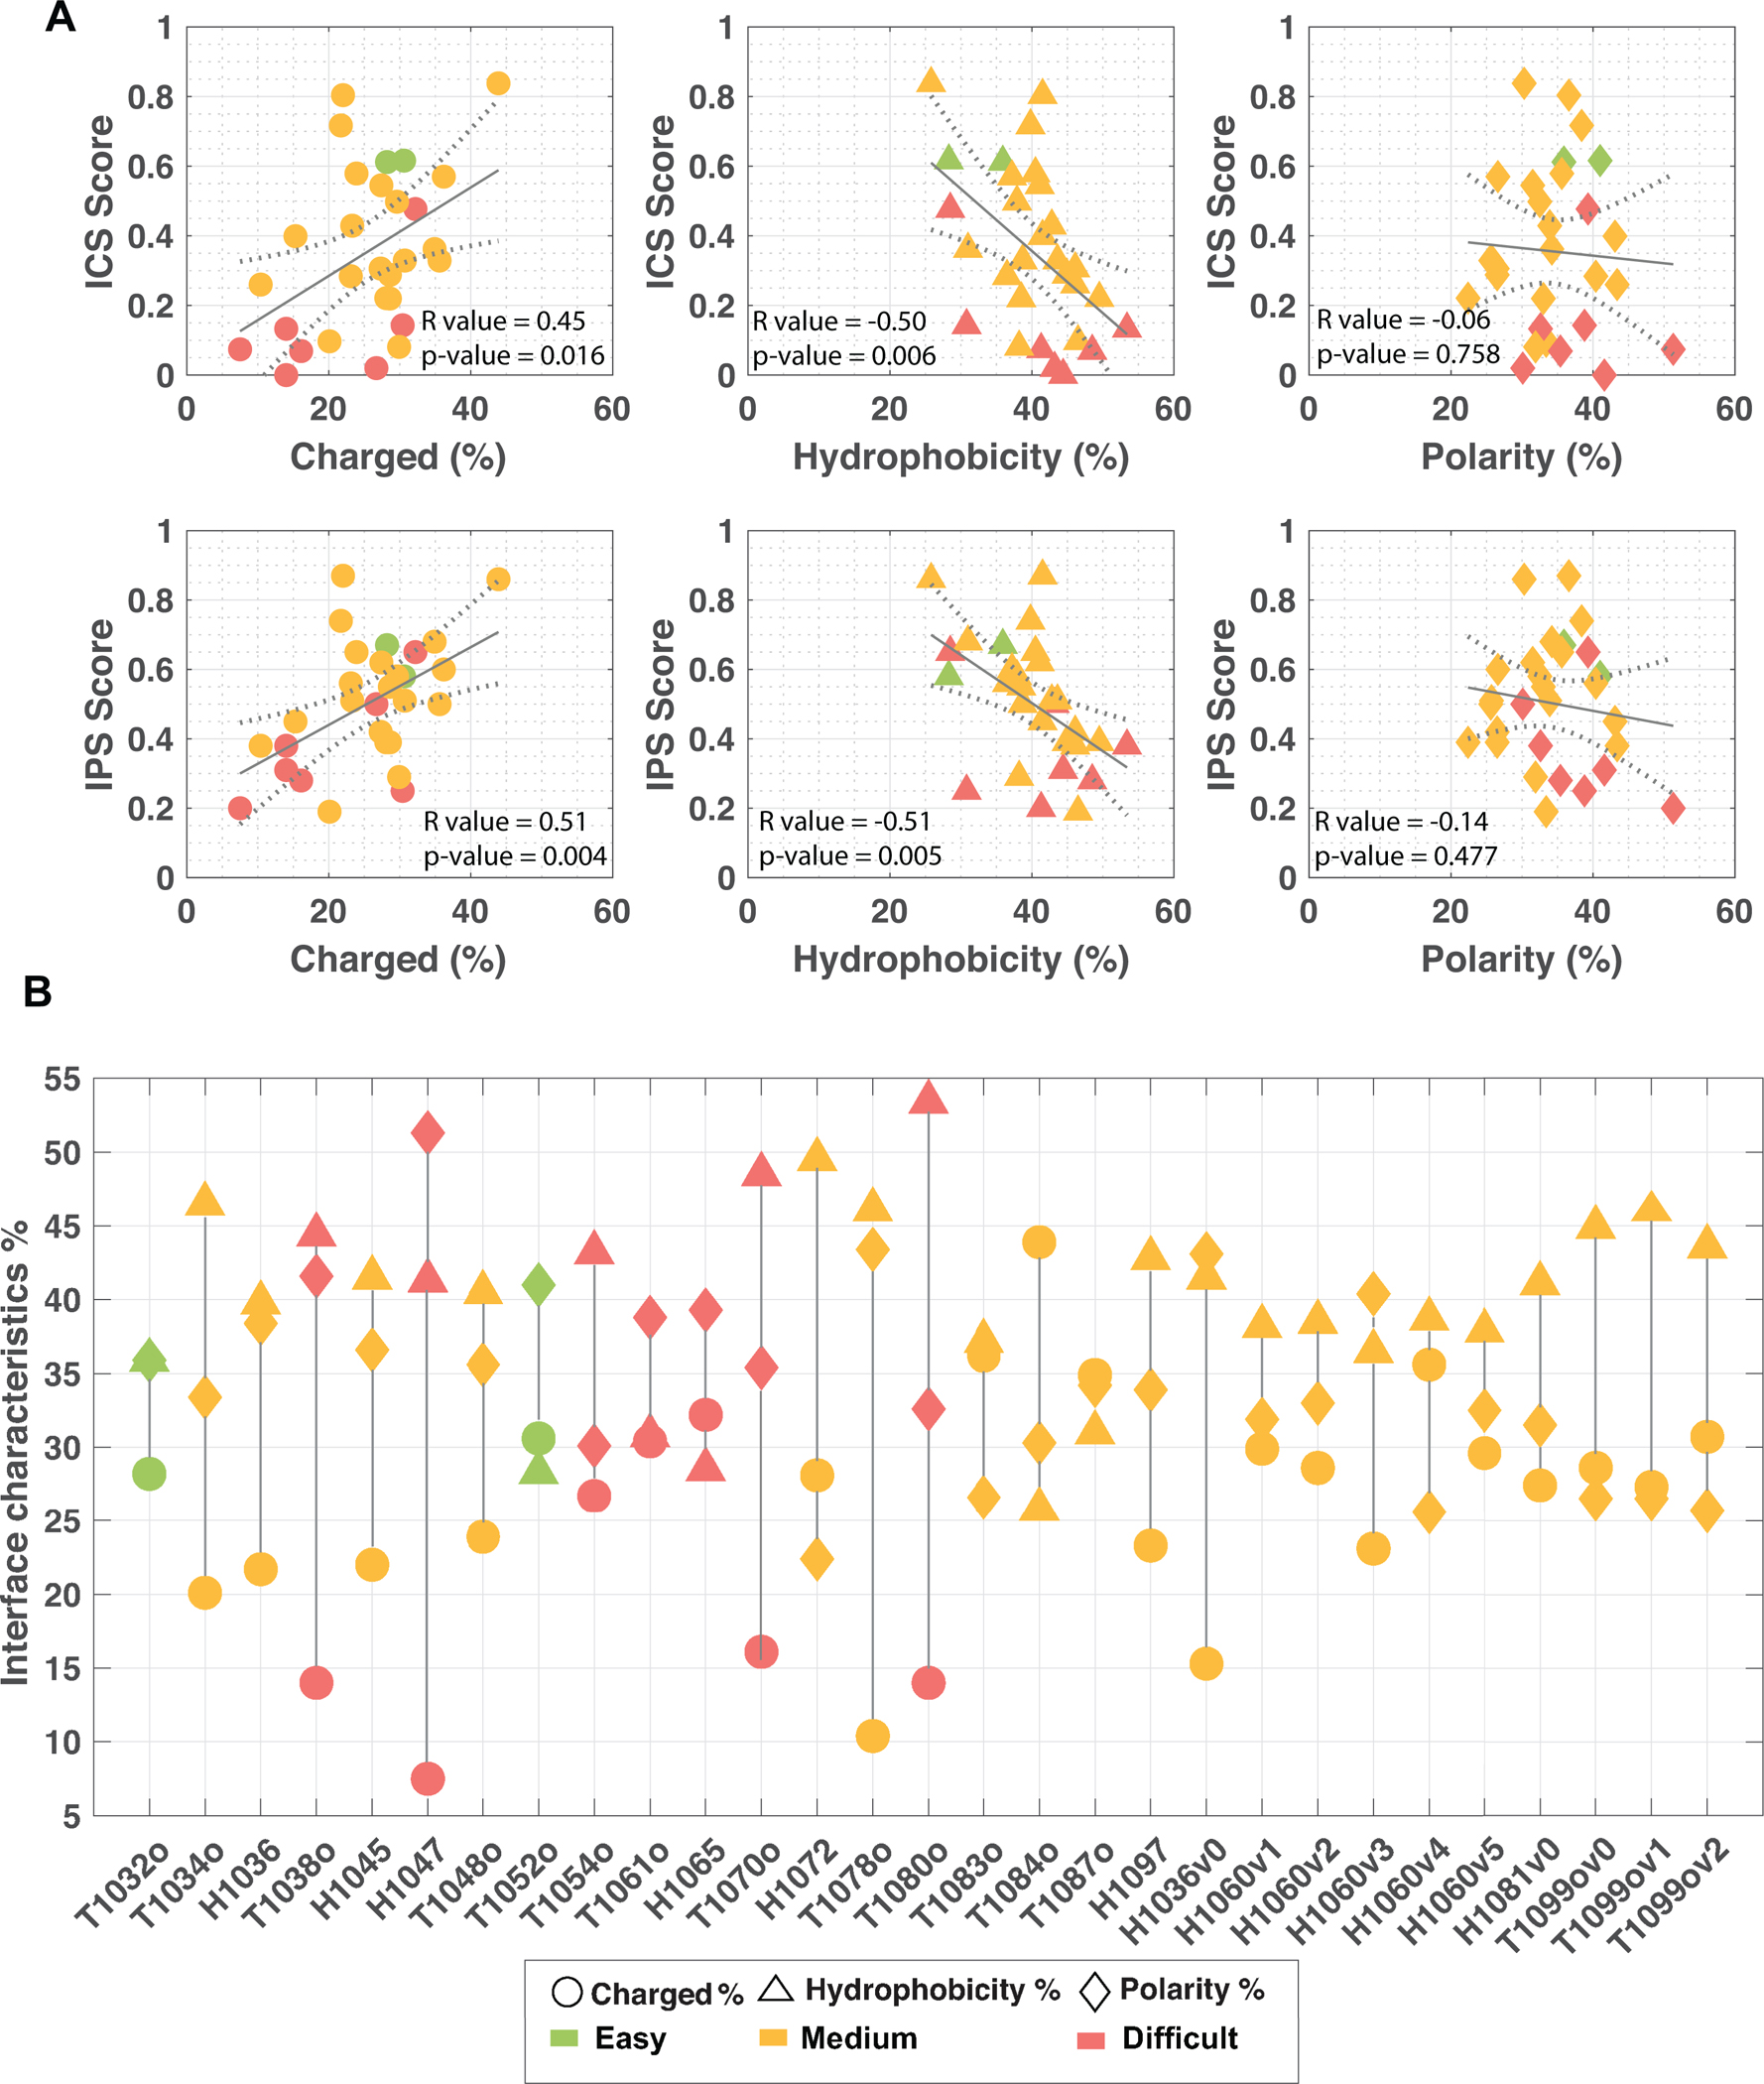
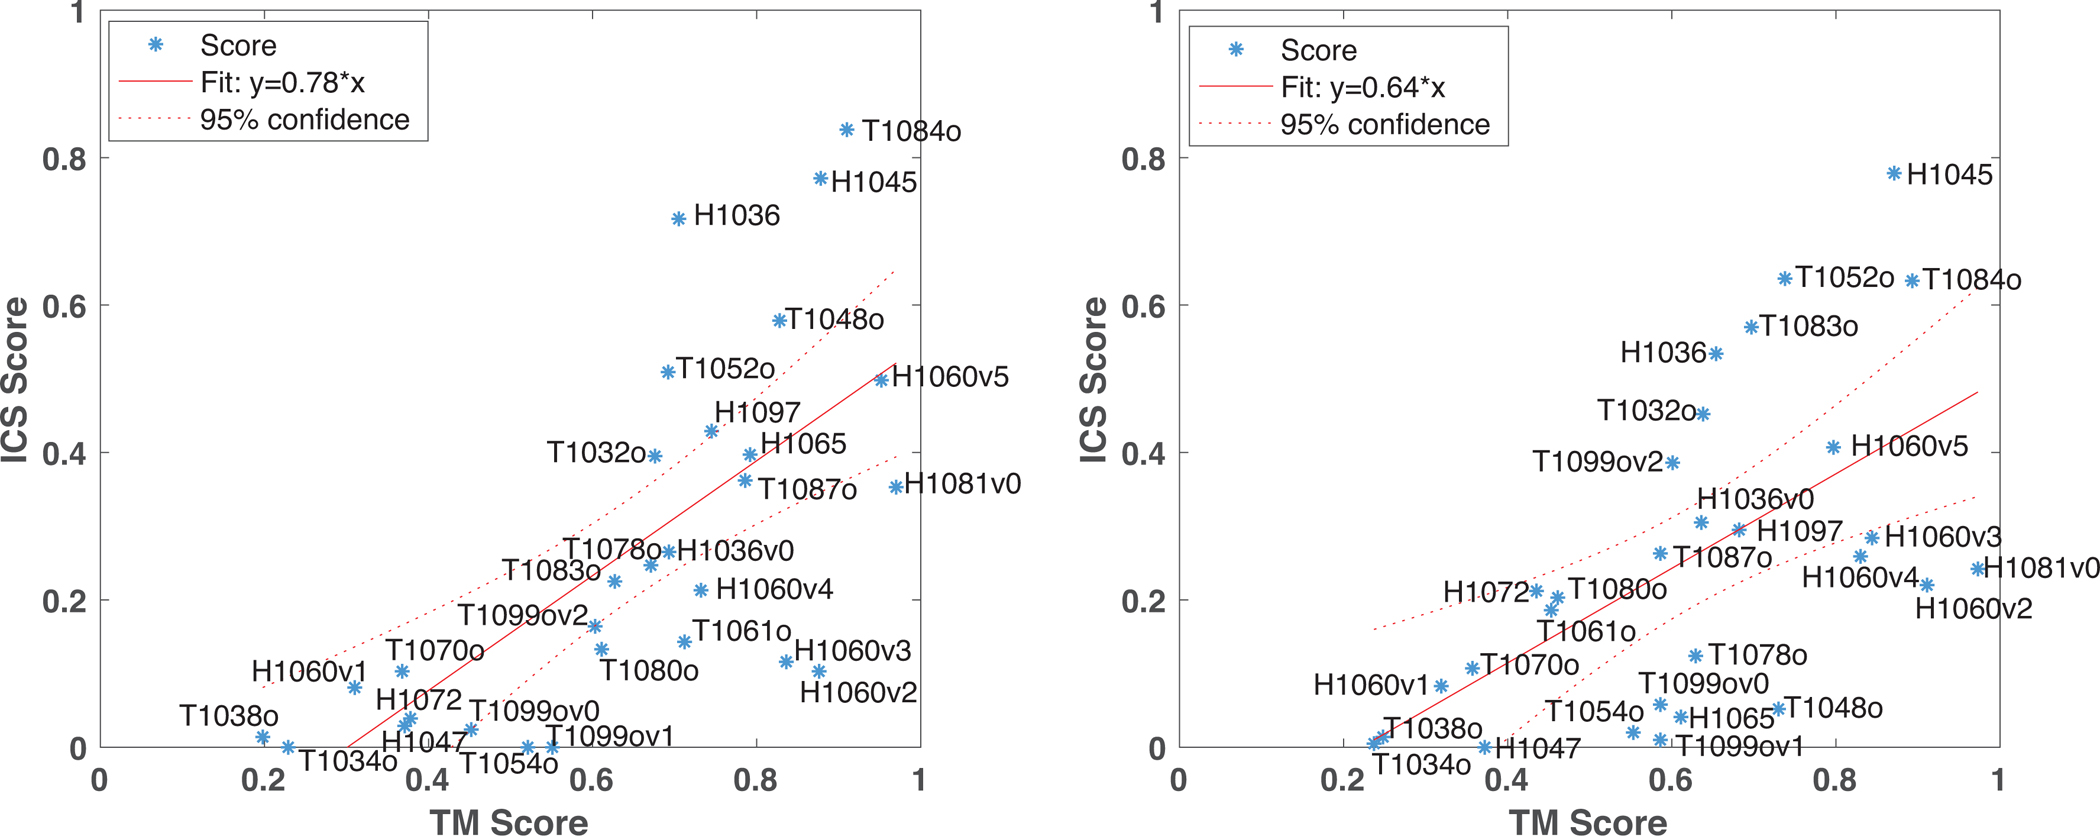
In CASP14, 39 research groups submitted more than 2500 3D models on 22 protein complexes. In general, the community performed well in predicting the fold of the assemblies (for 80% of the targets), although it faced significant challenges in reproducing the native contacts. This is especially the case for the complexes without whole-assembly templates. The leading predictor, BAKER-experimental, used a methodology combining classical techniques (template-based modeling, protein docking) with deep learning-based contact predictions and a fold-and-dock approach. The Venclovas team achieved the runner-up position with template-based modeling and docking. By analyzing the target interfaces, we showed that the complexes with depleted charged contacts or dominating hydrophobic interactions were the most challenging ones to predict. We also demonstrated that if AlphaFold2 predictions were at hand, the interface prediction challenge could be alleviated for most of the targets. All in all, it is evident that new approaches are needed for the accurate prediction of assemblies, which undoubtedly will expand on the significant improvements in the tertiary structure prediction field.

Keywords: CASP; contact prediction; protein assembly; quaternary structure prediction; template-based modeling.


Conflict of interest statement

Conflict of interest disclosure

The authors declare no conflicts of interest.

Figures

Figure 1.
Figure 1.
The ranking of the CASP14 Assembly Groups according to the Z-score-based ranking (Eq. 3).
Figure 2.
Figure 2.
The top five successfully predicted targets and their best predicted models. (A) T1084o, (B) H1036, (C) H1045, (D) H1081v0, (E) H1060v5, where each monomer is represented with a different color.
Figure 3.
Figure 3.
The per-target distribution of each scoring term (ICS, IPS, lDDT, TM). The successful model criterion 0.5 is marked with a solid gray line.
Figure 4.
Figure 4.
The pairwise relationship of each scoring term belonging to the best model (of each target). The scattered data points are colored according to their mean scores in all plots. The mean score is defined by the average of the four assessment metrics as given in mean-score=(ICS+IPS+TM+lDDT)/4). For only one target, T1032o, shape-related metric lDDT has a worse score than the interface-related ICS (encircled in red in middle-left figure).
Figure 5.
Figure 5.
The mean-score distributions of CASP12, CASP13 and CASP14 assembly models, when the top five models of each target were considered.
Figure 6.
Figure 6.
The target and prediction highlights of the CASP14 assembly round. (A) T1061o, (B) T1099o (also with the template (pdb id:3j2v(Yu et al., 2013))), (C) H1072, (D) H1060v1, (E) T1070o, (F) T1080o, where each monomer is represented with a different color.
Figure 7.
Figure 7.
(A) The relationship between the interface characteristics and the interface-related scores (ICS and IPS): the charged interface percent vs. ICS/IPS score (left), the hydrophobic interface percent vs. ICS/IPS score (middle), and the polar interface percent vs ICS/IPS score (right). Each data point was colored according to its target difficulty (easy: green, medium: orange and difficult: red). The fitting was performed with the least square fitting option of Matlab (MATLAB and Statistics Toolbox Release 2020b). (B) The biophysical interface characteristics of each target. The charged interface percent was marked with circles, hydrophobicity with triangles and polarity with diamonds. Each data point was colored according to its target difficulty as in panel A of this figure.
Figure 8.
Figure 8.
The ICS vs. TM score correlations for the best models submitted by BAKER-experimental (left) and Venclovas groups (right). Each data point was labeled with its corresponding target id. The fitting was performed with the least square fitting option of Matlab (MATLAB and Statistics Toolbox Release 2020b).

References

    1. Andréll J, Hicks MG, Palmer T, Carpenter EP, Iwata S, & Maher MJ (2009). Crystal structure of the acid-induced arginine decarboxylase from Escherichia coli: reversible decamer assembly controls enzyme activity. Biochemistry, 48(18), 3915–3927. - PubMed
    1. Anishchenko I, Kundrotas PJ, & Vakser IA (2017). Modeling complexes of modeled proteins. Proteins: Structure, Function and Bioinformatics, 85(3), 470–478. 10.1002/prot.25183 - DOI - PMC - PubMed
    1. Bahat Y, Alter J, & Dessau M (2020). Crystal structure of tomato spotted wilt virus G N reveals a dimer complex formation and evolutionary link to animal-infecting viruses. 10.1073/pnas.2004657117/-/DCSupplemental - DOI - PMC - PubMed
    1. Benjin X, & Ling L (2020). Developments, applications, and prospects of cryo-electron microscopy. In Protein Science (Vol. 29, Issue 4, pp. 872–882). Blackwell Publishing Ltd. 10.1002/pro.3805 - DOI - PMC - PubMed
    1. Bliven S, Lafita A, Parker A, Capitani G, & Duarte JM (2018). Automated evaluation of quaternary structures from protein crystals. PLoS Computational Biology, 14(4). 10.1371/journal.pcbi.1006104 - DOI - PMC - PubMed

Publication types