. 2021 Dec;86(6):2930-2944.
doi: 10.1002/mrm.28949. Epub 2021 Aug 2.

Method for fast lipid reconstruction and removal processing in 1 H MRSI of the brain

Affiliations

Method for fast lipid reconstruction and removal processing in 1 H MRSI of the brain

Peter Adany et al. Magn Reson Med. 2021 Dec.

Abstract

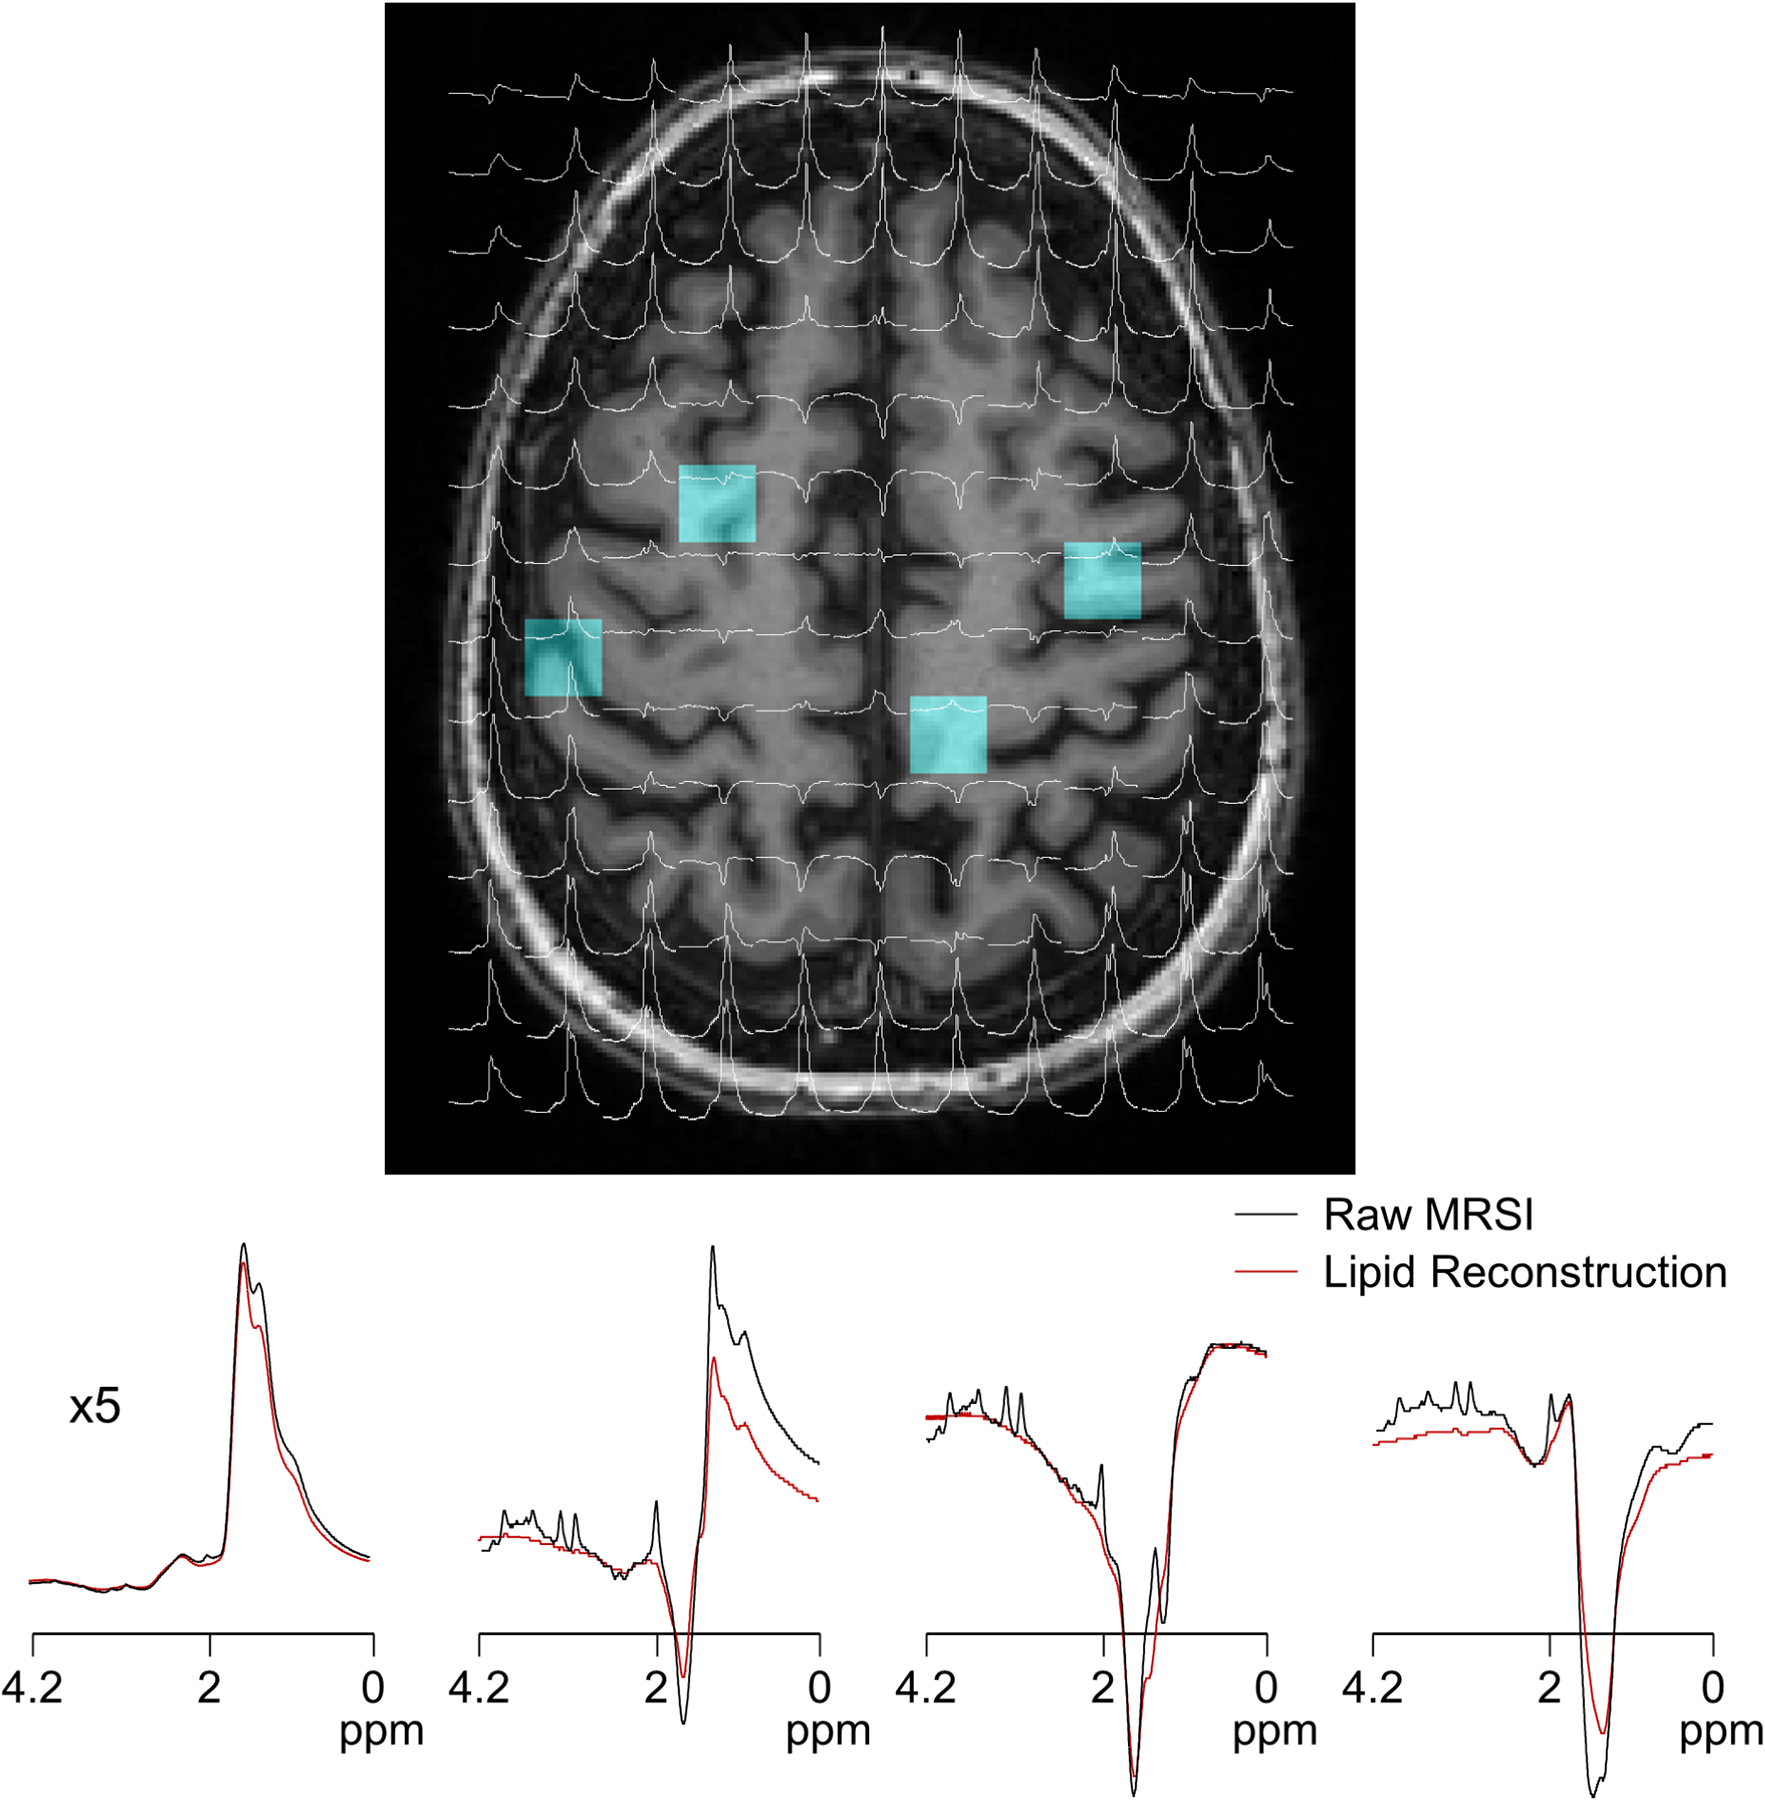
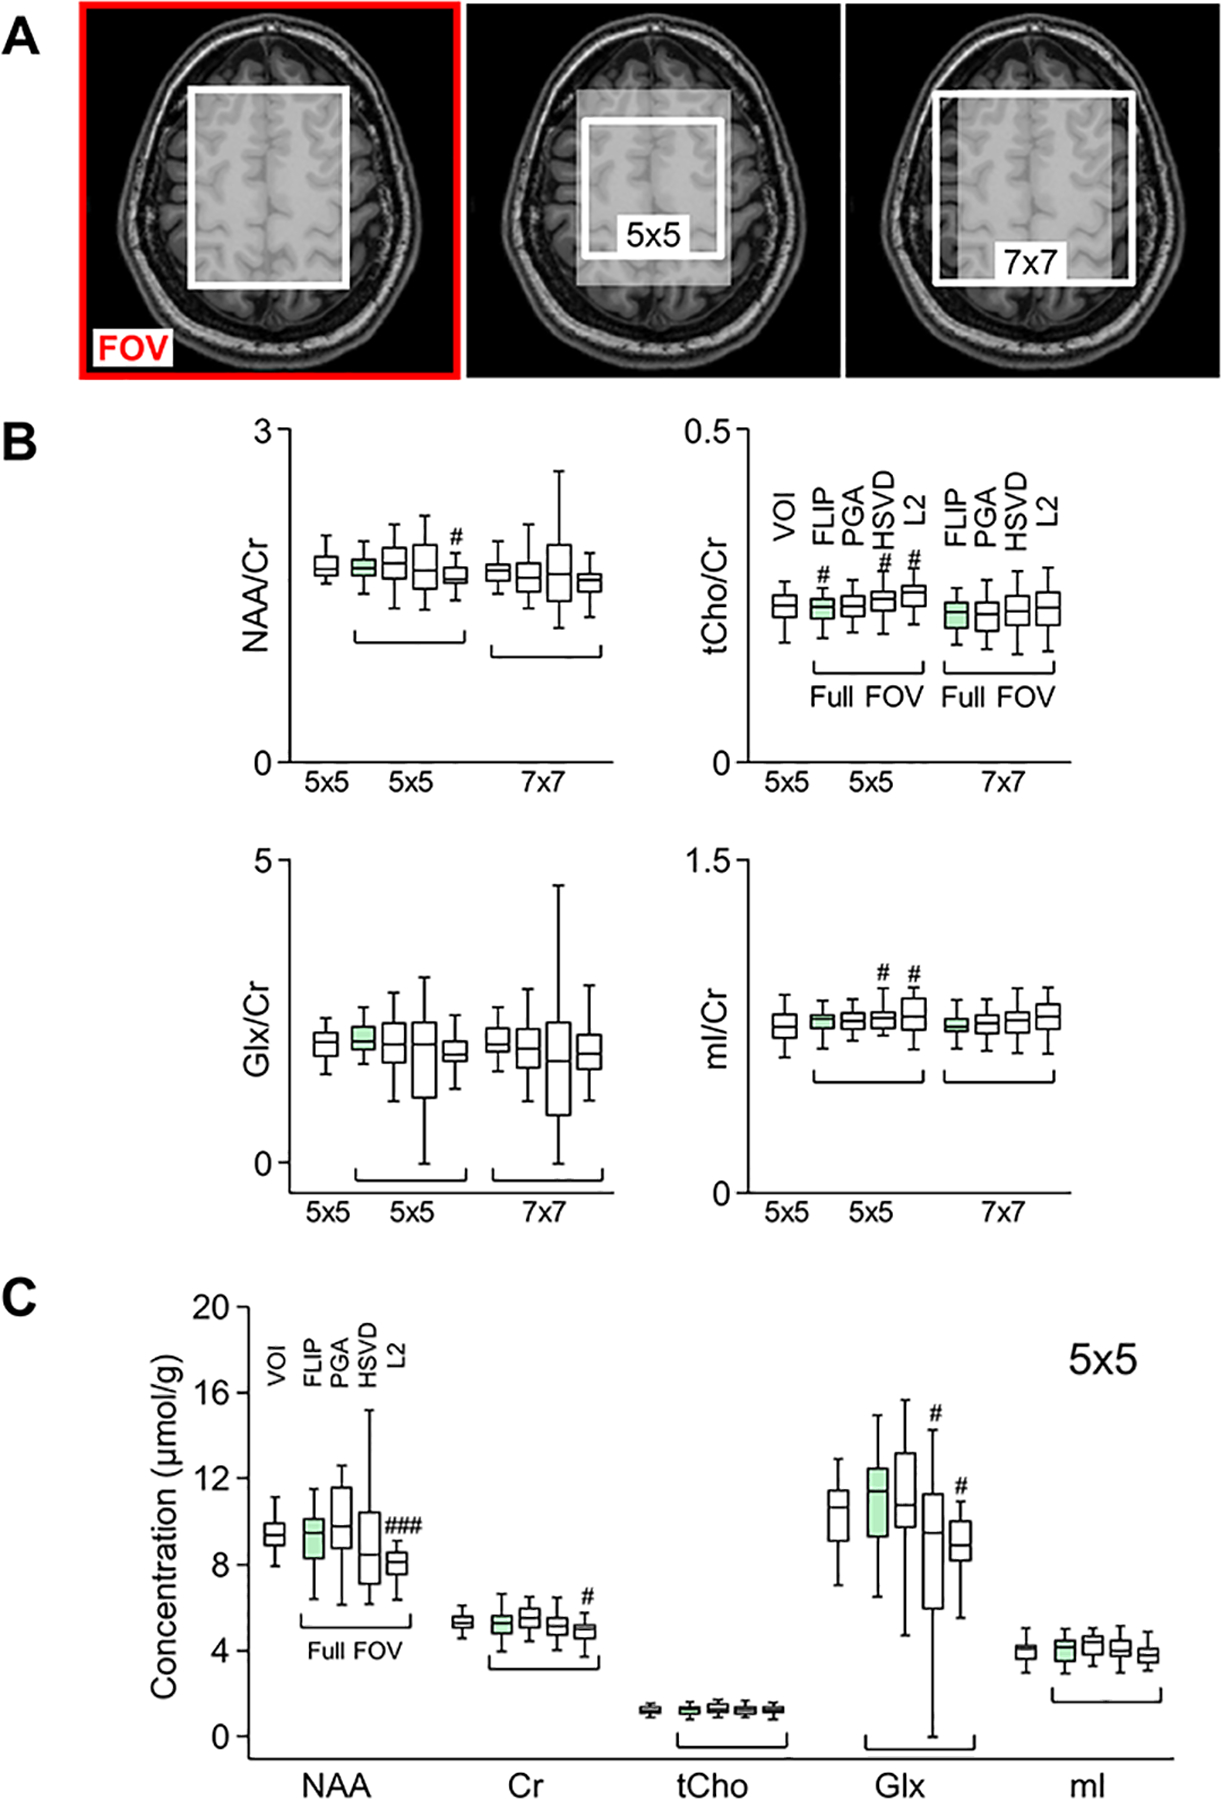
Purpose: To develop a new rapid spatial filtering method for lipid removal, fast lipid reconstruction and removal processing (FLIP), which selectively isolates and removes interfering lipid signals from outside the brain in a full-FOV 2D MRSI and whole-brain 3D echo planar spectroscopic imaging (EPSI).

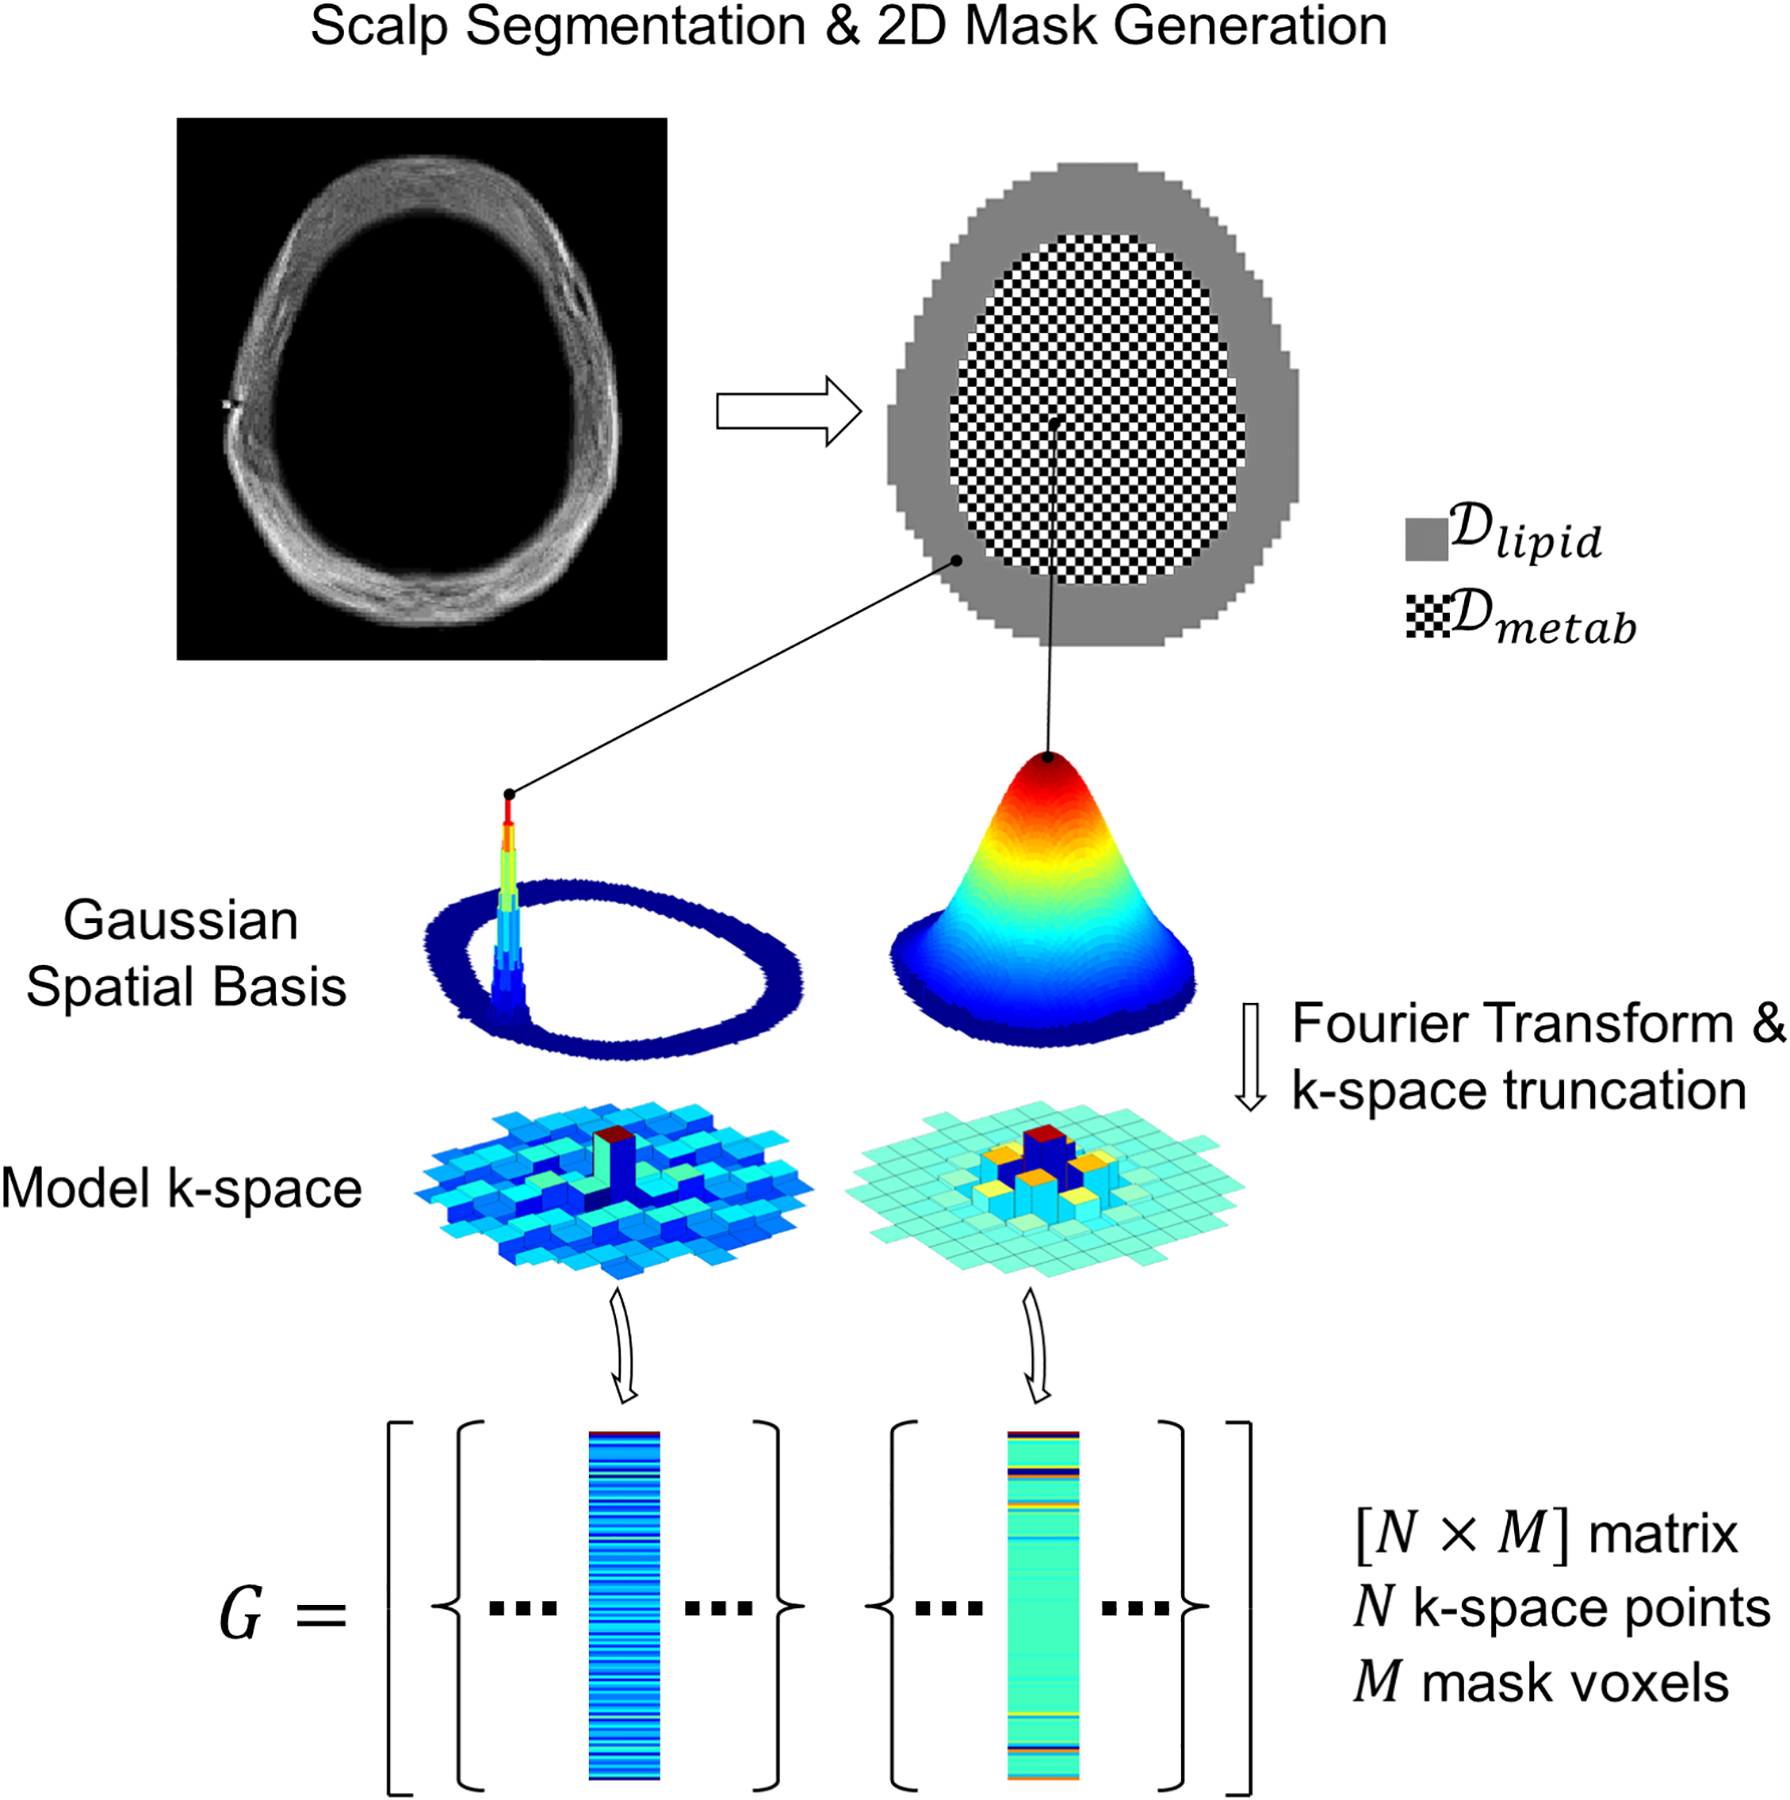
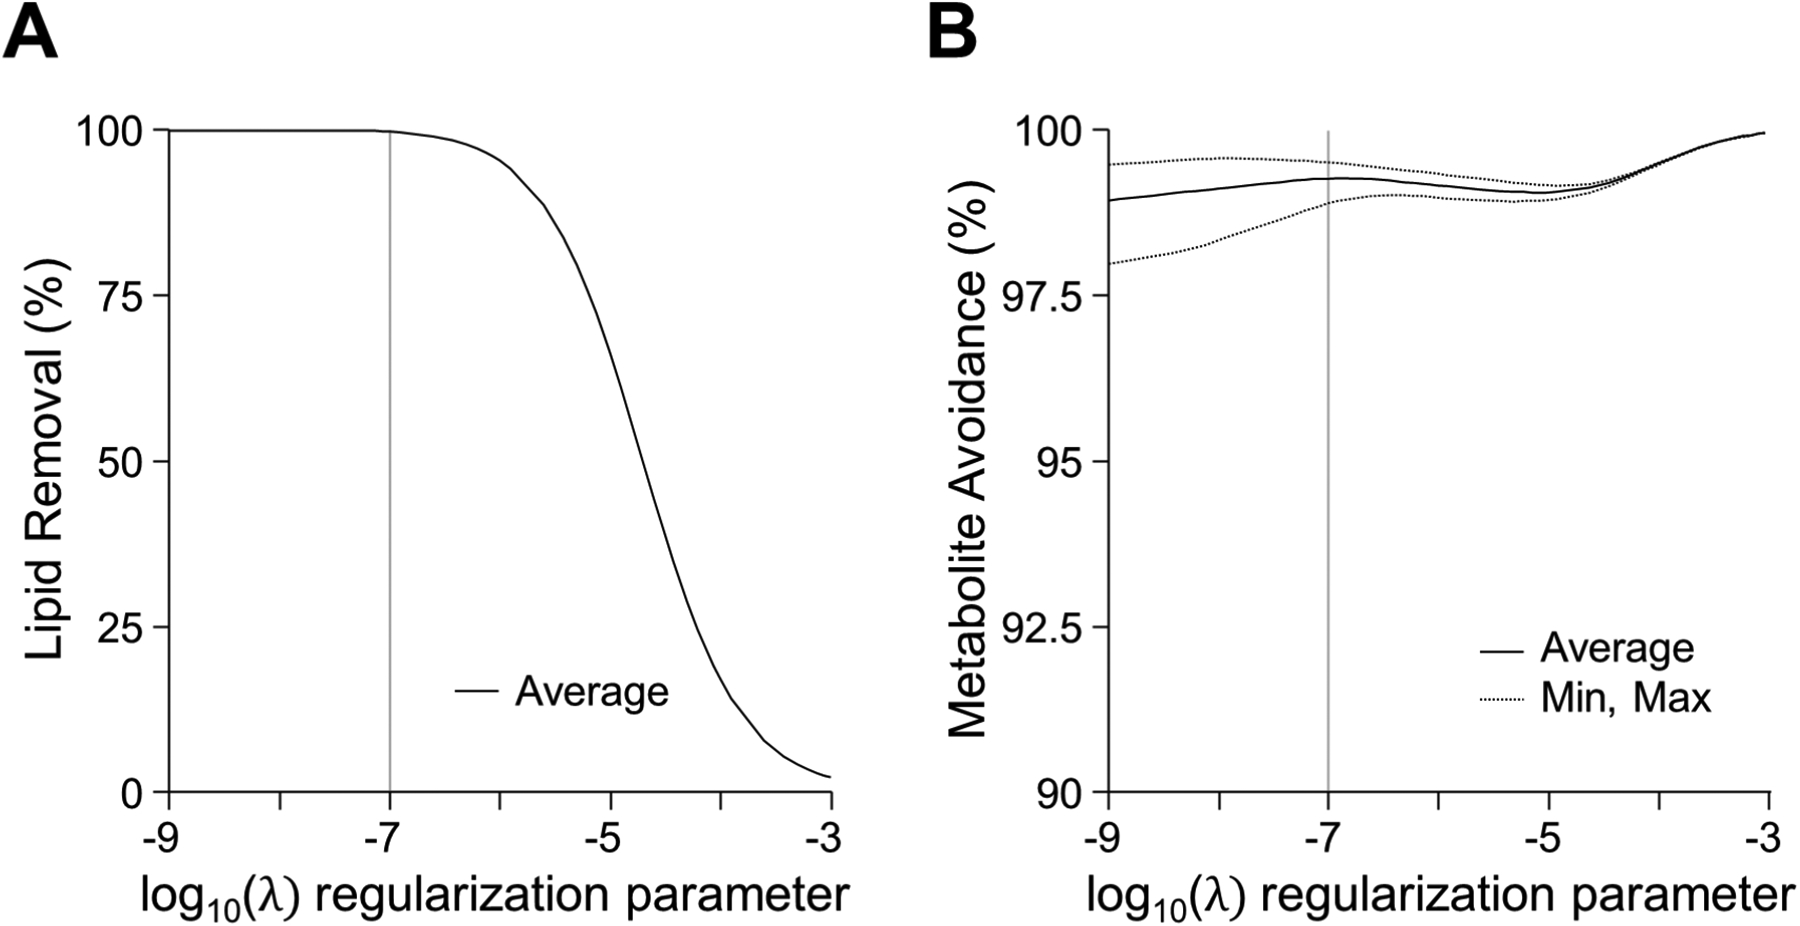
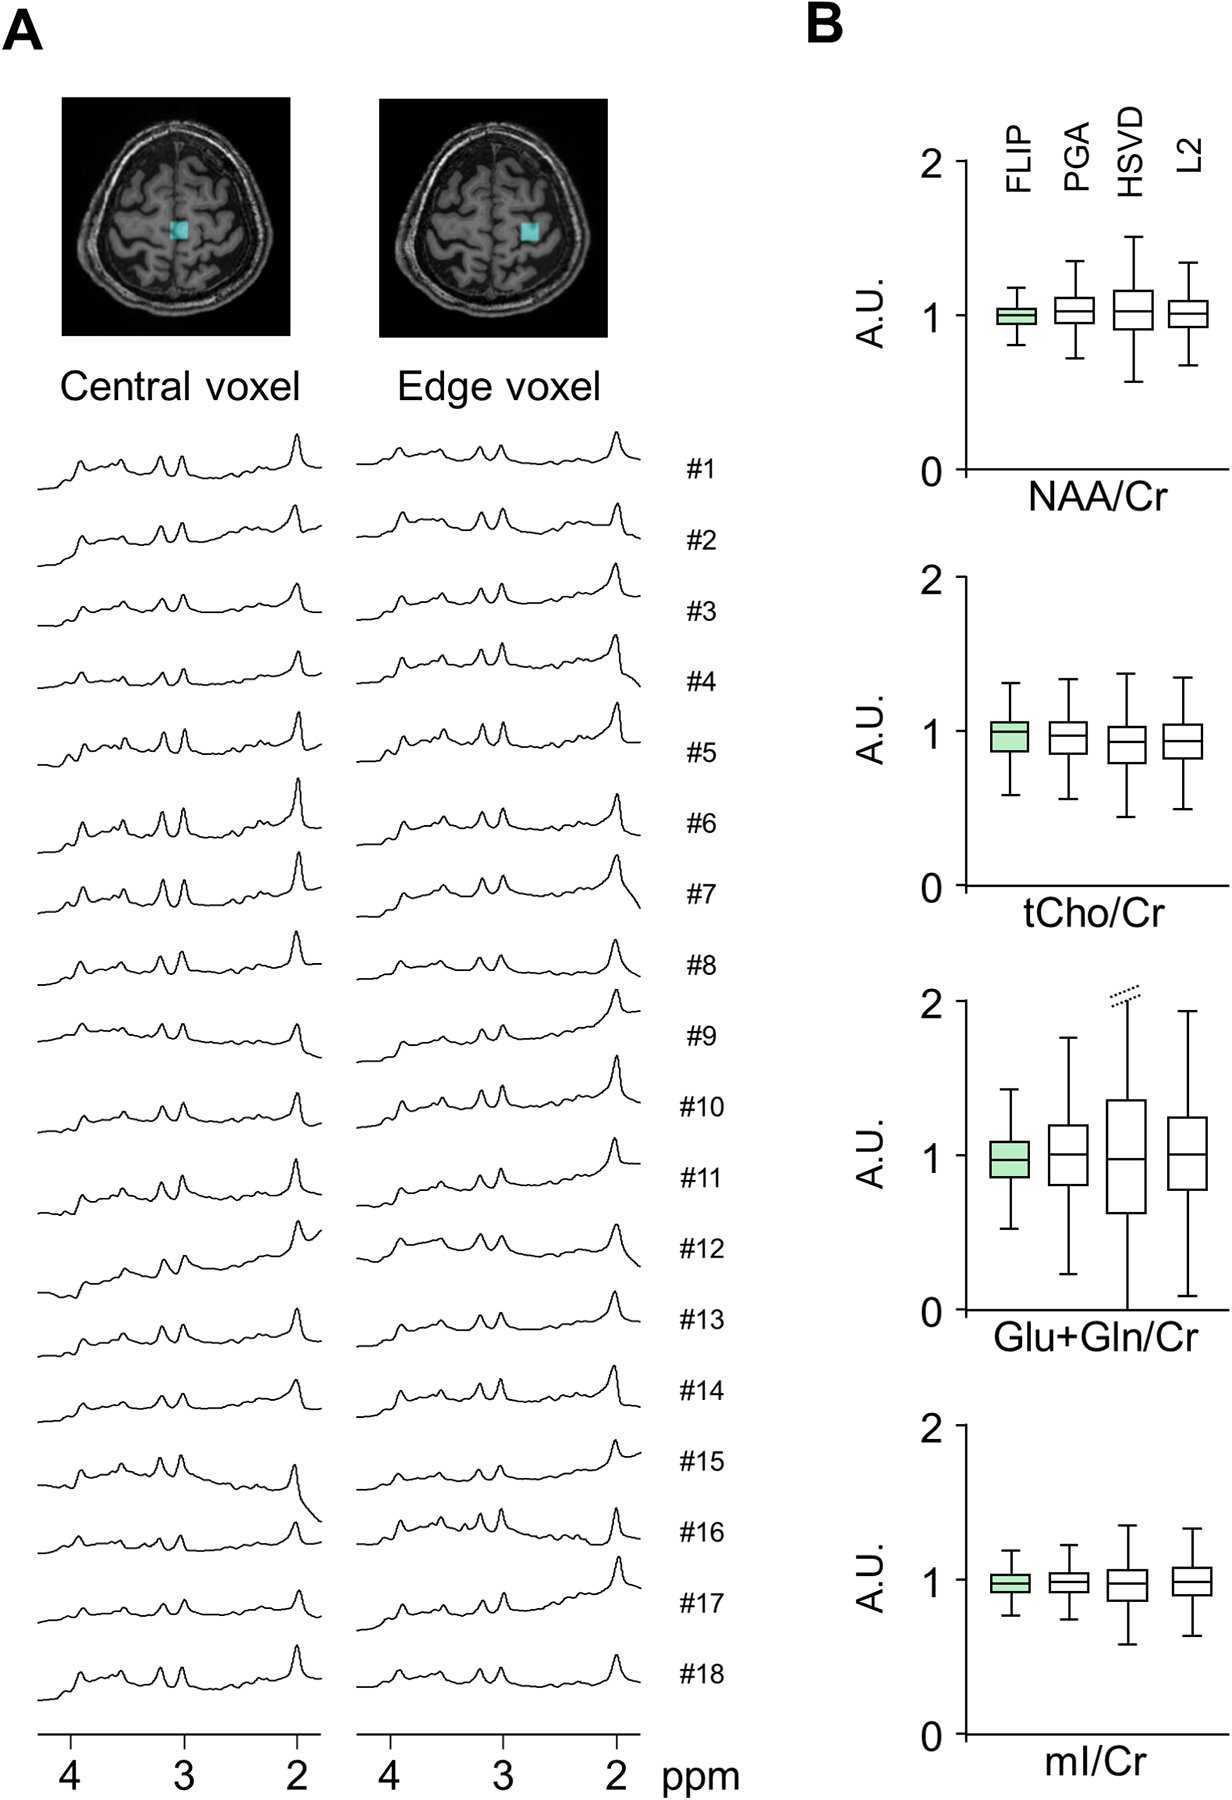
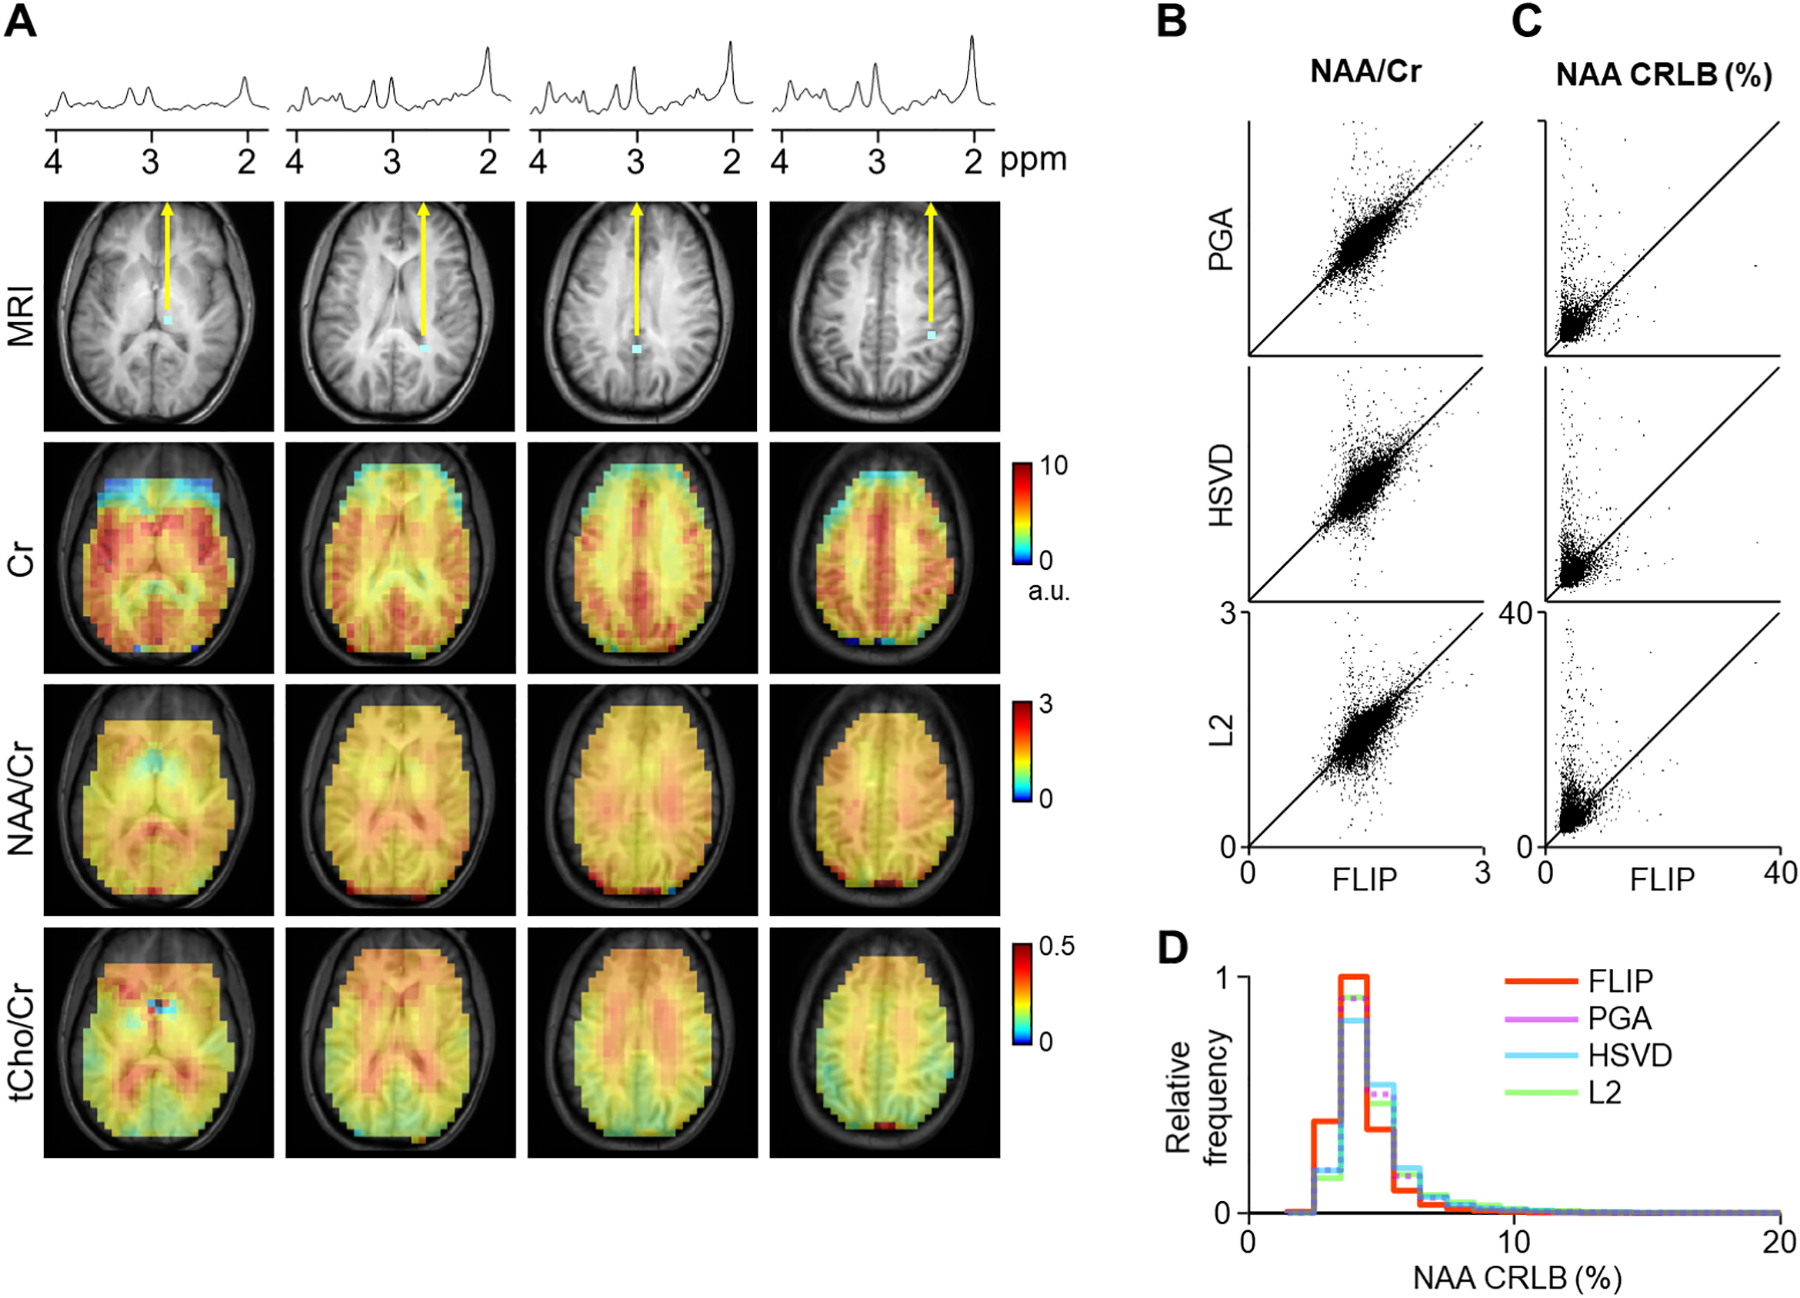
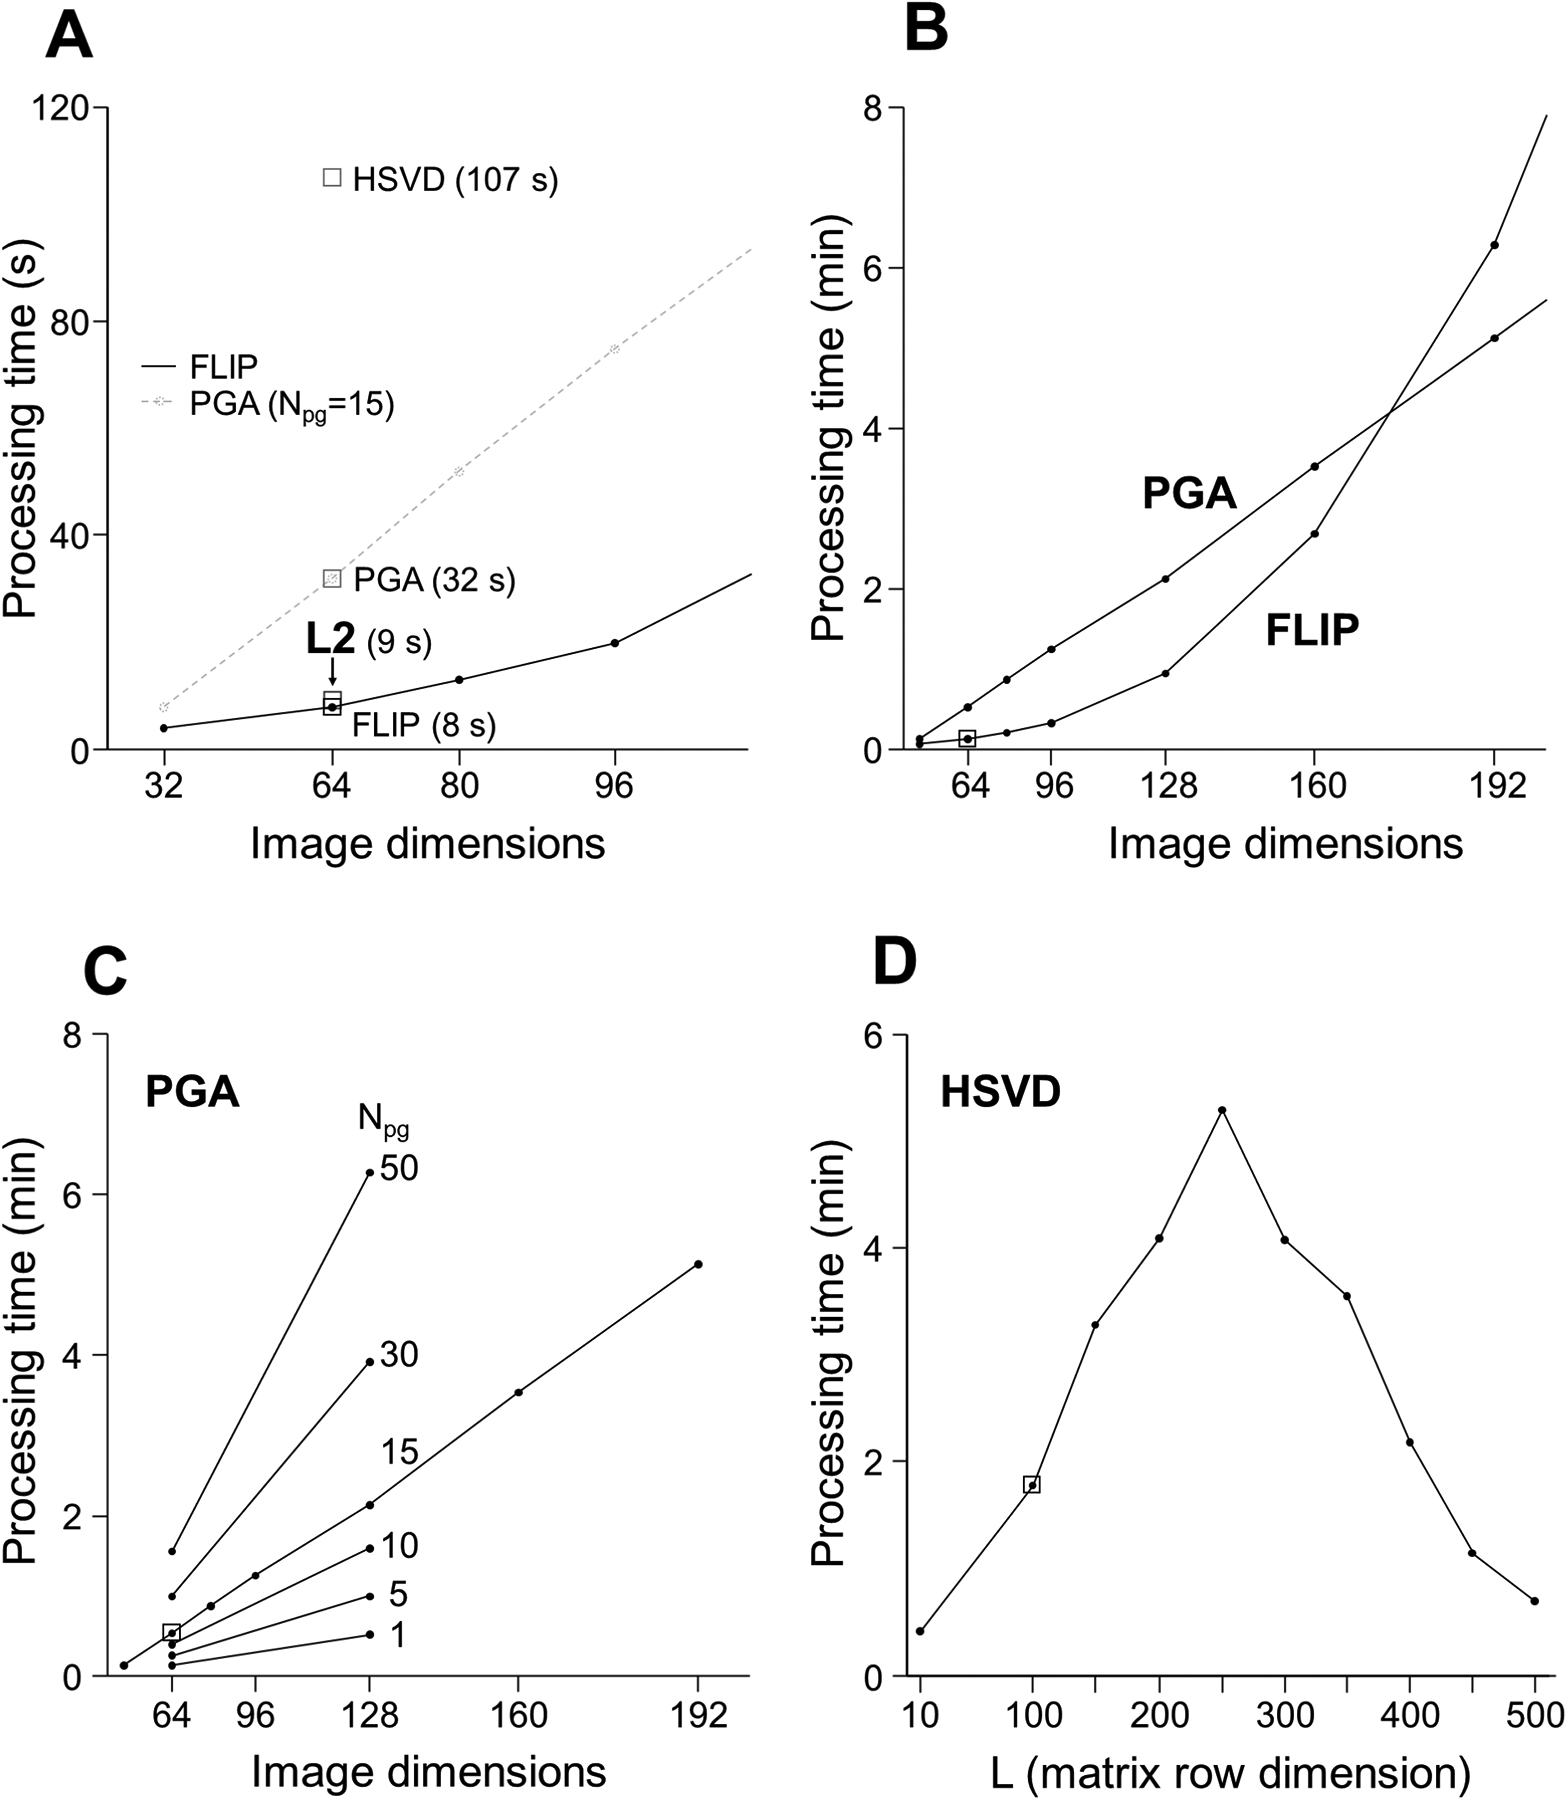
Theory and methods: FLIP uses regularized least-squares regression based on spatial prior information from MRI to selectively remove lipid signals originating from the scalp and measure the brain metabolite signals with minimum cross contamination. FLIP is a noniterative approach, thus allowing a rapid processing speed, and uses only spatial information without any spectral priors. The performance of FLIP was compared with the Papoulis-Gerchberg algorithm (PGA), Hankel singular value decomposition (HSVD), and fast image reconstruction with L2 regularization (L2).

Results: FLIP in both 2D and 3D MRSI resulted in consistent metabolite quantification in a greater number of voxels with less concentration variation than other algorithms, demonstrating effective and robust lipid-removal performance. The percentage of voxels that met quality criteria with FLIP, PGA, HSVD, and L2 processing were 90%, 57%, 29%, and 42% in 2D MRSI, and 80%, 75%, 76%, and 74% in 3D EPSI, respectively. The quantification results of full-FOV MRSI using FLIP were comparable to those of volume-localized MRSI, while allowing significantly increased spatial coverage. FLIP performed the fastest in 2D MRSI.

Conclusion: FLIP is a new lipid-removal algorithm that promises fast and effective lipid removal with improved volume coverage in MRSI.

Keywords: full FOV MRSI; lipid reconstruction; lipid removal; spatial-domain post processing; whole brain MRSI.


Figures

Figure 1.
Figure 1.
Illustration of FLIP concept for lipid removal in 2D MRSI. Scalp and brain masks are generated using multi-slice anatomical MRI (top). The scalp and brain regions are assigned different spatial smoothness defined by a Gaussian spatial function. Next, Fourier Transform and truncation are applied to the Gaussian spatial functions at each mask voxel (middle). The resulting k-space components match the MRSI acquisition. Finally, the modified k-space encoding matrix G is formed with one column for each mask voxel (bottom).
Figure 2.
Figure 2.
Simulation showing the effect of the regularization parameter on the lipid reconstruction characteristics. The regularization parameter can be optimized to balance between lipid removal efficiency (A) and metabolite avoidance (B). Regularization shown on a log scale revealed that a value of 10−7 was suitable for both high efficiency of lipid removal and acceptable metabolite avoidance.
Figure 3.
Figure 3.
MRSI raw spectra are displayed in overlays on T1-weighted MRI (top) along with raw MRSI and extracted lipid data processed by the proposed FLIP algorithm (bottom). The spectral ranges shown are [0, 4.2] ppm. Selected central and edge voxel spectra positions are indicated by blue voxels in the MRI image (A). Raw spectra are shown in black, and reconstructed lipid spectra are overlaid in red (B). The scalp-adjacent spectrum (left) is shown at a 1/5x scale to accommodate the full amplitude of high lipid signals. The amplitudes of lipids were about 15x and 120x greater than those of creatine in the center and edge voxels, respectively.
Figure 4.
Figure 4.
Consistency of lipid removal by FLIP. Example spectra from 18 subjects processed by the proposed lipid removal technique, showing central and edge voxels (A). The proposed method yielded reliably clear metabolite spectra with little residual lipid baselines in all 18 subjects. All spectra were processed using 1.0 Hz Lorentzian line broadening, 0.2 Gaussian broadening, and 0th order phase correction. Group analysis (N=18) of metabolite concentration ratios-to-creatine, normalized by those of FLIP processed data are shown for each processing method (B). Only voxels satisfying the quality criteria of linewidth<0.1 ppm, SNR>3, and CRLB of NAA≤20% were included in the analysis.
Figure 5.
Figure 5.
Performance of lipid removal algorithms (FLIP, PGA, HSVD, and L2) with full FOV MRSI in comparison with restricted VOI MRSI. The central white region (A, left) shows the nominal VOI used for restricted VOI MRSI. The white boxes in MRI (A, middle and right) indicate 5×5 and 7×7 voxel regions used to obtain average metabolite concentrations. All voxels within 5×5 and 7×7 regions were included in data analysis of metabolite-to-creatine ratios (B) or absolute concentrations (C). Box plots show 25 percentile, median, 75 percentile, and extreme values. Mean and variance of metabolite concentrations and their ratios-to-creatine are compared among algorithms in reference to restricted VOI MRSI for the 5×5 region. #: p<0.05; ### p<0.001 with two-tailed paired t-test between concentrations of each voxel from each algorithm and those from VOI (n=25 voxels).
Figure 6.
Figure 6.
Representative spectra and quantitative metabolite maps of high-resolution whole-brain 3D EPSI are shown after lipid removal using FLIP implementation (A). Quantification results of 3D EPSI data are shown from 10 subjects, using FLIP and PGA (B-E). Metabolite maps are shown from four transverse slices of whole-brain 3D EPSI, including the thalamus, white matter, and gray matter. FLIP processing was performed at the native reconstructed EPSI resolution, and k-space apodization was applied prior to spectral fitting with a 1.3 cm effective width (FWHM). Artifacts and dropouts in the anterior region are likely due to the effect of B0 inhomogeneity near the sinus cavity. Scatter plots show (B) NAA/Cr and (C) NAA CRLB (%) with lipid removal by FLIP and PGA. The NAA/Cr and NAA CRLB (%) values are also summarized by histograms (D, E). Results using PGA lipid removal showed a broader spread of NAA/Cr values, suggesting worse quantitative accuracy compared with FLIP. The PGA CRLB values showed worse spectral fitting outcomes than FLIP. Spectral fitting was performed using LCModel on 13,084 voxels. Central four slices of 3D EPSI data were used from each subject, and voxels were restricted to both PGA and FLIP results that have passed the criteria of tissue fraction > 0.5 and linewidth < 0.1 ppm. Voxels with zero concentration have been excluded.
Figure 7.
Figure 7.
Processing time for the FLIP, PGA, HSVD, and L2 algorithms. Small squares indicate the parameters for the fastest processing speed at the best lipid removal efficacy at a given condition (A). FLIP and PGA are parameterized by a base image dimension, equal to the square root of the 2D image size. HSVD was parameterized by the matrix column dimension. The FLIP time was the fastest and depended on a mix of FFT, SVD, and other operations. With high image dimensions greater than ~170, PGA became faster than FLIP (B). The PGA processing time was proportional to the number of iterations as expected (C). The HSVD peak processing time coincided with a maximal, square matrix size (D). The L2 processing time includes preparation steps comparable with portions of the other algorithms, minus additional time used for per-subject parameter calibration. The measured processing times demonstrate a significant speed advantage of the FLIP algorithm.

Similar articles

Cited by

References

    1. Ren J, Dimitrov I, Sherry AD, Malloy CR. Composition of adipose tissue and marrow fat in humans by 1H NMR at 7 Tesla. J Lipid Res. 2008;49(9):2055–2062. - PMC - PubMed
    1. Tkac I, Deelchand D, Dreher W, et al. Water and lipid suppression techniques for advanced 1H MRS and MRSI: Experts’ consensus recommendations. NMR Biomed. 2020;DOI: 10.1002/nbm.4459. - DOI - PMC - PubMed
    1. Pijnappel WWF, Vandenboogaart A, Debeer R, Vanormondt D. SVD-Based Quantification of Magnetic-Resonance Signals. Journal of Magnetic Resonance. 1992;97(1):122–134.
    1. Barkhuijsen H, Debeer R, Vanormondt D. Improved Algorithm for Noniterative Time-Domain Model-Fitting to Exponentially Damped Magnetic-Resonance Signals. Journal of Magnetic Resonance. 1987;73(3):553–557.
    1. Kumaresan R, Tufts DW. Estimating the Parameters of Exponentially Damped Sinusoids and Pole-Zero Modeling in Noise. Ieee Transactions on Acoustics Speech and Signal Processing. 1982;30(6):833–840.

Publication types