. 2021 Sep;8(18):e2101462.
doi: 10.1002/advs.202101462. Epub 2021 Aug 2.

Modeling Sporadic Alzheimer's Disease in Human Brain Organoids under Serum Exposure

Affiliations

Modeling Sporadic Alzheimer's Disease in Human Brain Organoids under Serum Exposure

Xianwei Chen et al. Adv Sci (Weinh). 2021 Sep.

Abstract

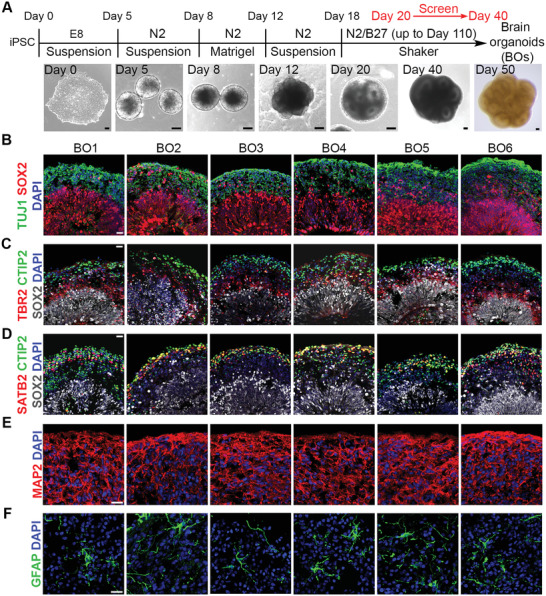
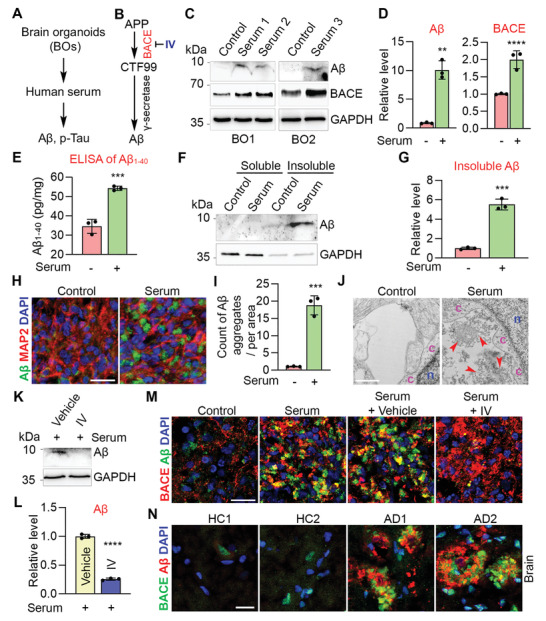
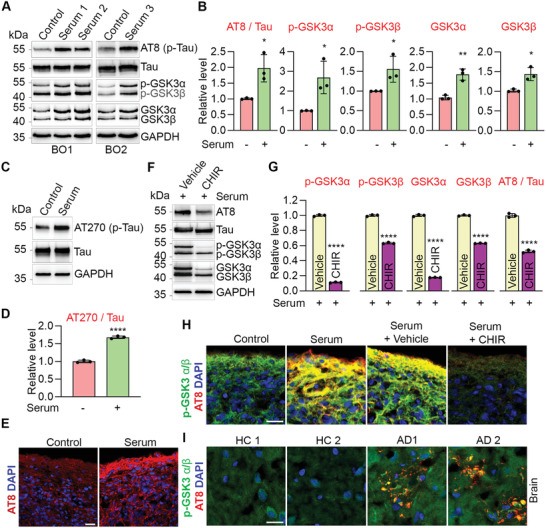
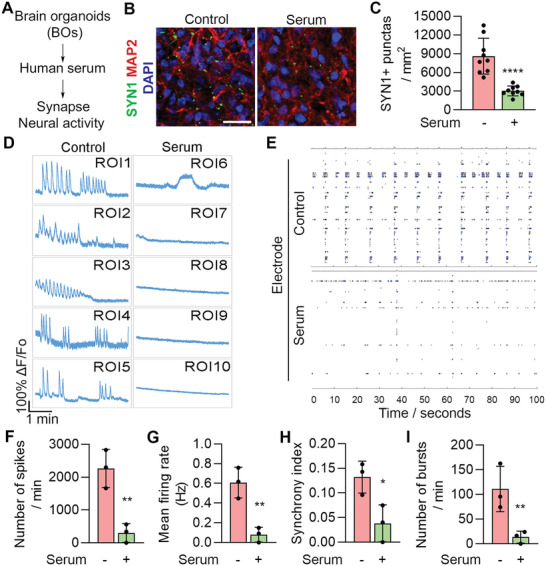
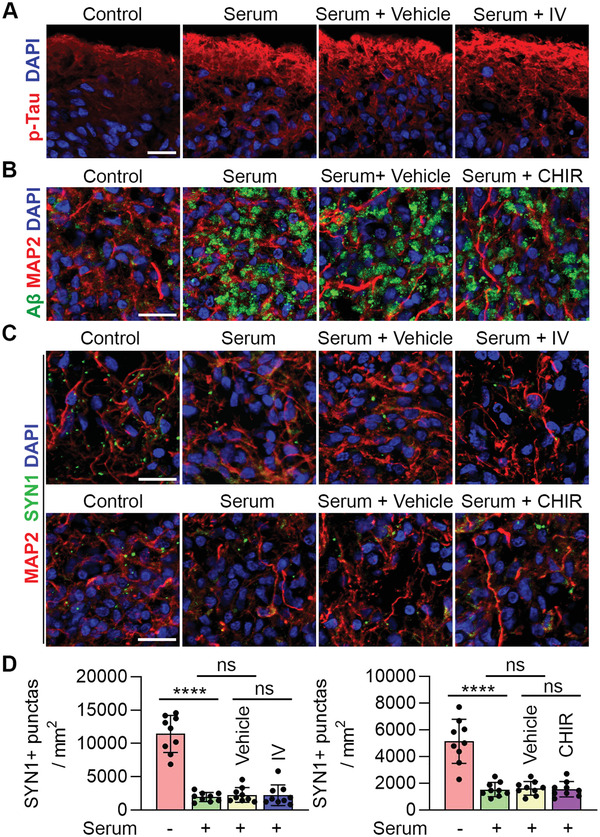
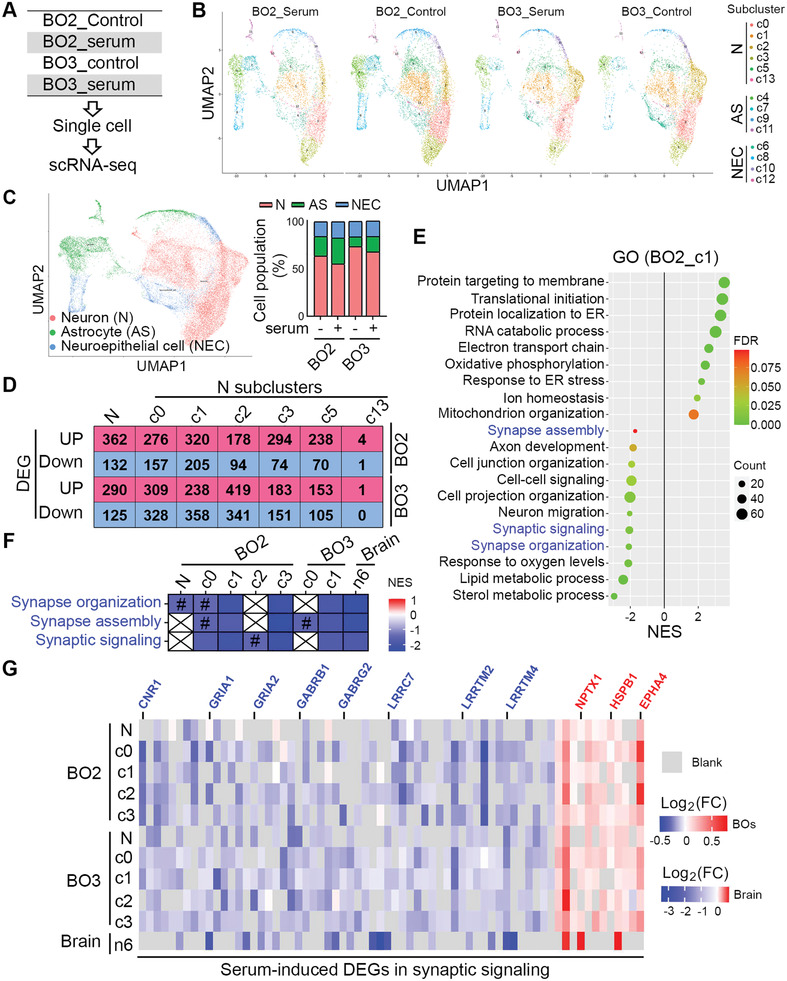
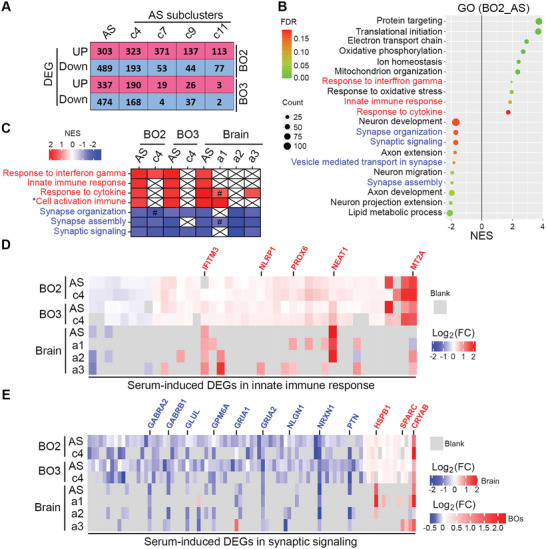
Alzheimer's disease (AD) is a progressive neurodegenerative disease with no cure. Huge efforts have been made to develop anti-AD drugs in the past decades. However, all drug development programs for disease-modifying therapies have failed. Possible reasons for the high failure rate include incomplete understanding of complex pathophysiology of AD, especially sporadic AD (sAD), and species difference between humans and animal models used in preclinical studies. In this study, sAD is modeled using human induced pluripotent stem cell (hiPSC)-derived 3D brain organoids. Because the blood-brain barrier (BBB) leakage is a well-known risk factor for AD, brain organoids are exposed to human serum to mimic the serum exposure consequence of BBB breakdown in AD patient brains. The serum-exposed brain organoids are able to recapitulate AD-like pathologies, including increased amyloid beta (Aβ) aggregates and phosphorylated microtubule-associated tau protein (p-Tau) level, synaptic loss, and impaired neural network. Serum exposure increases Aβ and p-Tau levels through inducing beta-secretase 1 (BACE) and glycogen synthase kinase-3 alpha / beta (GSK3α/β) levels, respectively. In addition, single-cell transcriptomic analysis of brain organoids reveals that serum exposure reduced synaptic function in both neurons and astrocytes and induced immune response in astrocytes. The human brain organoid-based sAD model established in this study can provide a powerful platform for both mechanistic study and therapeutic development in the future.

Keywords: brain organoids; disease modeling; induced pluripotent stem cells; serum exposure; sporadic Alzheimer's disease.


Conflict of interest statement

T.G.B. has contract research with Avid Radiopharmaceuticals. E.M.R. is a scientific advisor to Alkahest, Alzheon, Aural Analytics, Denali, Green Valley, MagQ, Takeda and United Neuroscience. E.M.R. is an advisor to Roche/Roche Diagnostics and Cerveaux (expenses only). E.M.R. is co‐founder and shareholder of AlzPath, a new company which aims to advance the role of blood‐based biomarkers for Alzheimer's disease research, drug development and care. M.B.J. is a co‐inventor of patent WO/2018/160496 related to differentiation of human pluripotent stem cells into microglia. D.M.H. is as an inventor on a patent licensed by Washington University to C2N Diagnostics on the therapeutic use of anti‐tau antibodies. D.M.H. co‐founded and is on the scientific advisory board of C2N Diagnostics. C2N Diagnostics has licensed certain anti‐tau antibodies to AbbVie for therapeutic development. D.M.H. is on the scientific advisory board of Denali and consults for Genentech, Merck, and Cajal Neuroscience.

Figures

Figure 1
Figure 1
Generation and characterization of hiPSCs‐derived brain organoids. A) Schematic illustration of brain organoid protocol and representative phase images at different stages. Scale bar, 100 µm. B) Immunostaining of the neural progenitor marker SOX2 and the neuronal marker TUJ1 in brain organoids at day 50–60. C) Immunostaining of SOX2, the intermediate progenitor marker TBR2, and the cortical deep layer marker CTIP2 in brain organoids at day 50–60. D) Images of immunostaining of SOX2, CTIP2, and the cortical upper layer marker SATB2 in brain organoids at day 50–60. E) Immunostaining of the neuronal marker MAP2 in brain organoids at day 90. F) Immunostaining of the astrocyte marker GFAP in brain organoids at day 110. B–F) Scale bar, 20 µm.
Figure 2
Figure 2
Serum exposure induces Aβ‐like pathology through increasing BACE abundance. A) Schematics of modeling AD pathologies using BOs. B) Schematics of amyloidogenic APP processing pathway. IV: BACE inhibitor. C) Western blot of Aβ (D54D2), BACE and GAPDH in BOs treated without (control) or with serum. Each lyaste was from pooled 3–5 individual BOs. D) Quantification of Aβ (D54D2) and BACE levels and normalized to GAPDH. n = three experiments in BO1 and BO2. E) ELISA of Aβ 1‐40 in control and serum‐treated BO6. Each lysate was from pooled 5–10 individual BOs. n = three experimental repeats. F) Western blot of soluble and insoluble Aβ (D54D2) in control and serum‐treated BO1. Each lysate was from pooled 7–10 individual BOs. G) Quantification of insoluble Aβ and normalized to GAPDH. n = 3 quantitative repeats. H) Immunostaining of Aβ (D54D2) and MAP2 in control and serum‐treated BO1. I) Counts of Aβ aggregates in (H). n = 3 images from three individual BOs. J) Transmission electron microscopy (TEM) of control and serum‐treated BO2. n: nucleus, c: cytoplasm; arrowhead: extracellular aggregate. K) Western blot of Aβ (D54D2) and GAPDH in BO2 treated with vehicle, or inhibitor IV under serum exposure. Each lysate was from pooled 6–7 individual BOs. L) Quantification of Aβ level in (K) and normalized to GAPDH. n = 3 quantitative repeats. M) Immunostaining of Aβ (D54D2) and BACE in BO1 of control, serum‐treated, and serum plus vehicle or inhibitor IV treatment. N) Immunostaining for Aβ (6E10) and BACE in cortex of AD patients and healthy controls (HC). D,E,G,I,L) Error bars are SD of the mean, **p < 0.01, ***p < 0.001 and ****p < 0.0001 by unpaired two‐tailed t‐test. Scale bar: 20 µm for panels (H, M, N); 1 µm for panel (J).
Figure 3
Figure 3
Serum exposure induces p‐Tau through GSK3α/β. A) Western blot of p‐Tau (AT8), Tau, p‐GSK3α/β, GSK3α/β and GAPDH in BOs treated without (control) or with serum. Each lyaste was from pooled 3–5 individual BOs. B) Quantification of p‐Tau (AT8), p‐GSK3α, p‐GSK3β, GSK3α, and GSK3β levels. p‐Tau was normalized to total Tau and the others were normalized to GAPDH. n = three experiments in BO1 and BO2. C) Western blot of p‐Tau (AT270), Tau and GAPDH in control and serum‐treated BO1. Each lyaste was from pooled 3–5 individual BOs. D) Quantification of p‐Tau (AT270) level and normalized to total Tau. n = 3 quantitative repeats. E) Immunostaining for p‐Tau (AT8) in control and serum‐treated BO2. F) Western blot of p‐Tau (AT8), Tau, p‐GSK3α/β, GSK3α/β and GAPDH in BO2 treated with vehicle, or GSK3α/β inhibitor CHIR99021 (CHIR) under serum exposure. G) Quantification of p‐GSK3α/β, GSK3α/β and p‐Tau (AT8) levels. p‐Tau (AT8) was normalized to total Tau and the others were normalized to GAPDH. n = 3 quantitative repeats. H) Immunostaining for p‐Tau (AT8) and p‐GSK3α/β in BO2 treated with vehicle control, serum, serum plus vehicle or serum plus CHIR treatment. I) Immunostaining for p‐Tau (AT8) and p‐GSK3α/β in cortex of AD patients and healthy controls (HC). E,H,I) Scale bar, 20 µm. B,D,G) Error bars are SD of the mean; *p < 0.05, **p < 0.01, and ****p < 0.0001 by unpaired two‐tailed t‐test.
Figure 4
Figure 4
Serum exposure induces synaptic loss and reduces neural function. A) Schematics of modeling AD pathologies using brain organoids. B) Immunostaining for SYN1 and MAP2 in control and serum‐treated BO1. Scale bar, 20 µm. C) Quantification of SYN1+ synaptic punctas. n = 9 images from three individual BOs, with 3 sections per BO. D) Calcium imaging of BO4 treated without (control) or with serum for 7 days. The fluorescence intensity in five regions of interest (ROI) is shown. E) MEA analysis of BO2 treated without (control) or with serum for 7 days. Graphs illustrate MEA recording generated from the raw data of a spike raster plot, using the number of spikes recorded over 100 s. F–I) Quantification of the MEA parameters. n = 3 experimental repeats. C,F–I) Error bars are SD of the mean; *p < 0.05, **p < 0.01 and ****p < 0.0001 by unpaired two‐tailed t‐test.
Figure 5
Figure 5
Response of brain organoids to compound treatment under serum exposure. A) Immunostaining for p‐Tau (AT8) in BO1 treated with control (no serum), serum, serum plus vehicle or serum plus inhibitor IV. B) Immunostaining for Aβ (D54D2) and MAP2 in BO5 treated with control (no serum), serum, serum plus vehicle or serum plus inhibitor CHIR. C) Immunostaining for SYN1 and MAP2 in BO1 (upper panel) and BO5 (lower panel) treated with control (no serum), serum, serum plus vehicle, serum plus inhibitor IV (upper panel) or serum plus CHIR (lower panel). D) Quantification of SYN1+ synaptic punctas. Error bars are SD of the mean; n = 9 images from three individual BOs, with 3 sections per BO. ns: not significant, ****p < 0.0001 by unpaired two‐tailed t‐test. A–C) Scale bars, 20 µm.
Figure 6
Figure 6
Serum exposure reduced synaptic function in neurons of brain organoids revealed by scRNA‐seq. A) Schematics of scRNA‐seq of BOs treated without (control) and with serum for 13–14 days. Single cells of each group were from pooled 3–5 individual BOs. B) UMAP visualization showing subcluster of neurons (N), astrocytes (AS) and neuroepithelial cells (NEC) in BO2 and BO3. C) UMAP visualization showing clustering of single cell colored by cell types. The composition of cells is shown in each sample. D) Number of differentially expressed genes (DEGs) in neurons (N) and neural subclusters that were up‐ or down‐regulated in serum‐treated BOs. E) GSEA result (Gene Ontology, GO) using DEGs of neural c1 subcluster in BO2. p‐Value < 0.05. F) Three GO categories related to synaptic function are shown in neuron and neural subclusters of BOs and AD cortex published by Grubman et al. Colored by NES value for each category. p‐value < 0.05 except labeled with #. #: p‐Value larger than 0.05 and less than 0.1. G) Neural DEGs involved in synaptic functions from both BOs (p‐value < 0.05) and AD cortex (FDR < 0.05) published by Grubman et al. Colored by Log2(FC) values. FC: fold change.
Figure 7
Figure 7
Serum exposure induces AD features in astrocytes of brain organoids as revealed by scRNA‐seq. A) The DEG numbers of astrocytes (AS) and AS subclusters that was up‐ or down‐regulated in serum‐treated BOs. B) GSEA result using DEGs of AS in BO2. FDR < 0.05. C) Multiple GO categories related to immune response and synaptic function are shown in astrocytes (AS) and AS subclusters of serum‐treated BOs and AD cortex published by Grubman et al. Colored by NES value for each category. pvalue < 0.05 except labeled with #. #: p‐value larger than 0.05 and less than 0.1. * indicates full name: cell activation involved in immune response. D) DEGs of AS involved in immune response from both serum‐treated BOs and AD cortex published by Grubman et al. Colored by Log2(FC) values. E) DEGs of AS involved in synaptic functions from both serum‐treated BOs (p‐value < 0.05) and AD cortex (FDR<0.05) published by Grubman et al. Colored by Log2(FC) values. FC: fold change.

References

    1. Gaugler J., James B., Johnson T., Marin A., Weuve J., Assoc A. s., Alzheimers Dementia 2019, 15, 321.
    1. a) Liu C. C., Liu C. C., Kanekiyo T., Xu H., Bu G., Nat. Rev. Neurol. 2013, 9, 106; - PMC - PubMed
    2. b) Campion D., Dumanchin C., Hannequin D., Dubois B., Belliard S., Puel M., Thomas‐Anterion C., Michon A., Martin C., Charbonnier F., Raux G., Camuzat A., Penet C., Mesnage V., Martinez M., Clerget‐Darpoux F., Brice A., Frebourg T., Am. J. Hum. Genet. 1999, 65, 664; - PMC - PubMed
    3. c) Sasaguri H., Nilsson P., Hashimoto S., Nagata K., Saito T., De Strooper B., Hardy J., Vassar R., Winblad B., Saido T. C., EMBO J. 2017, 36, 2473; - PMC - PubMed
    4. d) Long J. M., Holtzman D. M., Cell 2019, 179, 312. - PMC - PubMed
    1. a) Zhang L., Chen C., Mak M. S., Lu J., Wu Z., Chen Q., Han Y., Li Y., Pi R., Med. Res. Rev. 2020, 40, 431; - PubMed
    2. b) Drummond E., Wisniewski T., Acta Neuropathol. 2017, 133, 155; - PMC - PubMed
    3. c) Yiannopoulou K. G., Anastasiou A. I., Zachariou V., Pelidou S. H., Biomedicines 2019, 7, 97. - PMC - PubMed
    1. a) Takahashi K., Tanabe K., Ohnuki M., Narita M., Ichisaka T., Tomoda K., Yamanaka S., Cell 2007, 131, 861. - PubMed
    2. b) Yu J., Vodyanik M. A., Smuga‐Otto K., Antosiewicz‐Bourget J., Frane J. L., Tian S., Nie J., Jonsdottir G. A., Ruotti V., Stewart R., Slukvin I. I., Thomson J. A., Science 2007, 318, 1917. - PubMed
    1. a) Shi Y., Inoue H., Wu J. C., Yamanaka S., Nat. Rev. Drug Discovery 2017, 16, 115; - PMC - PubMed
    2. b) Rowe R. G., Daley G. Q., Nat. Rev. Genet. 2019, 20, 377; - PMC - PubMed
    3. c) Li L., Tian E., Chen X., Chao J., Klein J., Qu Q., Sun G., Sun G., Huang Y., Warden C. D., Ye P., Feng L., Li X., Cui Q., Sultan A., Douvaras P., Fossati V., Sanjana N. E., Riggs A. D., Shi Y., Cell Stem Cell 2018, 23, 239. - PMC - PubMed

Publication types

MeSH terms