Patterns of differentiation of renin lineage cells during nephrogenesis
- PMID: 34338032
- PMCID: PMC8906827
- DOI: 10.1152/ajprenal.00151.2021
Patterns of differentiation of renin lineage cells during nephrogenesis
Abstract
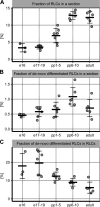
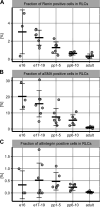
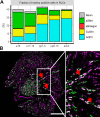
Developmentally heterogeneous renin-expressing cells serve as progenitors for mural, glomerular, and tubular cells during nephrogenesis and are collectively termed renin lineage cells (RLCs). In this study, we quantified different renal vascular and tubular cell types based on specific markers and assessed proliferation and de novo differentiation in the RLC population. We used kidney sections of mRenCre-mT/mG mice throughout nephrogenesis. Marker positivity was evaluated in whole digitalized sections. At embryonic day 16, RLCs appeared in the developing kidney, and the expression of all stained markers in RLCs was observed. The proliferation rate of RLCs did not differ from the proliferation rate of non-RLCs. RLCs expanded mainly by de novo differentiation (neogenesis). Fractions of RLCs originating from the stromal progenitors of the metanephric mesenchyme (renin-producing cells, vascular smooth muscle cells, and mesangial cells) decreased during nephrogenesis. In contrast, aquaporin-2-positive RLCs in the collecting duct system, which embryonically emerges almost exclusively from the ureteric bud, expanded postpartum. The cubilin-positive RLC fraction in the proximal tubule, deriving from the cap mesenchyme, remained constant. In summary, RLCs were continuously detectable in the vascular and tubular compartments of the kidney during nephrogenesis. Therein, various patterns of RLC differentiation that depend on the embryonic origin of the cells were identified.NEW & NOTEWORTHY The unifying feature of the renal renin lineage cells (RLCs) is their origin from renin-expressing progenitors. RLCs evolve to an embryologically heterogeneous large population in structures with different ancestry. RLCs are also targets for the widely used renin-angiotensin-system blockers, which modulate their phenotype. Unveiling the different differentiation patterns of RLCs in the developing kidney contributes to understanding changes in their cell fate in response to homeostatic challenges and the use of antihypertensive drugs.
Keywords: differentiation; immunofluorescence; nephrogenesis; renin lineage cells.
Conflict of interest statement
No conflicts of interest, financial or otherwise, are declared by the authors.
Figures


Similar articles
-
Flexible and multifaceted: the plasticity of renin-expressing cells.Pflugers Arch. 2022 Aug;474(8):799-812. doi: 10.1007/s00424-022-02694-8. Epub 2022 May 5. Pflugers Arch. 2022. PMID: 35511367 Free PMC article. Review.
-
Persistent and inducible neogenesis repopulates progenitor renin lineage cells in the kidney.Kidney Int. 2017 Dec;92(6):1419-1432. doi: 10.1016/j.kint.2017.04.014. Epub 2017 Jul 6. Kidney Int. 2017. PMID: 28688581 Free PMC article.
-
Progenitor Renin Lineage Cells are not involved in the regeneration of glomerular endothelial cells during experimental renal thrombotic microangiopathy.PLoS One. 2018 May 17;13(5):e0196752. doi: 10.1371/journal.pone.0196752. eCollection 2018. PLoS One. 2018. PMID: 29771991 Free PMC article.
-
Osr1 expression demarcates a multi-potent population of intermediate mesoderm that undergoes progressive restriction to an Osr1-dependent nephron progenitor compartment within the mammalian kidney.Dev Biol. 2008 Dec 1;324(1):88-98. doi: 10.1016/j.ydbio.2008.09.010. Epub 2008 Sep 19. Dev Biol. 2008. PMID: 18835385 Free PMC article.
-
Epigenetic States of nephron progenitors and epithelial differentiation.J Cell Biochem. 2015 Jun;116(6):893-902. doi: 10.1002/jcb.25048. J Cell Biochem. 2015. PMID: 25560433 Free PMC article. Review.
Cited by
-
Flexible and multifaceted: the plasticity of renin-expressing cells.Pflugers Arch. 2022 Aug;474(8):799-812. doi: 10.1007/s00424-022-02694-8. Epub 2022 May 5. Pflugers Arch. 2022. PMID: 35511367 Free PMC article. Review.
-
A Possible Link between Cell Plasticity and Renin Expression in the Collecting Duct: A Narrative Review.Int J Mol Sci. 2024 Sep 3;25(17):9549. doi: 10.3390/ijms25179549. Int J Mol Sci. 2024. PMID: 39273497 Free PMC article. Review.
References
-
- Taugner R, Hackenthal E. The Juxtaglomerular Apparatus. Berlin/Heidelberg, Germany: Springer-Verlag, 1989.
Publication types
MeSH terms
Substances
Associated data
Grants and funding
LinkOut - more resources
Full Text Sources
Molecular Biology Databases
Miscellaneous

