. 2022 Apr;18(4):799-815.
doi: 10.1080/15548627.2021.1956123. Epub 2021 Aug 2.

Exendin-4 stimulates autophagy in pancreatic β-cells via the RAPGEF/EPAC-Ca2+-PPP3/calcineurin-TFEB axis

Affiliations

Exendin-4 stimulates autophagy in pancreatic β-cells via the RAPGEF/EPAC-Ca2+-PPP3/calcineurin-TFEB axis

Francesco P Zummo et al. Autophagy. 2022 Apr.

Abstract

Macroautophagy/autophagy is critical for the regulation of pancreatic β-cell mass and its deregulation has been implicated in the pathogenesis of type 2 diabetes (T2D). We have previously shown that treatment of pancreatic β-cells with the GLP1R (glucagon like peptide 1 receptor) agonist exendin-4 stimulates autophagic flux in a setting of chronic nutrient excess. The aim of this study was to identify the underlying pathways contributing to enhanced autophagic flux.Pancreatic β-cells (INS-1E),mouse and human islets were treated with glucolipotoxic stress (0.5 mM palmitate and 25 mM glucose) in the presence of exendin-4. Consistent with our previous work, exendin-4 stimulated autophagic flux. Using chemical inhibitors and siRNA knockdown, we identified RAPGEF4/EPAC2 (Rap guanine nucleotide exchange factor 4) and downstream calcium signaling to be essential for regulation of autophagic flux by exendin-4. This pathway was independent of AMPK and MTOR signaling. Further analysis identified PPP3/calcineurin and its downstream regulator TFEB (transcription factor EB) as key proteins mediating exendin-4 induced autophagy. Importantly, inhibition of this pathway prevented exendin-4-mediated cell survival and overexpression of TFEB mimicked the cell protective effects of exendin-4 in INS-1E and human islets. Moreover, treatment of db/db mice with exendin-4 for 21 days increased the expression of lysosomal markers within the pancreatic islets. Collectively our data identify the RAPGEF4/EPAC2-calcium-PPP3/calcineurin-TFEB axis as a key mediator of autophagic flux, lysosomal function and cell survival in pancreatic β-cells. Pharmacological modulation of this axis may offer a novel therapeutic target for the treatment of T2D.Abbreviations: AKT1/protein kinase B: AKT serine/threonine kinase 1; AMPK: 5' AMP-activated protein kinase; CAMKK: calcium/calmodulin-dependent protein kinase kinase; cAMP: cyclic adenosine monophosphate; CASP3: caspase 3; CREB: cAMP response element-binding protein; CTSD: cathepsin D; Ex4: exendin-4(1-39); GLP-1: glucagon like peptide 1; GLP1R: glucagon like peptide 1 receptor; GLT: glucolipotoxicity; INS: insulin; MTOR: mechanistic target of rapamycin kinase; NFAT: nuclear factor of activated T-cells; PPP3/calcineurin: protein phosphatase 3; PRKA/PKA: protein kinase cAMP activated; RAPGEF3/EPAC1: Rap guanine nucleotide exchange factor 3; RAPGEF4/EPAC2: Rap guanine nucleotide exchange factor 4; SQSTM1/p62: sequestosome 1; T2D: type 2 diabetes; TFEB: transcription factor EB.

Keywords: Autophagy; GLP1R agonists; PPP3/calcineurin; RAPGEF4; TFEB; diabetes; pancreatic β-cell.


Conflict of interest statement

No potential conflict of interest was reported by the author(s).

Figures

Figure 1.
Figure 1.
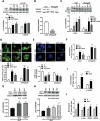
Exendin-4 stimulates autophagic flux via a PRKA-independent mechanism. (A) INS-1E treated with glucolipotoxicity (GLT, 25 mM glucose and 0.5 mM palmitate) without or with 100 nM Ex4 for 6 h. LC3 was analyzed by western blotting, quantified as LC3-II:GAPDH ratio. n = 6. (B and C) INS-1E were pre-incubated with 10 nM AKT inhibitor VIII (AKTi) for 1 h prior to the addition of glucolipotoxicity (GLT) without or with 100 nM Ex4 for 6 h. Changes in protein expression or phosphorylation were analyzed by western blotting, quantified relative to total AKT (B) or GAPDH (C). n = 5 (B) or 4 (C). (D) INS-1E were pre-incubated with 50 μM Rp-cAMPs for 1 h prior to the addition of 100 nM Ex4 for 30 min. p-CREB and total CREB were analyzed by western blotting and quantified as p-CREB/CREB ratio. n = 4. (E) INS-1E were pre-incubated with 50 μM Rp-cAMPs for 1 h prior to the addition of GLT -/+ Ex4 for 6 h. LC3 was analyzed by western blotting and quantified as LC3-II:GAPDH ratio. n = 6. (F-H) INS-1E (F), mouse (G), or human (H) islets were pre-incubated with 10 μM ESI-09 for 1 h prior to the addition of GLT -/+ Ex4 for either 6 (F) or 48 h (G and H). LC3 was analyzed by western blotting and quantified as LC3-II:GAPDH ratio. n = 4 (F and H) or 6 (G). Results are expressed as raw densitometry units corrected for the loading control as stated. All data are mean ± SEM of four to six individual experiments. Statistical analysis was performed using one-way (A, B, G, H) or two-way ANOVA (C, D, E, F) followed by Bonferroni’s post-hoc test. * P < 0.05, **P < 0.01 effect of GLT vs control; #P < 0.05, ##P < 0.01; ^ P < 0.05, ^^P < 0.01, ^^^P < 0.005 effect of inhibitor.
Figure 2.
Figure 2.
Exendin-4 stimulates autophagic flux via RAPGEF4 signaling. (A) INS-1E were pre-incubated with 10 μM ESI-05 for 1 h prior to the addition of GLT -/+ Ex4 for 6 h. LC3 was analyzed by western blotting and quantified as LC3-II:GAPDH ratio. n = 6. (B-F) INS-1E (B, C, E and F) or INS-1E stably expressing mCherry-GFP-LC3 (D) were treated with scrambled siRNA (siScr) or siRNA against Rapgef4 isoform A (siRapgef4) for 48 h prior to treatment with GLT -/+ Ex4 for 4 (D), 6 (B and C) or 18 h (E and F). (B) RAPGEF protein was analyzed by western blotting and quantified as RAPGEF:GAPDH ratio. n = 6. (C) LC3 was analyzed by western blotting and quantified as LC3-II:GAPDH ratio. n = 4. (D) Autophagic flux was assessed by live cell imaging of mCherry-GFP-LC3 and quantified by measurement of co-localizing red and green (yellow) puncta using Volocity software. n = 5. (E) Lysosomal function was assessed by immunostaining for CTSD (green) and puncta intensity quantified using Blobfinder software. n = 5. (F) Cell death was assessed by PI-Hoechst staining and quantified as PI-positive cells relative to total cell number. n = 3. (G-J) INS-1E were treated with GLT -/+ 100 nM Ex4, 10 μM 8-CPT-2Me-cAMP (8-CPT), 10 µM Sp-8-BnT-cAMPS (S220) or 10 µM Sp-8-BnT-2ʹ-O-Me-cAMPS (S223) for 6 h. (G and H) LC3 was analyzed by western blotting and quantified as LC3-II:GAPDH ratio. n = 5. (I and J) Cell death was assessed by PI-Hoechst staining and quantified as positive cells relative to total cell number. n = 5. Results are expressed as raw densitometry units corrected for the loading control as stated or normalized to control and expressed as fold change. All data are mean ± SEM of three to six individual experiments. Statistical analysis was performed using an unpaired t-test (B) or a one-way (G and H) or two-way ANOVA (A, C, D, E, F, I, J) followed by Bonferroni’s post-hoc test. *P < 0.05, **P < 0.01, ***P < 0.005 effect of GLT; #P < 0.05 effect of Ex4; ^P < 0.05, ^^P < 0.01, ^^^P < 0.005 effect of knockdown; ~P < 0.05, ~~P < 0.01, ~~~P < 0.005 effect of agonist. Scale bars: 10 µm.
Figure 3.
Figure 3.
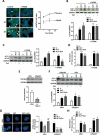
Exendin-4 stimulates autophagy via calcium signaling. (A) INS-1E were pre-incubated with 2 μM Fluo-8 AM for 35 min followed by 20 min washout with Krebs-HEPES. Cells were stimulated with either 15 mM glucose (media) or 15 mM glucose + 100 nM Ex4. Changes in fluorescence were detected by fluorescence microscopy and expressed as ΔF/F0. Graphs are representative of four individual experiments. (B and C) INS-1E were pre-incubated with 10 μM BAPTA-AM for 1 h prior to the addition of GLT -/+ Ex4 for either 6 (B) or 18 h (C). (B) LC3 was analyzed by western blotting and quantified as LC3-II:GAPDH ratio. (C) Lysosomal function was assessed by immunostaining for CTSD and puncta intensity quantified using Blobfinder software. Results are normalized to control and expressed as fold change. n = 6 (B) or 5 (C). (D) INS-1E were pre-incubated with 2 μM Fluo-8 AM for 35 min followed by 20 min washout with Krebs-HEPES. Cells were stimulated with 1 μM Ionomycin (Iono) and analyzed as described in (A). Graph is representative of three experiments. (E) INS-1E were treated with GLT -/+ Ex4 or 1 μM Ionomycin for 6 h. LC3 was analyzed by western blotting, quantified as LC3-II:GAPDH ratio and expressed relative to control. n = 6. (F-I) INS-1E were treated with scrambled siRNA (siScr) or siRNA against Rap1a and Rap1b (siRap1ab) for 48 h prior to treatment with GLT -/+ Ex4 for 6 (H) or 18 h (I). (F) Rap1 mRNA expression was analyzed by RT-PCR and quantified as either Rap1a or Rap1b corrected for Ppia/cyclophilin a and expressed as % of siScr control. n = 4. (G) RAP1 protein expression was analyzed by western blotting using an antibody specific for both RAP1A and RAP1B isoforms. RAP1 expression is quantified as RAP1:GAPDH ratio. n = 6. (H) LC3 was analyzed by western blotting and quantified as LC3-II:GAPDH ratio. n = 5. (I) Cell death was assessed by PI-Hoechst staining and quantified as PI positive cells relative to total cell number. n = 6. Results are expressed as raw densitometry units corrected for the loading control as stated or normalized to control and expressed as fold change. All data are mean ± SEM of three to six individual experiments. Statistical analysis was performed using an unpaired t-test (F and G), or a one-way (E) or two-way ANOVA (B, C, H, I) followed by Bonferroni’s post-hoc test. *P < 0.05, ***P < 0.005 effect of GLT; #P < 0.05 effect of Ex4; ~P < 0.05 effect of Iono, ^^^P < 0.05 effect of knockdown. Scale bars: 10 µm.
Figure 4.
Figure 4.
Exendin-4 stimulates autophagy independently of MTOR and AMPK signaling. (A-C) INS-1E were treated with GLT -/+ Ex4 for 2 h. Western blotting was used to quantify p-MTOR (S2448) (A), p-RPS6 (S240/244) (B) and p-PRKAA/AMPKα (T174) (C) and quantified relative to total MTOR, RPS6 or PRKAA. n = 5 (A and C) or 6 (B). (D) INS-1E were pre-incubated with 10 μM STO-609 or 10 μM Compound C for 1 h prior to the addition of 100 nM Ex4 for 1 h. p-PRKAA (T174) was analyzed by western blotting. Images are representative of three individual experiments. (E and F) INS-1E were pre-incubated with 10 μM STO-609 (E) or 10 μM Compound C (F) for 1 h prior to the addition of GLT -/+ Ex4 for 6 h. LC3 was analyzed by western blotting and quantified as LC3-II:GAPDH ratio. n = 3 (E) or 4 (F). Results are expressed as raw densitometry units corrected for the loading control as stated. All data are mean ± SEM of three to six individual experiments. Statistical analysis was performed using either a one-way (A, B, C) or two-way ANOVA (E and F) followed by Bonferroni’s post-hoc test. *P < 0.05, **P < 0.01 effect of GLT; #P < 0.05, ###P < 0.005 effect of Ex4; ^P < 0.05, ^^^P < 0.005 effect of inhibitor.
Figure 5.
Figure 5.
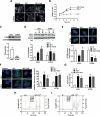
PPP3/calcineurin is essential for the cell protective effects of exendin-4. (A) INS-1E were incubated with 15 mM glucose and 100 nM Ex4, without or with 100 nM FK506 for 0, 10 or 20 min. NFATC1 translocation was visualized using immunostaining. Nuclear to cytoplasmic (N:C) ratio was quantified using ImageJ. n = 3. Images are representative of three individual experiments. (B-D) INS-1E (B and D) or human islets (C) were pre-incubated with 100 nM FK506 for 1 h prior to the addition of GLT -/+ Ex4 for 6 (B), 16 (D) or 48 h (C). (B and C). LC3 was analyzed by western blotting and quantified as LC3-II:GAPDH ratio. (D) Cell death was assessed by PI-Hoechst staining and quantified as positive cells relative to total cell number. n = 3 (C), 5 (B), 6 (D). (E-H) INS-1E were treated with scrambled siRNA (siScr) or siRNA against Ppp3r1/calcineurin B1 (siPpp3r1) for 48 h prior to treatment with GLT -/+ Ex4 for either 6 h (E and F) or 18 h (G and H). (E) PPP3R1 protein was analyzed by western blotting and quantified as PPP3R1:GAPDH ratio. (F) LC3 was analyzed by western blotting and quantified as LC3-II:GAPDH ratio. (G) Lysosomal function was assessed by immunostaining for CTSD and puncta intensity quantified using Blobfinder software. (H) Cell death was assessed by PI-Hoechst staining and quantified as positive cells relative to total cell number. n = 4 (E, G, H) or 5 (F). Results are expressed as raw densitometry units corrected for the loading control as stated or normalized to control and expressed as fold change. All data are mean ± SEM of three to six individual experiments. Statistical analysis was performed using an unpaired t-test (E), or a two-way ANOVA (B-D, F-H) followed by Bonferroni’s post-hoc test. *P < 0.05, **P < 0.01, ***P < 0.005 effect of GLT; #P < 0.05, ##P < 0.01 effect of Ex4; ^ P < 0.05 effect of inhibitor or knockdown. Scale bars: 10 µm.
Figure 6.
Figure 6.
TFEB mediates the cell protective effects of exendin-4. (A and B) INS-1E were pre-incubated with 100 nM FK506 for 1 h prior to the addition of GLT -/+ Ex4 for 6 (A) or 2–12 h (B). TFEB translocation was visualized using immunostaining and quantified as nuclear to cytoplasmic (N:C) ratio using ImageJ. (A) Results are representative of three individual experiments. (B) Mean ± SEM of two to four individual experiments. (C-G) INS-1E were treated with scrambled siRNA (siScr) or siRNA against Tfeb (siTfeb) for 48 h prior to treatment with GLT -/+ Ex4 for either 6 (C and D) or 18 h (E-G). (C) TFEB protein was analyzed by western blotting and quantified as TFEB:GAPDH ratio. (D) LC3 was analyzed by western blotting and quantified as LC3-II:GAPDH ratio. (E) Lysosomal function was assessed by immunostaining for CTSD and puncta intensity quantified using Blobfinder software. (F) Autophagic flux was assessed by immunostaining for SQSTM1 and puncta intensity quantified using Blobfinder software. (G) Cell death was assessed by PI-Hoechst staining and quantified as positive cells relative to total cell number. n = 4 (C, D, F, G) or 5 (E). (H and I) INS-1E were transfected with GCaMP3-ML1 (GCaMP) for 24 h prior to addition of Rhod-2-AM (Rhod2) for 30 min followed by 30 min washout in Tyrode’s solution at 11 mM glucose. Cells were stimulated with 100 nM Ex4 (H) or media only (Bl) (I) for 90 s. Specificity of the construct was confirmed by addition of 400 μM glycyl-L-phenylalanine-beta-naphthylamide (GPN) followed by 66 mM CaCl2 (Ca2+). Changes in fluorescence at Ex:490, Em:525 (for GCaMP) and Ex:550, Em:580 (for Rhod-2-AM) were detected by confocal microscopy (Nikon A1R) and expressed as ΔF/F0. Data is representative of five individual experiments. Results are expressed as raw densitometry units corrected for the loading control as stated or normalized to control and expressed as fold change. All data are mean ± SEM of three to five individual experiments. Statistical analysis was performed using an unpaired t-test (C), or a two-way ANOVA (D-G) followed by Bonferroni’s post-hoc test. * P < 0.05, **P < 0.01, ***P < 0.005 effect of GLT; #P < 0.05 effect of Ex4; ^P < 0.05 effect of knockdown. Scale bars: 10 µm.
Figure 7.
Figure 7.
TFEB overexpression protects β-cells from GLT-mediated cell death. (A-G) Stable INS-1E clones that were non-expressing (-) or GFP-TFEB-expressing (GFP-TFEB) cells were starved (ST) for 2 h in HBSS (A and B) or incubated with GLT for 6 (A-C, F) or 18 h (D, E and G). (A) Expression of GFP-TFEB was confirmed by western blotting for GFP. The differences in migration pattern upon starvation or addition of GLT represent dephosphorylation of TFEB, which alters the migration rate of the protein [40]. (B) GFP-TFEB translocation was confirmed in response to both starvation and GLT exposure. Images are representative of three individual experiments. (C) LC3 was analyzed by western blotting and quantified as LC3-II:GAPDH ratio. (D) Lysosomal function was assessed by immunostaining for CTSD and puncta intensity quantified using Blobfinder software. (E) Autophagic flux was assessed by immunostaining for SQSTM1 and puncta intensity quantified using Blobfinder software. (F) Cell death was assessed by western blotting for cCASP3. (G) Cell death was assessed by PI-Hoechst staining and quantified as positive cells relative to total cell number. n = 4 (D and E), 5 (F) or 8 (C and G). (H-J) Human islets were transfected with GFP-only (GFP) or pEGFP-N1-TFEB (GFP-TFEB) and islets cultured for 48 h before exposure to GLT for a further 48 h. (H) GFP expression and LC3 were analyzed by western blotting. (I) LC3 was quantified as LC3-II:GAPDH ratio. (J) Cell death was assessed by PI-Hoechst staining and quantified as % viability. n = 4 (J) or 5 (H and I). Results are expressed as raw densitometry units corrected for the loading control as stated or normalized to control and expressed as fold change. All data are mean ± SEM of four to eight individual experiments. Statistical analysis was performed using a two-way ANOVA followed by Bonferroni’s post-hoc test *P < 0.05, **P < 0.01, ***P < 0.005 effect of GLT; ^P < 0.05, ^^P < 0.01, ^^^P < 0.005 effect of overexpression. Scale bars: 10 µm.
Figure 8.
Figure 8.
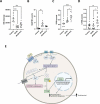
Exendin-4 increases lysosomal marker expression in vivo. (A-D) db/db mice were injected twice daily with either saline or exendin-4(1–39) at 25 nmol/kg bw for 21 d as described in [49]. Aged matched lean control C57Bl/6 J mice treated with saline were used as non-diabetic controls. Pancreatic tissue was stained for INS (A), SQSTM1 (B), TFEB (C) and CTSD (D) and imaged using confocal microscopy. Results are expressed either as raw intensity (A) or corrected for INS positive area (B-D). n = 5 animals, 10–15 islets imaged per condition. Statistical analysis was performed using one-way ANOVA followed by Bonferroni’s post-hoc test. * P < 0.05, ** P < 0.01, *** P < 0.005, **** P < 0.001. (E) Schematic representation of model. Ex4 activates ADCY (adenylate cyclase) through its G-protein coupled receptor which leads to the activation of cAMP. The downstream activation of RAPGEF4 then leads to an increase in intracellular Ca2+ concentration, which in turn stimulates PPP3R1/calcineurin activity and downstream dephosphorylation of TFEB. This causes translocation of TFEB to the nucleus and subsequent upregulated transcription of genes involved in autophagy and lysosomal biogenesis and upregulation of autophagic flux. Image created by Biorender.com.

References

    1. Efeyan A, Comb WC, Sabatini DM.. Nutrient-sensing mechanisms and pathways. Nature. 2015;517(7534):302–310. - PMC - PubMed
    1. Yu L, Chen Y, Tooze SA.. Autophagy pathway: cellular and molecular mechanisms. Autophagy. 2018;14(2):207–215. - PMC - PubMed
    1. Kaur J, Debnath J. Autophagy at the crossroads of catabolism and anabolism. Nat Rev Mol Cell Biol. 2015;16(8):461–472. - PubMed
    1. Lavallard VJ, Meijer AJ, Codogno P, et al. Autophagy, signalling and obesity. Pharmacol Res. 2012;66:513–525. - PubMed
    1. Kim KH, Lee MS. Autophagy–a key player in cellular and body metabolism. Nat Rev Endocrinol. 2014;10(6):322–337. - PubMed

Publication types