. 2021 Aug 2;131(15):e131178.
doi: 10.1172/JCI131178.

Histone deacetylase 9 promotes endothelial-mesenchymal transition and an unfavorable atherosclerotic plaque phenotype

Affiliations

Histone deacetylase 9 promotes endothelial-mesenchymal transition and an unfavorable atherosclerotic plaque phenotype

Laura Lecce et al. J Clin Invest. .

Abstract

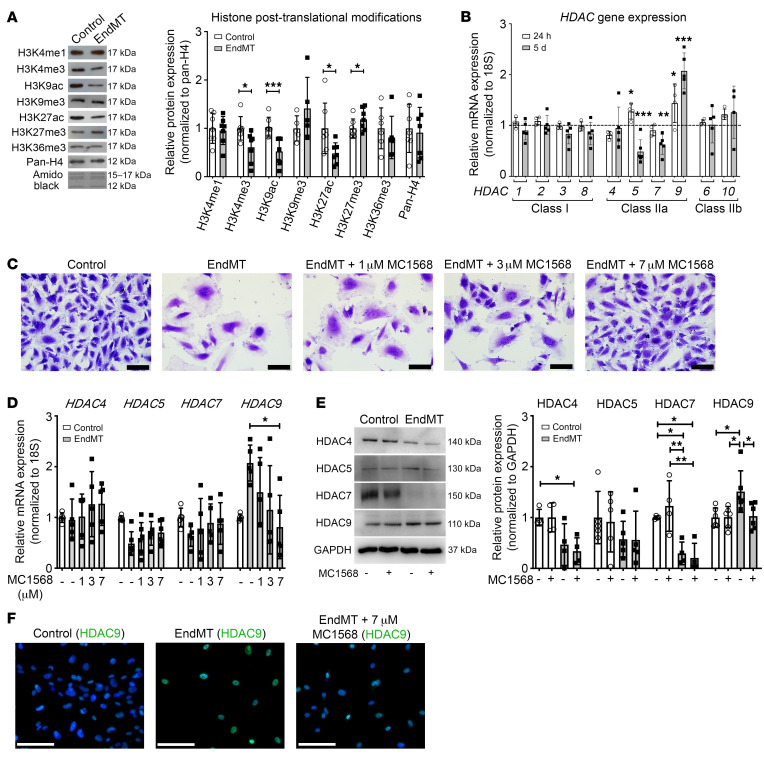
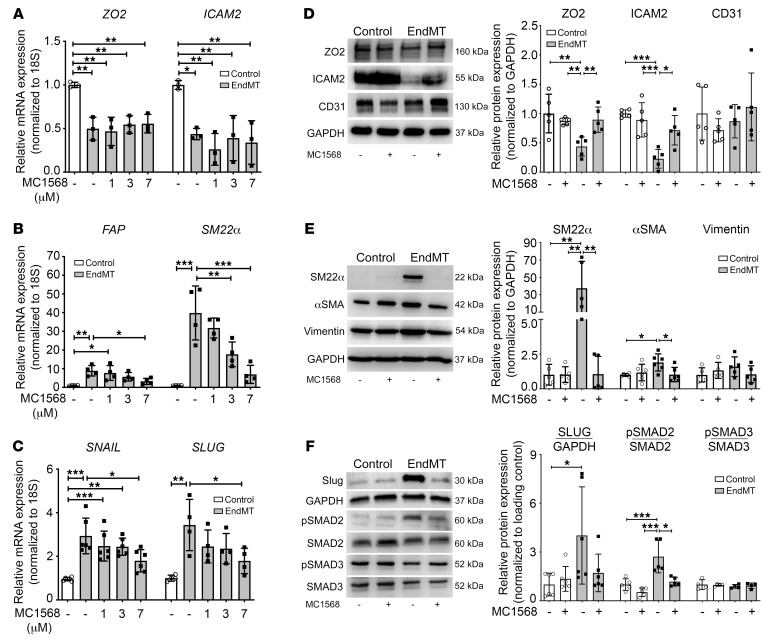
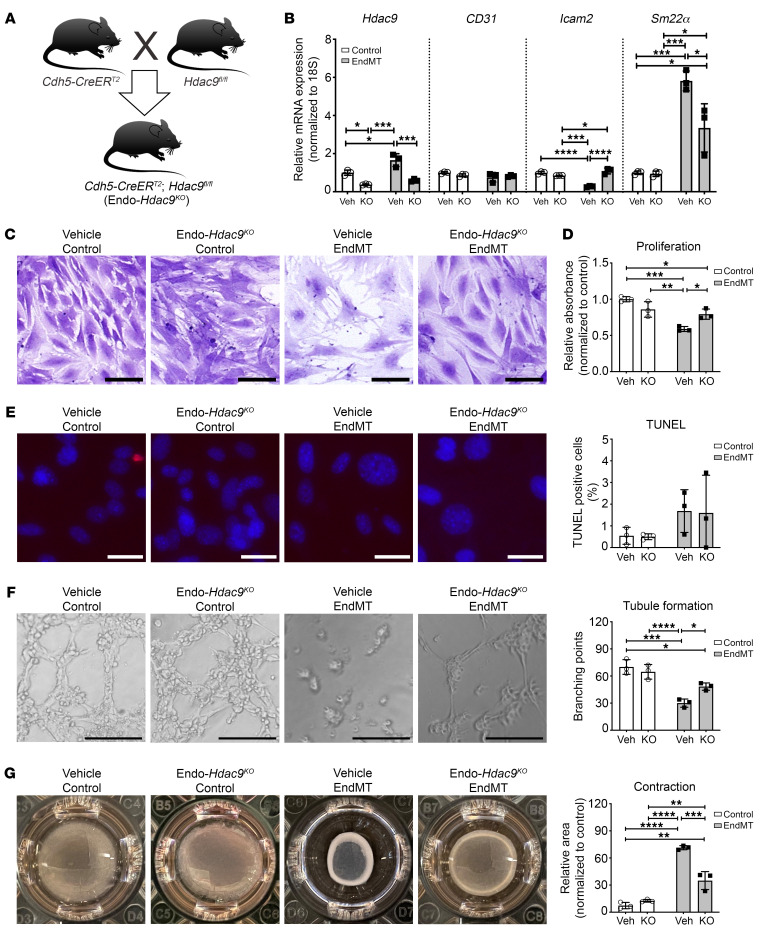
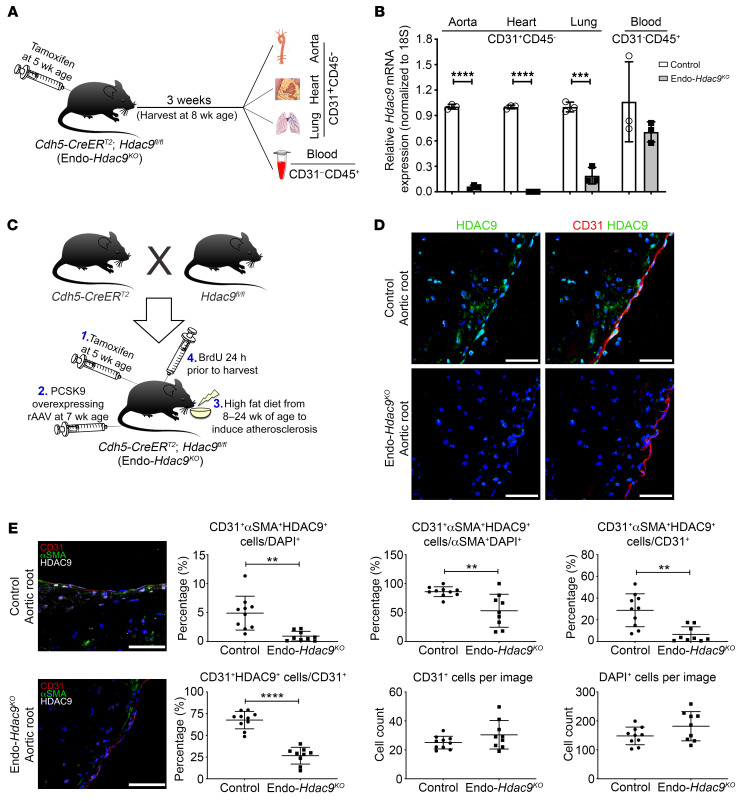
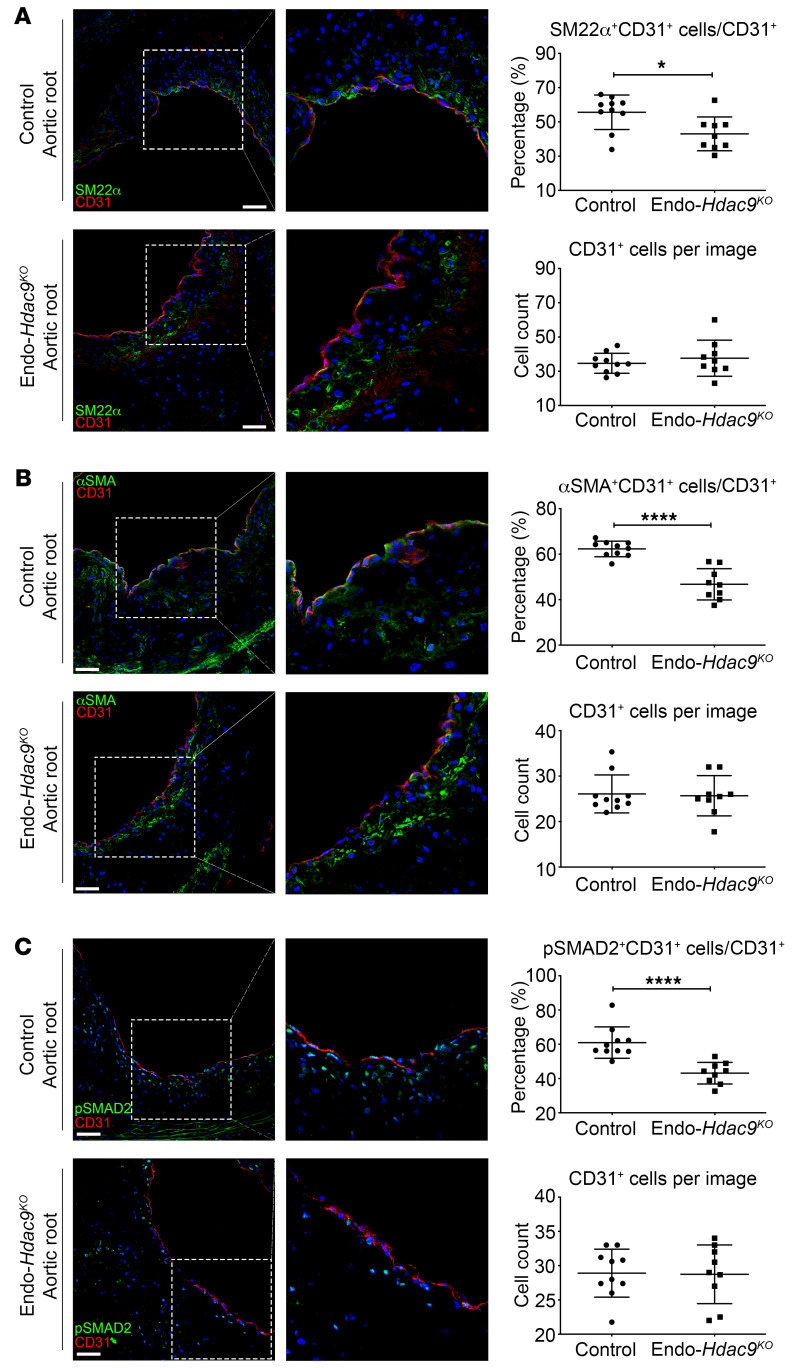
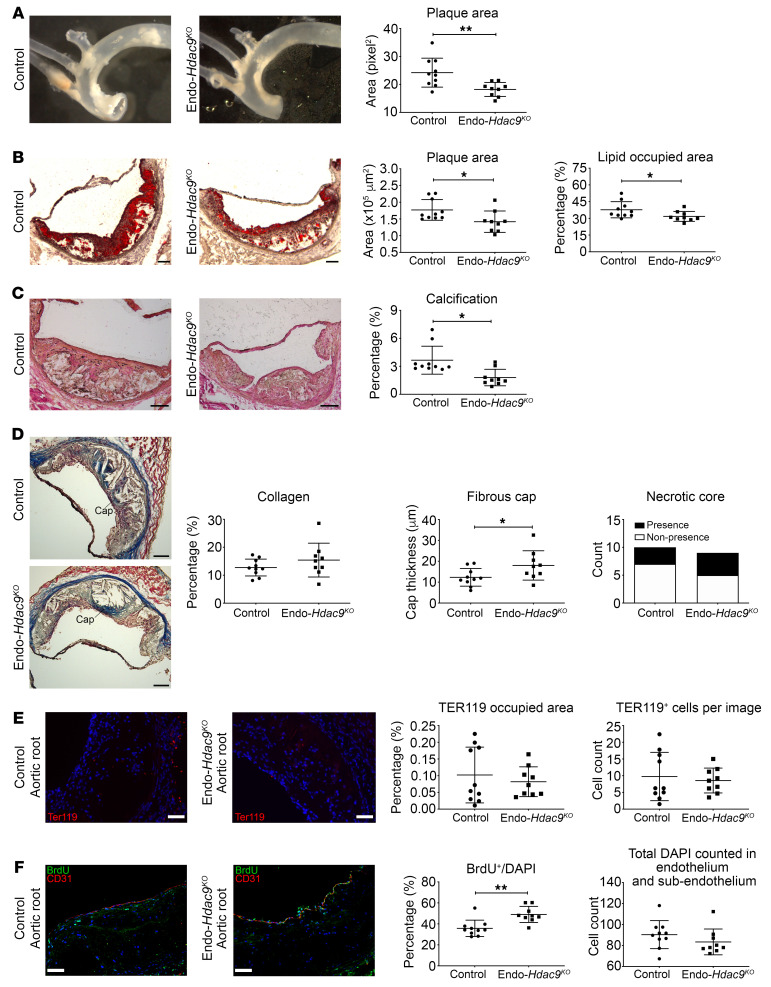
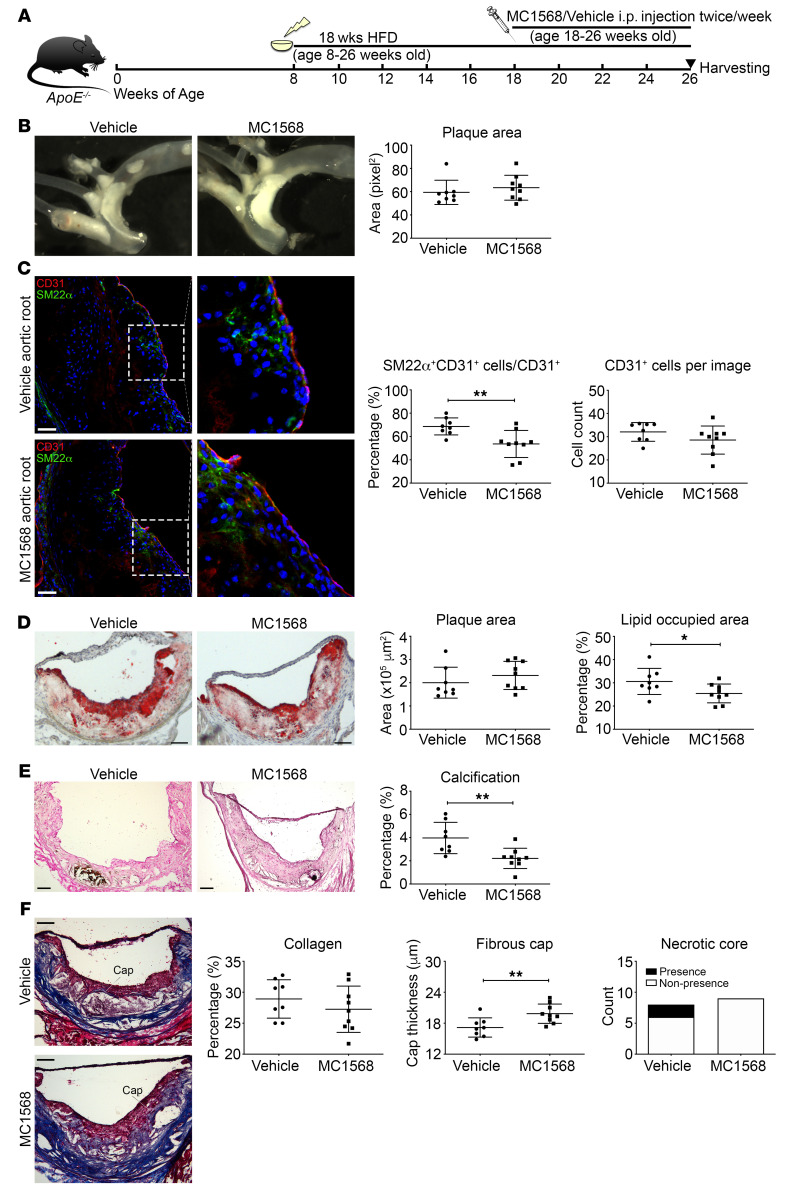
Endothelial-mesenchymal transition (EndMT) is associated with various cardiovascular diseases and in particular with atherosclerosis and plaque instability. However, the molecular pathways that govern EndMT are poorly defined. Specifically, the role of epigenetic factors and histone deacetylases (HDACs) in controlling EndMT and the atherosclerotic plaque phenotype remains unclear. Here, we identified histone deacetylation, specifically that mediated by HDAC9 (a class IIa HDAC), as playing an important role in both EndMT and atherosclerosis. Using in vitro models, we found class IIa HDAC inhibition sustained the expression of endothelial proteins and mitigated the increase in mesenchymal proteins, effectively blocking EndMT. Similarly, ex vivo genetic knockout of Hdac9 in endothelial cells prevented EndMT and preserved a more endothelial-like phenotype. In vivo, atherosclerosis-prone mice with endothelial-specific Hdac9 knockout showed reduced EndMT and significantly reduced plaque area. Furthermore, these mice displayed a more favorable plaque phenotype, with reduced plaque lipid content and increased fibrous cap thickness. Together, these findings indicate that HDAC9 contributes to vascular pathology by promoting EndMT. Our study provides evidence for a pathological link among EndMT, HDAC9, and atherosclerosis and suggests that targeting of HDAC9 may be beneficial for plaque stabilization or slowing the progression of atherosclerotic disease.

Keywords: Atherosclerosis; Cardiology; Endothelial cells; Epigenetics; Vascular Biology.


Conflict of interest statement

Conflict of interest: The authors have declared that no conflict of interest exists.

Figures

Figure 1
Figure 1. EndMT is associated with histone deacetylation and increased HDAC9 expression, which is ameliorated by class IIa HDAC inhibitor MC1568.
(A) Representative Western blots for histone PTMs after 5 days of EndMT induction in HCAECs with densitometric analysis demonstrating changes in histone acetylation and methylation. n = 5–7. (B) qRT-PCR showing time-dependent changes of canonical HDACs after 24-hour and 5-day EndMT induction (TGF-β2 plus H2O2) in HCAECs. Graph is representative of fold change relative to vehicle-treated control cells normalized to 1 (dashed line). n = 4–6. (C) Images of HCAECs after 5-day EndMT induction with or without increasing doses of MC1568. Scale bars: 100 μm. (D) qRT-PCR analysis showing mRNA expression of class IIa HDACs (HDAC4, -5, -7, and -9) after 5-day EndMT induction in HCAECs, with a dose-dependent effect of MC1568 on HDAC9 gene expression. n = 5–6. (E) Representative Western blots and densitometry measurements of class IIa HDACs after 5-day EndMT induction with or without MC1568 in HCAECs, with the graph representing fold change relative to vehicle-treated controls. n = 4–6. (F) Immunofluorescence staining of control HUVECs with anti-HDAC9 antibody and after 5-day EndMT induction with or without 7 μM MC1568. Scale bars: 100 μm. *P ≤ 0.05; **P ≤ 0.01; ***P ≤ 0.001. Analyses performed using unpaired Student’s t test (A), 1-way ANOVA (B and D), and 2-way ANOVA (E).
Figure 2
Figure 2. Class IIa HDAC inhibition suppresses EndMT-associated changes in mRNA and protein levels.
(AC) qRT-PCR analysis of endothelial (ZO2, ICAM2; n = 3), mesenchymal (SM22α, FAP; n = 4), and TGF-β pathway (SNAIL, SLUG; n = 4–6) transcript levels after 5-day EndMT induction with or without increasing doses of MC1568 in HCAECs. (D and E) Representative Western blots and densitometry measurements of endothelial (ZO2, ICAM2, CD31) and mesenchymal proteins (SM22α, αSMA, Vimentin) in HCAECs after 5-day EndMT with or without 7 μM MC1568 treatments compared with vehicle-treated controls. n = 5–6. (F) Representative Western blots and densitometry measurements of TGF-β–associated transcription factor proteins (SLUG, pSMAD2, pSMAD3) in HCAECs after 5-day EndMT with or without 7 μM MC1568 treatment compared with vehicle-treated controls. n = 4–6. *P ≤ 0.05; **P ≤ 0.01; ***P ≤ 0.001. Analyses performed using 1-way ANOVA (AC) and 2-way ANOVA (DF).
Figure 3
Figure 3. Ex vivo endothelial-specific Hdac9 knockout attenuates EndMT-associated changes in endothelial cell function in MPLECs.
(A) Breeding and generation of Endo-Hdac9KO mice for obtaining MPLECs. (B) Expression of Hdac9, CD31, Icam2, and Sm22α in MPLECs with (KO; i.e., ex vivo 4-OH tamoxifen treatment) and without (Veh; vehicle treatment) knockout of Hdac9 with or without EndMT assessed by qRT-PCR. These groups are identical for all subsequent panels in this figure. (C) Crystal violet staining showing changes in cell numbers and density. Scale bars: 100 μm. (D) To assess proliferation, MPLECs were incubated with BrdU, followed by spectrophotometric quantification. Data are represented as fold change compared with vehicle-treated control cells. (E) Representative images and quantification of TUNEL assay to detect apoptosis on MPLECs with or without EndMT induction. Scale bars: 30 μm. (F) Tubule formation of MPLECs with or without EndMT assessed by plating cells onto Matrigel and incubating for another 4 hours. Tubule branch points were imaged and quantified. Scale bars: 100 μm. (G) Contraction assay showing changes in relative unoccupied area (normalized to a completely unoccupied well) for MPLECs with or without EndMT induction. For this figure, lungs from n = 4 male Endo-Hdac9KO mice were pooled to derive MPLECs. Apart from (crystal violet staining) (C), n = 3 for all analyses as biological replicates. *P ≤ 0.05; **P ≤ 0.01; ***P ≤ 0.001; ****P ≤ 0.0001. All analyses performed using 2-way ANOVA.
Figure 4
Figure 4. In vivo establishment and validation of Endo-Hdac9KO mouse model.
All comparisons in this figure are using endothelial-specific Hdac9 knockout mice (Endo-Hdac9KO) versus littermate controls (Hdac9fl/fl). All mice received tamoxifen. (A) For Hdac9 knockout validation, endothelial cells were harvested from a variety of tissues from nonatherosclerotic Endo-Hdac9KO mice or littermate controls. (B) Hdac9 knockout validation: qRT-PCR analysis of the expression levels of Hdac9 in CD31+CD45 endothelial cells from the aorta, heart, and lungs and CD31CD45+ leukocytes from blood in Endo-Hdac9KO mice compared with littermate controls 3 weeks after tamoxifen administration. n = 3. (C) Breeding and generation of atherosclerotic Endo-Hdac9KO mouse model. (D) Representative immunofluorescence staining images for HDAC9- (green), CD31- (red), and DAPI-stained nuclei (blue) in plaques from the aortic root. (E) Representative immunofluorescence staining images for αSMA- (green), CD31- (red), HDAC9- (white), and DAPI-stained nuclei (blue) in aortic root plaques and quantification. Scale bars: 50 μm. n = 10 controls versus n = 9 Endo-Hdac9KO mice. **P ≤ 0.01; ***P ≤ 0.001; ****P ≤ 0.0001. All analyses performed using unpaired Student’s t test except CD31+αSMA+HDAC9+ cells/CD31+ (E), for which Mann-Whitney U test was used.
Figure 5
Figure 5. Endothelial-specific Hdac9 knockout reduces EndMT in vivo.
All comparisons in this figure were generated using aortic root sections from Endo-Hdac9KO mice versus littermate controls, and all mice received tamoxifen. (A) Representative immunofluorescence staining images for SM22α- (green), CD31- (red), and DAPI-stained nuclei (blue), quantification of SM22α+CD31+ copositive cells over total CD31+ cells, and total number of CD31+ cells per image. (B) Representative immunofluorescence staining images for αSMA- (green), CD31- (red), and DAPI-stained nuclei (blue), quantification of copositive cells over total CD31+ cells, and total number of CD31+ cells per image. (C) Representative immunofluorescence staining images for pSMAD2- (green), CD31- (red), and DAPI-stained nuclei (blue), quantification of copositive cells over total CD31+ cells, and total number of CD31+ cells per image. Scale bars: 50 μm. Right panels are digital enlargements of the original adjacent images. n = 10 controls versus n = 9 Endo-Hdac9KO mice. *P ≤ 0.05; ****P ≤ 0.0001. All analyses performed using unpaired Student’s t test except the following, for which Mann-Whitney U test was used: SM22α+CD31+ cells/CD31+ cells (A); CD31+ cells per image (B); and pSMAD2+CD31+ cells/CD31+ cells (C).
Figure 6
Figure 6. Endothelial-specific Hdac9 knockout reduces atherosclerosis and enhances plaque stability in vivo.
All comparisons shown are using Endo-Hdac9KO mice versus littermate controls, and all mice received tamoxifen. (A) Representative images of aorta before embedding into OCT and en face analysis of aortic plaque. (B) Representative images of the aortic root with staining using oil red O, with quantification of total plaque area and plaque lipid content (red stained area as a percentage of total plaque area). (C) Representative images of aortic root sections using Von Kossa stain (black represents calcification), with quantification of calcification. (D) Representative aortic root images stained with Masson’s trichrome with quantification of collagen content, fibrous cap thickness, and presence/nonpresence of necrotic core (blue, collagen; pink, macrophages and cardiac muscle). (E) Representative immunofluorescence staining images in aortic root plaques for TER119- (red, erythrocyte marker) and DAPI-stained nuclei (blue) and quantification. (F) Representative immunofluorescence staining images of aortic root plaques for BrdU- (green), CD31- (red), and DAPI-stained nuclei (blue) in the endothelial and subendothelial layers, and quantification. Scale bars: 100 μm (BD); 50 μm (E and F). n = 10 controls versus n = 9 Endo-Hdac9KO mice for all panels. *P ≤ 0.05; **P ≤ 0.01. All analyses performed using unpaired Student’s t test except the following, for which Mann-Whitney U test was used: plaque area (B), calcification (C), and both analyses in F. In addition, presence or nonpresence of necrotic core (D) was analyzed using Fisher’s exact test.
Figure 7
Figure 7. Systemic administration of a class IIa HDAC inhibitor reduces EndMT and increases plaque stability.
(A) Generation of MC1568-treated atherosclerotic mouse model. (B) Representative images of aorta before embedding into OCT and en face analysis of plaque in aorta. (C) Representative images of immunofluorescence staining of aortic root sections for SM22α- (green), CD31- (red), and DAPI-stained nuclei (blue) and quantification of SM22α+CD31+-costained cells over total CD31+ cells and the total number of CD31+ cells per image. (D) Representative images of the aortic root with staining using oil red O, with quantification of total plaque area and plaque lipid content. (E) Representative images of aortic root sections using Von Kossa stain (black represents calcification), with quantification of calcification. (F) Representative aortic root images stained with Masson’s trichrome with quantification of collagen content, fibrous cap thickness, and presence/nonpresence of necrotic core (blue, collagen; pink, macrophages and cardiac muscle). Scale bars: 50 μm (C); 100 μm (DF). Right panels in C are digital enlargements of the original adjacent images. n = 8 controls (vehicle) versus n = 9 MC1568-treated mice for all panels. *P ≤ 0.05; **P ≤ 0.01. All analyses performed using unpaired Student’s t test except plaque area (B and D), for which Mann-Whitney U test was used. In addition, presence or nonpresence of necrotic core (F) was analyzed using Fisher’s exact test.

References

    1. Kovacic JC, et al. Endothelial to mesenchymal transition in cardiovascular disease: JACC state-of-the-art review. J Am Coll Cardiol. 2019;73(2):190–209. doi: 10.1016/j.jacc.2018.09.089. - DOI - PMC - PubMed
    1. Kovacic JC, et al. Epithelial-to-mesenchymal and endothelial-to-mesenchymal transition: from cardiovascular development to disease. Circulation. 2012;125(14):1795–1808. doi: 10.1161/CIRCULATIONAHA.111.040352. - DOI - PMC - PubMed
    1. Piera-Velazquez S, Jimenez SA. Molecular mechanisms of endothelial to mesenchymal cell transition (EndoMT) in experimentally induced fibrotic diseases. Fibrogenesis Tissue Repair. 2012;5(Suppl 1):S7. - PMC - PubMed
    1. Hashimoto N, et al. Endothelial-mesenchymal transition in bleomycin-induced pulmonary fibrosis. Am J Respir Cell Mol Biol. 2010;43(2):161–172. doi: 10.1165/rcmb.2009-0031OC. - DOI - PMC - PubMed
    1. Sohal SS. Endothelial to mesenchymal transition (EndMT): an active process in chronic obstructive pulmonary disease (COPD)? Respir Res. 2016;17:20. - PMC - PubMed

Publication types