Role of FAM134 paralogues in endoplasmic reticulum remodeling, ER-phagy, and Collagen quality control
- PMID: 34338405
- PMCID: PMC8447607
- DOI: 10.15252/embr.202052289
Role of FAM134 paralogues in endoplasmic reticulum remodeling, ER-phagy, and Collagen quality control
Abstract
Degradation of the endoplasmic reticulum (ER) via selective autophagy (ER-phagy) is vital for cellular homeostasis. We identify FAM134A/RETREG2 and FAM134C/RETREG3 as ER-phagy receptors, which predominantly exist in an inactive state under basal conditions. Upon autophagy induction and ER stress signal, they can induce significant ER fragmentation and subsequent lysosomal degradation. FAM134A, FAM134B/RETREG1, and FAM134C are essential for maintaining ER morphology in a LC3-interacting region (LIR)-dependent manner. Overexpression of any FAM134 paralogue has the capacity to significantly augment the general ER-phagy flux upon starvation or ER-stress. Global proteomic analysis of FAM134 overexpressing and knockout cell lines reveals several protein clusters that are distinctly regulated by each of the FAM134 paralogues as well as a cluster of commonly regulated ER-resident proteins. Utilizing pro-Collagen I, as a shared ER-phagy substrate, we observe that FAM134A acts in a LIR-independent manner and compensates for the loss of FAM134B and FAM134C, respectively. FAM134C instead is unable to compensate for the loss of its paralogues. Taken together, our data show that FAM134 paralogues contribute to common and unique ER-phagy pathways.
Keywords: Collagen; ER stress; ER-phagy; FAM134; autophagy.
© 2021 The Authors. Published under the terms of the CC BY 4.0 license.
Conflict of interest statement
The authors declare that they have no conflict of interest.
Figures
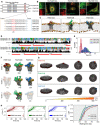
Schematic representation of FAM134 protein structures and sequence of the LC3‐interacting region (LIR) domain of human (h) and mouse (m) proteins (red square).
Immunofluorescence images of U2OS cells expressing FLAG‐HA‐FAM134 after 24 h of doxycycline induction stained for HA (green) and endogenous calnexin (CANX; red). Scale bar: 20 μm.
Structural models of reticulon homology domains (RHDs) of FAM134 proteins were built and coarse‐grained before embedding in POPC bilayers and simulated using MD simulations. The overall shape of the RHD along with its membrane footprint was monitored by measuring the radius of gyration Rg of the protein (gray: TM segments; yellow: AH segments; red, green, blue: cytosolic loop of FAM134A, FAM134B, FAM134C).
Sequence alignment of human FAM134 proteins based on hydrophobicity profiles computed using AlignME. The helical structural elements characteristic of the RHD are denoted in red below along with a consensus sequence.
Probability density of Rg for FAM134‐RHDs, indicating compact (small Rg value) or widespread (high Rg value) conformations.
Distinct conformational states of the RHD of FAM134 proteins were obtained from conformational sampling (total n = 10,000) using coarse‐grained molecular dynamic simulations (10 μs) and subsequent clustering. Representative conformations corresponding to the top 3 populated clusters are shown for each system. Conformation states in light colors represent the most populated states in the reported simulation.
Snapshots showing the curvature of bicelles containing DMPC (gray) and short‐chain DHPC lipids (red) together with FAM134‐RHDs over time.
Curvature time‐traces (smoothed running averages over 11 ns widows) from individual replicates (n = 20) quantify the bicelle shape transformation process during simulations. Black lines (mean value) and shaded region (s.e.m) denote the average behavior of the system. From the 20 replicates, data on waiting times (t) were collected to compute rates and acceleration factors (Table EV3). Vesicle formation is marked by bilayer‐disk curvature, |H| = 0.14 nm−1.
Cumulative distribution functions (CDF) of recorded waiting times for formation of vesicle (filled circles: simulations; lines: Single Poisson process with additional lag time).
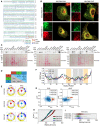
Alignment of the amino acid sequence of human FAM134 proteins. Blue, red, and yellow box highlights the reticulon homology domain (RHD), the LIR domains, and predicted α‐helixes adjacent to the LIR domain, respectively (“*” no mismatches among sequences; more or less conserved amino acidic groups are highlighted with “.” and “:”, respectively).
Immunofluorescence images of U2OS cells overexpressing FLAG‐HA‐FAM134 proteins after 24 h doxycycline induction and stained for FAM134 (HA) or endogenous REEP5. Cells grown in basal or starvation (2 h EBSS treatment) conditions and 200 nM Bafilomycin A1 (Baf.A1) was added 2 h prior fixation. Scale bar: 20 μm.
Representative Western blot analysis of Fam134 proteins in different murine tissues. Wild‐type and respective knockout MEFs served as internal control for antibody staining. An independent Ponceau staining is shown as loading control.
Matrix representing the pairwise sequence identities (upper triangle; blue; parentheses show % similarities) and structural similarities (RMSD; lower triangle; gray) of the modeled RHD domains of the three human paralogs.
Helical wheel representation of the linker regions AHL and AHC from RHDs of human FAM134 describing the relative orientation of the helices on the bilayer‐water interface. The mean hydrophobicity, and hydrophobic moments are depicted on either side of the helical wheel along with net charge at its center (amino acids with a positive charge [R, K, H] are reported in blue; amino acids with a negative charge [E, D] are reported in red; amino acids with a hydrophobic side chain [M, L, I, Y, F, W, V, C] are depicted in yellow; alanine [A] is depicted in gray).
Root mean square fluctuations (RMSF) of the RHD residues around their mean position after fitting backbone beads indicate that the cytosolic loops and the nonhelical RHD elements contribute to the differences in wedge‐shape (gray: TM segments; yellow: AH segments).
Distribution of hydrophobic moments and the hydrophobicity of FAM134 paralogues (orange contours) and canonical RTN4 (blue contours). FAM134A, FAM134B, and FAM134C are representative and shown as colored points.
Comparison of the curvature induction process in bicelle systems containing FAM134 proteins. Data from curvature time‐series of each system (n = 20 independent computational runs) were first smoothed over an 11‐ns window and binned along the curvature to compute the average (black line) times + s.e.m. (shaded region).
Violin plots showing the distribution of waiting times from n = 20 independent computational runs for bilayer‐to‐vesicle transitions for bicelles containing FAM134A‐RHD (red), FAM134B‐RHD (green) and FAM134C‐RHD (blue). Each boxplot graph reports the median value with the first and third quartile of the distribution.
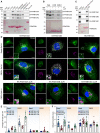
- A–C
Lysates of HEK293T cells transiently transfected with HA‐tagged wild‐type (WT, Fig 2A–C) and wild‐type or ∆LIR mutant (Fig 2B) FAM134 genes were subjected to pull‐down experiments (representative data; WB detection against HA; n = 3) using A, B) purified GST, wild type GST‐LC3s, GST‐GABARAPs, GST‐Ubiquitin (Ub), GST‐Tetra‐Ubiquitin, or C) GST‐LC3B and GST‐LC3B F52A‐V53A as baits. A representative Ponceau staining is shown.
- D
Immunofluorescence images of U2OS expressing wild‐type or ∆LIR mutant FLAG‐HA‐FAM134 proteins after 24 h of doxycycline induction under different conditions (basal = DMSO, Baf.A1 = 2 h 200 nM Bafilomycin A1, EBSS = 2 h starvation in EBSS) Scale bar: 10 μm; staining against FAM134 (HA; green) and endogenous LC3B (red).
- E
Automatic quantification of HA‐positive dot‐like structures. Each data point represents the average of dots per cell of one view (representative image see Fig EV2B). Total number of cells analyzed for basal: FAM134A/B/C/A∆LIR/B∆LIR/C∆LIR = 592/472/358/280/233/300; EBSS: FAM134A/B/C/A∆LIR/B∆LIR/C∆LIR = 364/720/142/364/720/674; error bars indicate s.e.m.; biological replicates WT/∆LIR = 3/1.
- F
Automated quantification of ER branching of in an automated manner (Valente et al, 2017). Each datapoint represents one view (representative image see Fig EV2B). Same cells as in (E); error bars indicate s.e.m.

Lysates of wild‐type MEFs were subjected to pulldown experiments (representative data of n = 3 independent cell preparation; WB detection against endogenous Fam134 using purified GST‐LC3A/B and GST‐GABARAPL1/L2 as baits. A representative Ponceau staining is shown.
Representative immunofluorescence images of U2OS expressing wild‐type or ∆LIR mutant FLAG‐HA‐FAM134 proteins after 24 h of doxycycline induction under different conditions (basal = DMSO, Baf.A1 = 2 h of 200 nM Bafilomycin A1, EBSS = 2 h of starvation in EBSS). Scale bar: 10 μm. Inset scale bar: 5 μm; staining against FAM134 (HA; green).
Statistic analysis of dot‐like structures and ER branching of images presented in (B). Automatic quantification of HA‐positive dot‐like structures and automated quantification of ER branching as described in Valente et al (2017). Each data point represents the average of dots per cell of one view (representative image see Fig EV2B). n.s. = not significant. FBS (Fetal Bovine Serum): indicates DMEM with 10% FBS.
Immuno‐gold labeling of HA in U2OS FLAG‐HA‐FAM134‐overexpressing cells after 2 h EBSS starvation plus 200 nM Bafilomycin A1. AV: autophagic vesicles; ER: endoplasmic reticulum. Scale bar: 500 nm.
Representative immunofluorescence images of U2OS cells expressing wild‐type or ∆LIR mutant FLAG‐HA‐FAM134 proteins after 24 h of doxycycline induction under different conditions (basal = DMSO, Baf.A1 = 2 h of 200 nM Bafilomycin A1, EBSS = 2 h of starvation in EBSS). Scale bar: 10 μm; staining against FAM134 (HA; green) and endogenous LAMP1 (red).
Representative Western blot of FAM134 protein levels (HA) in U2OS cells expressing FLAG‐HA‐FAM134 after 24 h of doxycycline induction and EBSS starvation for the indicated time (h = hours).
Densitometric analysis reporting the fold decrease of FLAG‐HA‐FAM134 expression level upon EBSS starvation for the indicated time (hours). Actin has been used as reference for ratio calculation. Data are represented as mean ± s.e.m. of three independent biological experiments and the statistical significance is calculated by unpaired t‐test and defined as *P < 0.05, **P < 0.01, ***P < 0.001.
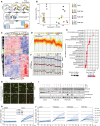
Schematic representation of the experimental procedure to obtain the proteomes of U2OS control cells (−Dox) or cells inducible expressing FLAG‐HA‐FAM134 proteins upon 24 h of doxycycline induction (+Dox) by mass spectrometry (MS). Cells were grown in basal condition or starved with EBSS for 8 h prior to lysis.
Principal Component Analysis of the MS data after indicated treatments.
Hierarchical clustering of label‐free quantitation (LFQ) intensities of significantly changed proteins (ANOVA, FDR 0.01). Cluster framed in green includes proteins with a “endoplasmic reticulum” enriched GO.
Profile‐plot of protein levels (LFQ intensities) of the cluster enriched for “endoplasmic reticulum” upon indicated treatments.
List and frequency of GOCC terms related to the protein cluster in (D).
CANX, REEP5 and SEC22B as sample proteins extracted from (D).
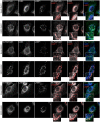
Small sections of sample pictures of U2OS cells stably expressing the ER‐phagy reporter ssRFP‐GFP‐KDEL. Pictures were obtained by the IncuCyte® S3 (10×) and show the overlaid GFP and RFP signal from DMSO and Torin1‐treated cells over time. Scale bar 25 µm. Time lapse of representative total image views can be found in Movies EV7 and EV8.
ER‐phagy flux, represented by the RFP/GFP ratio (total fluorescent intensities), upon basal (DMSO) or autophagy induced (Torin1) conditions, in U2OS control cells and cells overexpressing FAM134 proteins upon 24 h of Dox induction.
Representative Western blot of total cell lysates of U2OS cells overexpressing indicated FAM134 proteins upon 24 h of Dox induction. Autophagy flux was induced and blocked by treatment with Torin1 (8 h) and Bafilomycin A1 (Baf.A1, 8 h), respectively. n = 3.
Comparison of DMSO‐ or Thapsigargin (Tg)‐treated U2OS ssRFP‐GFP‐KDEL cell lines overexpressing indicated FAM134 family members upon 24 h Dox induction.

- A
Representative Western blot for Fam134 proteins in single knockout mouse embryonic fibroblasts (MEFs).
- B
Western blot for Fam134 proteins in indicated MEFs, expressing the ER‐phagy reporter ssRFP‐GFP‐KDEL and being reconstituted with the respective wild‐type or ∆LIR‐mutant Fam134 protein.
- C–E
ER‐phagy flux in ssRFP‐GFP‐KDEL Fam134 knockout and reconstituted MEFs, represented by the RFP/GFP ratio (total fluorescent intensities). Data are representative for three biological replicates and present averaged data obtained from three individual wells (technical replicates) via the IncuCyte® S3, each view containing > 150 cells. (C) ER‐phagy flux in basal‐induced (DMSO) or autophagy‐induced (Torin1) conditions. (D, E) ER‐phagy flux in Thapsigargin (Tg)‐treated MEFs.
- A
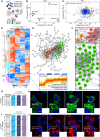
Schematic representation of the experimental procedure to obtain the proteomes of wild‐type and Fam134s knockout MEFs by mass spectrometry (MS).
- B
Principal component analysis (PCA) of analyzed proteomes.
- C
Scatter plot showing proteins responsible for driving sample segregation along component 1 and component 2. Proteins driving segregation are significantly enriched (FDR < 0.05) for GO cellular component (GOCC) terms associated with endoplasmic reticulum (ER) (blue dots).
- D
Unsupervised clustering of ANOVA‐significant proteins by GOCC terms. Inset showing the profile plot and the GO‐term enrichment (FDR < 0.05) of 197 proteins belonging to the highlighted cluster.
- E
Physical interaction network of proteins significantly upregulated in Fam134 knockout MEFs. The network was generated using the STRING plugin in the Cytoscape environment with a confidence score set to 0.4. Nodes are protein entities while lines represent physical interactions Red, orange, green: Collagen, stress fiber, ER associated.
- F
Insets of (E) showing the Collagen and the ER cluster, respectively.
- G, H
Profile plots showing the Log2 LFQ intensity (G) and representative immunofluorescence (H) of Climp63 (green) in wild‐type and Fam134 knockout MEFs.
- I, J
Profile plots showing the Log2 LFQ intensity (I) and representative immunofluorescence (J) for collagen I (red) expression in wild‐type and Fam134 knockout MEFs. Scale bar: 10 μm. Inset scale bar: 5 μm. Nuclei were stained with Hoechst 33342.
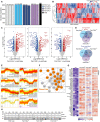
Graphical representation of the analyzed proteomes. Numbers indicate the total identified proteins.
Hierarchical clustering of label‐free quantitation (LFQ) intensities of the identified proteins in the total proteomes of Fam134s single knockout MEFs compared to wild‐type.
Volcano plot of the global proteome analysis of Fam134 single knockout MEFs compared to wild‐type cells. Proteins with Log2 Difference ≥ 1 and −Log10 P‐value > 1.3 (adjusted P‐value 0.05) were considered significantly enriched. Group comparison has been performed by t‐test statistics and adjusted for the false discovery rate (0.05 P‐value adj).
Venn Diagrams of up‐ and down‐regulated proteins in Fam134 single knockout MEFs compared to wild‐type cells.
Profile plots indicating protein levels (LFQ intensities) within clusters of identified protein presented in Fig 5D. GO cellular component (GOCC) terms are indicated together with the total number of identified proteins for each cluster.
Insets showing the stress fibers network from Fig 5E.
Heatmap of label‐free quantitation (LFQ) intensities of significantly changed proteins within cluster8 (Fig 5D), with the GO terms: Collagen and endoplasmic reticulum.
Representative Western blot for Collagen I, Vinculin and Actin from wild‐type and knockout MEF cell lysates (IN) and culture media (OUT). Min indicates time points of samples collection.
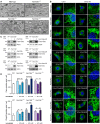
Electron microscopy of wild‐type and Fam134 single knockout MEFs (ER = endoplasmic reticulum). Scale bar: 500 nm.
Immunofluorescence images stained for endogenous Calnexin (Canx) or Climp63 in wild‐type (WT), Fam134 knockout MEFs, and Fam134 knockout MEFs reconstituted with the respective wild‐type or ∆LIR mutant Fam134 protein. Scale bar: 10 μm. Inset scale bar: 5 μm.
Representative Western blots of total cell lysate derived from MEFs used in (B) and detected for endogenous Fam134 and Actin, respectively.
Quantification of (B). At least n = 10 independent cells across three independent experiments each condition. The statistical significance was estimated by unpaired Student’s t test. All data are represented as mean ± s.e.m. and the statistical significance is defined as *P < 0.05, **P < 0.01, ***P < 0.001.
- A
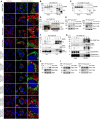
Immunofluorescence images stained for endogenous Collagen I (red) and Lamp1 (green) in wild‐type, Fam134 knockout MEFs, and Fam134 knockout MEFs reconstituted with the respective wild‐type or ∆LIR mutant Fam134 protein. Scale bar: 10 μm. Inset scale bar: 5 μm.
- B, C
Co‐Immunoprecipitation (Co‐IP) experiment of FAM134 (HA; bait) and CANX in lysates of U2OS cells overexpressing FLAG‐HA‐FAM134 wild‐type (B) or ∆LIR mutant (C) proteins.
- D
Co‐IP experiment of endogenous CANX (bait) and FAM134 in lysates of U2OS cells overexpressing FLAG‐HA‐FAM134 wild‐type proteins.
- E
Western blot of total cell lysates derived from Fam134b knockout MEFs and Fam134b knockout MEFs overexpressing the wild‐type or ∆LIR mutant of Fam134a.
- F
Co‐IP experiment of FAM134 (HA; bait) and endogenous LC3B in lysates of U2OS cells overexpressing indicated FLAG‐HA‐FAM134 proteins and grown under basal or starvation (2 h EBSS) conditions. 200 nM Bafilomycin A1 was added 2 h prior cell lysis.
- G
Co‐IP experiment of FAM134 (HA; bait) and endogenous LC3B (upper panel) or GABARAPs (lower panel) in lysates of U2OS cells overexpressing indicated FLAG‐HA‐FAM134 proteins. 200 nM Bafilomycin A1 was added 2 h prior cell lysis.
- H, I
Representative Western blot of total cell lysates derived from wild‐type (WT) MEFs and indicated Fam134 knockout MEFs overexpressing the indicated Fam134 protein.

- A
Percentage of cells that are positive for pro‐Collagen I in wild‐type (WT), Fam134 knockout MEFs, and Fam134 knockout MEFs reconstituted with the respective wild‐type or ∆LIR mutant Fam134 protein. n = 150 cells each condition.
- B, C
Representative Western blot (B) of total cell lysate and the corresponding densitometric analysis (C) of Collagen I in wild‐type MEFs and Fam134 knockout MEFs reconstituted for the respective wild‐type (WT) or ∆LIR mutant Fam134 protein. Vinculin has been used as reference for ratio calculation. The statistical significance was estimated by unpaired Student’s t test. All data are represented as mean ± s.e.m. of n = 3 biological experiments, and the statistical significance is defined as *P < 0.05, **P < 0.01, ***P < 0.001.
- D, E
Representative Western blot (D) and the relative bar plot (E) showing collagen expression in Fam134b knockout MEFs overexpressing wild type and the ΔLIR Fam134a protein.
- F, G
Representative Western blot (F) and the relative bar plot (G) showing collagen expression in Fam134b knockout MEFs overexpressing wild‐type Fam134a and Fam134c.
- H, I
Representative Western blot (H) and the relative bar plot (I) showing collagen expression in Fam134c knockout MEFs overexpressing wild‐type Fam134a and Fam134b.
- J, K
Representative Western blot (J) and the relative bar plot (K) showing collagen expression in Fam134a knockout MEFs overexpressing wild‐type Fam134b.
- L, M
Representative Western blot (L) and the relative bar plot (M) showing collagen expression in Fam134a knockout MEFs overexpressing wild‐type Fam134c.
References
Publication types
MeSH terms
Substances
LinkOut - more resources
Full Text Sources
Other Literature Sources
Molecular Biology Databases
Research Materials

