

Remodeling and activation mechanisms of outer arm dyneins revealed by cryo-EM
- PMID: 34338432
- PMCID: PMC8419702
- DOI: 10.15252/embr.202152911
Remodeling and activation mechanisms of outer arm dyneins revealed by cryo-EM
Abstract
Cilia are thin microtubule-based protrusions of eukaryotic cells. The swimming of ciliated protists and sperm cells is propelled by the beating of cilia. Cilia propagate the flow of mucus in the trachea and protect the human body from viral infections. The main force generators of ciliary beating are the outer dynein arms (ODAs) which attach to the doublet microtubules. The bending of cilia is driven by the ODAs' conformational changes caused by ATP hydrolysis. Here, we report the native ODA complex structure attaching to the doublet microtubule by cryo-electron microscopy. The structure reveals how the ODA complex is attached to the doublet microtubule via the docking complex in its native state. Combined with coarse-grained molecular dynamic simulations, we present a model of how the attachment of the ODA to the doublet microtubule induces remodeling and activation of the ODA complex.
Keywords: cilia; cryo-electron microscopy; doublet microtubule; outer arm dynein.
© 2021 The Authors.
Conflict of interest statement
The authors declare that they have no conflict of interest.
Figures
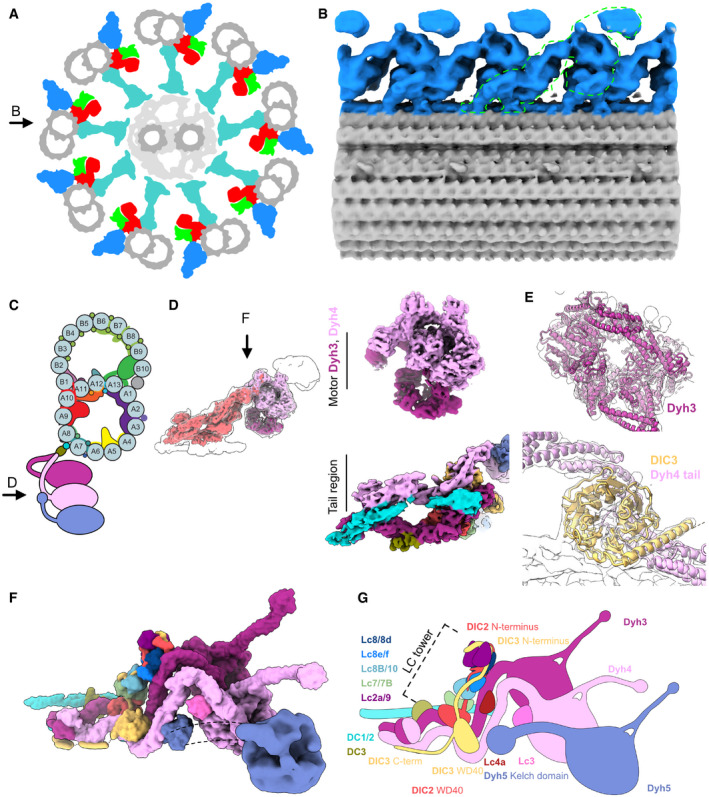
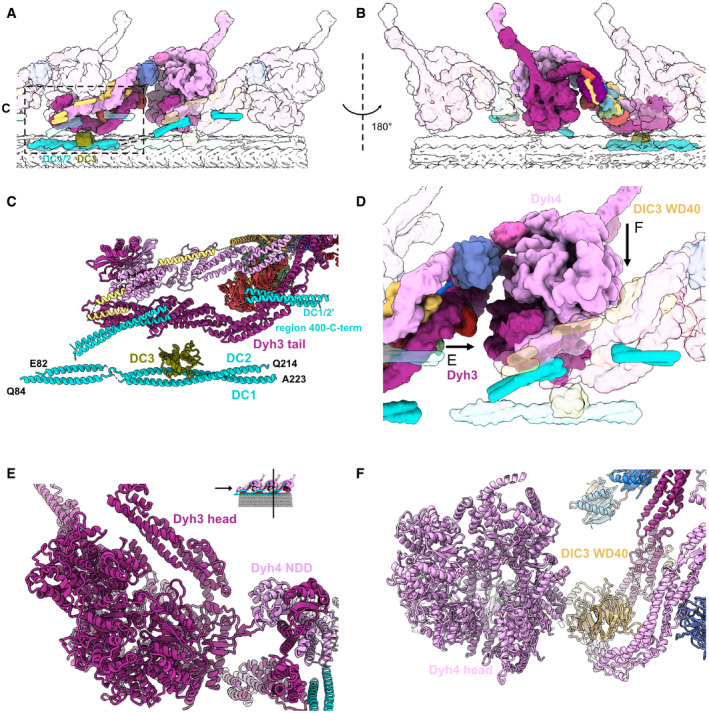
- A
Schematic diagram of axoneme structure of cilia viewed from the base of the cilia. Doublet microtubule: gray; outer dynein arm: blue; inner dynein arm: red; dynein regulatory complex: green; radial spokes: cyan. Black arrow indicates the view in (B).
- B
The 24‐nm structure of the doublet microtubule from K40R mutant filtered to 18 Å showing the row of the ODA. The green outline indicates the single ODA complex.
- C
A schematic cartoon of the doublet microtubule and the ODA complex. Arrow indicates the view in (D).
- D
The focused refined maps of the tail and the heads of the ODA are shown within the map of the entire ODA complex (left). The focused refined maps of Dyh3 and Dyh4 heads and the tail (right).
- E
Fitting of models into maps (Dyh3, top; DIC3 and Dyh4 tail, bottom). The α‐helix part of the DIC3 was more structured in our map compared with that of the Shulin–ODA complex.
- F, G
The surface render of the model (F) and the schematic cartoon (G) of the ODA with the docking complex. The Dyh5 is too flexible to resolve well by cryo‐EM. The Dyh5 head is only shown as the 18‐Å resolution surface render, and the Dyh5 tail is drawn as dotted lines. All the components (ICs, LCs, and DCs) are colored and indicated and will be used consistently in all the figures. C‐terminal side of the DIC3 has more structured region along the Dyh4 HC tail on the doublet.
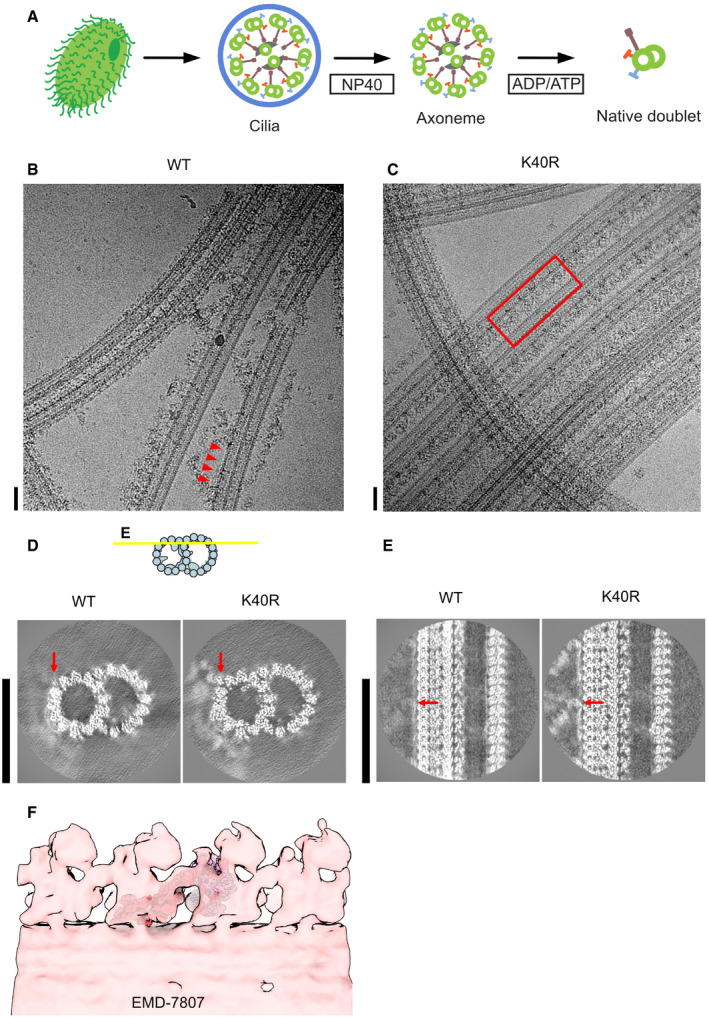
- A
The schematic of our isolation strategy for the intact doublet microtubules.
- B, C
Micrographs of doublet microtubules from Tetrahymena WT (B) and K40R mutant (C). The red arrowheads indicate the ODA complex falling off from the doublet. The red rectangle indicates the row of intact ODA in the K40R mutant. Scale bars represent 50 nm.
- D, E
24 nm structure of doublet from WT and K40R showing the DC is intact in both cases while ODA is clearly present only in K40R. Red arrows indicate the docking complex. Scale bars, 50 nm.
- F
Fitting of our high‐resolution structure into the tomographic map of Tetrahymena showing it is physiological (ΔRib72B mutant rescued with Rib72B‐GFP) (EMD‐7807, Stoddard et al, 2018).
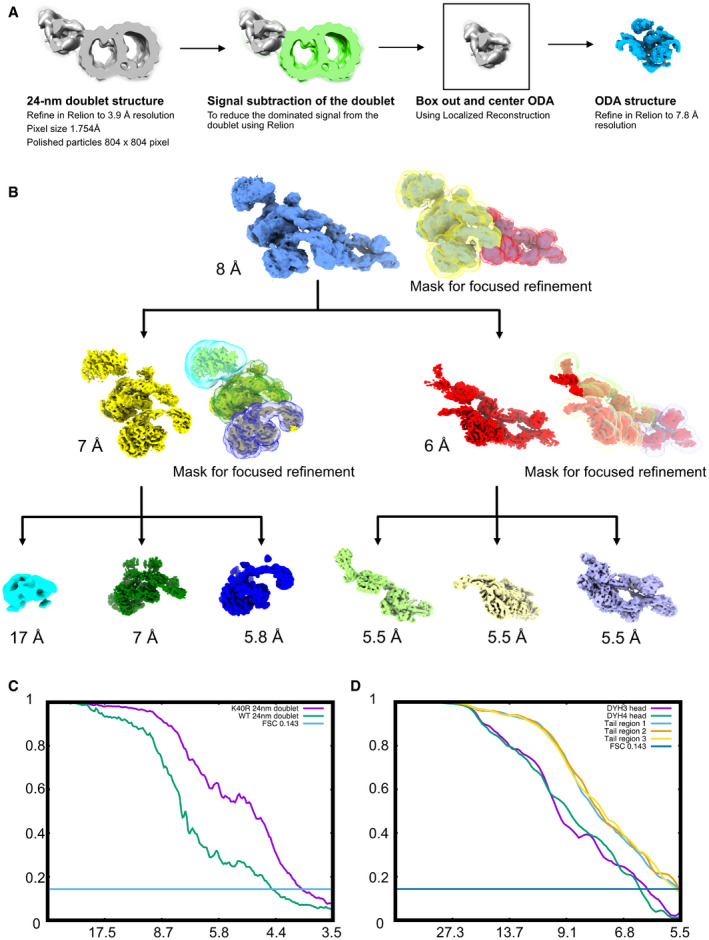
- A
Alignment strategy for ODA particles. First, we obtained the 24‐nm doublet structures. After that, we performed signal subtraction of the doublet microtubule. We centered and boxed out the ODA particles and performed refinement of the entire ODA particles.
- B
Focus refinement strategy for different regions of the ODA complex. The Dyh5 seems to be too flexible; therefore, we can only obtain Dyh4 head at 17 Å resolution.
- C
Fourier Shell Correlation of the doublet of WT and K40R & MEC17 combined data.
- D
Fourier Shell Correlation of the different regions of the ODA complex by focus refinement.
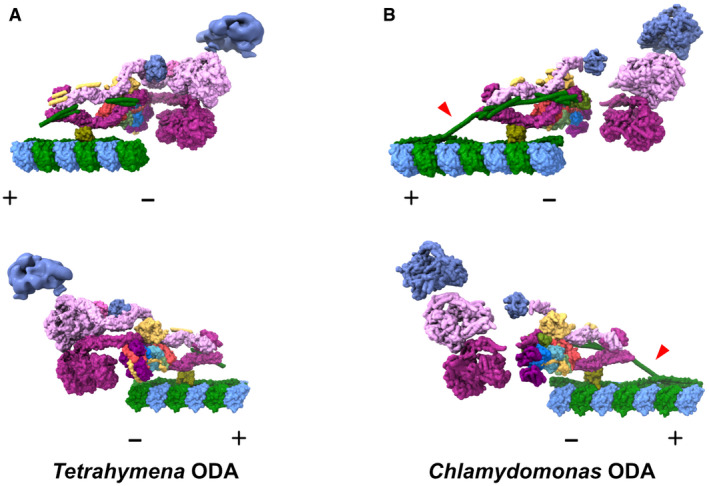
- A, B
The model of our Tetrahymena ODA complex (A) and Chlamydomonas ODA complex (PDB ID:
7KZM , Walton et al, 2021) (B) viewed from different sides. The Dyh5 head of Tetrahymena ODA is shown as 18‐Å resolution surface rendering. α‐Tubulin is shown in green and β‐tubulin is shown in blue. The polarities of the doublet microtubules are indicated by + and −. In our Tetrahymena model, there is more modeled region around the linker region. In contrast, there is more modeled region in DC in the Chlamydomonas model from Walton et al (2021), especially the region connecting the DC1/2 on the doublet surface and the extended coiled‐coil region associated with the ODA complex (red arrowheads). These differences could relate to different properties of the Tetrahymena and Chlamydomonas ODA or different ways of sample preparation.
- A, B
The stacking of the ODA complex in the axoneme viewed from inside (A) and outside (B) the cilia. All the components belonging to the middle ODA complex are shown in color. The proximal and distal ODA complexes are shown in transparent.
- C
Model of the DC and the tail of the ODA.
- D
The interaction of the head of the ODA complex with the tail of the next ODA complex unit. Dyh3 head interacts with the dimerization domain NDD of the proximal Dyh4. The Dyh4 head interacts with the DIC3 WD40 of the proximal ODA complex. Arrows indicate the views in (E) and (F).
- E
Model view of the interaction between the Dyh3 head with the dimerization domain NDD of the proximal ODA complex.
- F
Model view of the interaction between the Dyh4 head with the DIC3 WD40 of the proximal ODA complex.
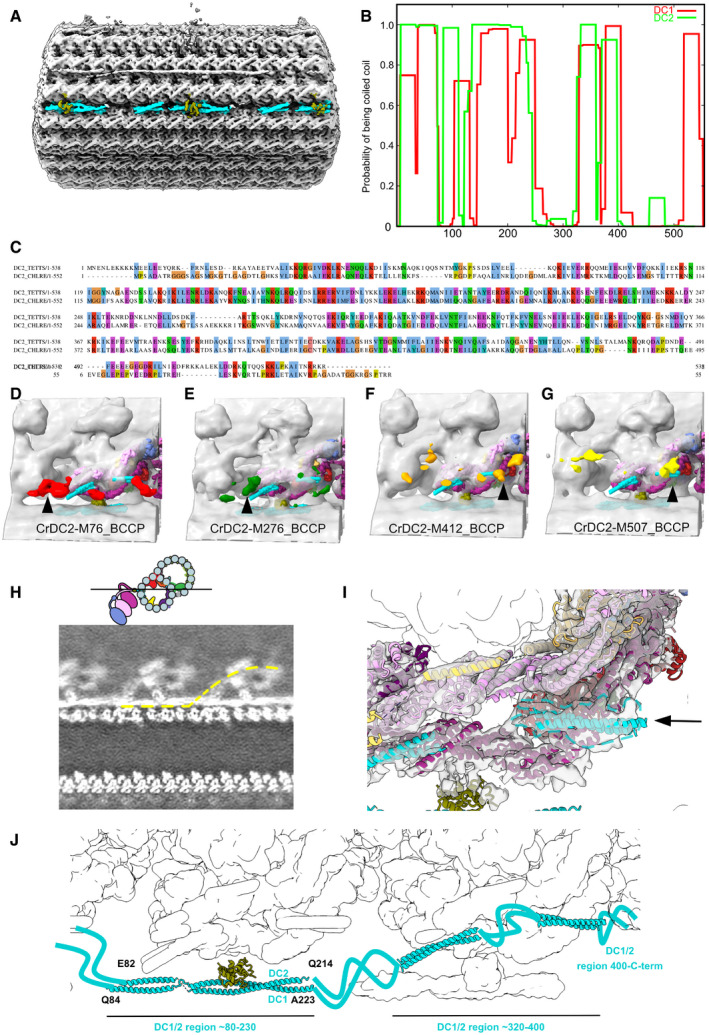
- A
The DC density on the doublet microtubule between PFs‐A7 and A8.
- B
Prediction of coiled coil for DC1 and DC2 using COILS with a window size of 28 (Lupas et al, 1991).
- C
Sequence alignment of Chlamydomonas DC1 and Tetrahymena CCDC151 homolog (Q22T00).
- D–G
Structures of Chlamydomonas ODA reconstituted on microtubules with biotin carboxyl carrier protein (BCCP) tagged in different regions of DC2 (residue 76, 276, 412, and 507) from Oda et al (2016a) (EMD‐6508, 6509, 6510, 6511). The enhanced signals of BCCP‐tag are indicated in colors.
- H
Slice from a density map showing the docking complex (position indicated in the cartoon). The yellow line indicates one continuous DC1/2.
- I
The globular density at the end of the coiled coil of DC1/2 (black arrow and dotted line).
- J
The model of the DC based on our analysis.
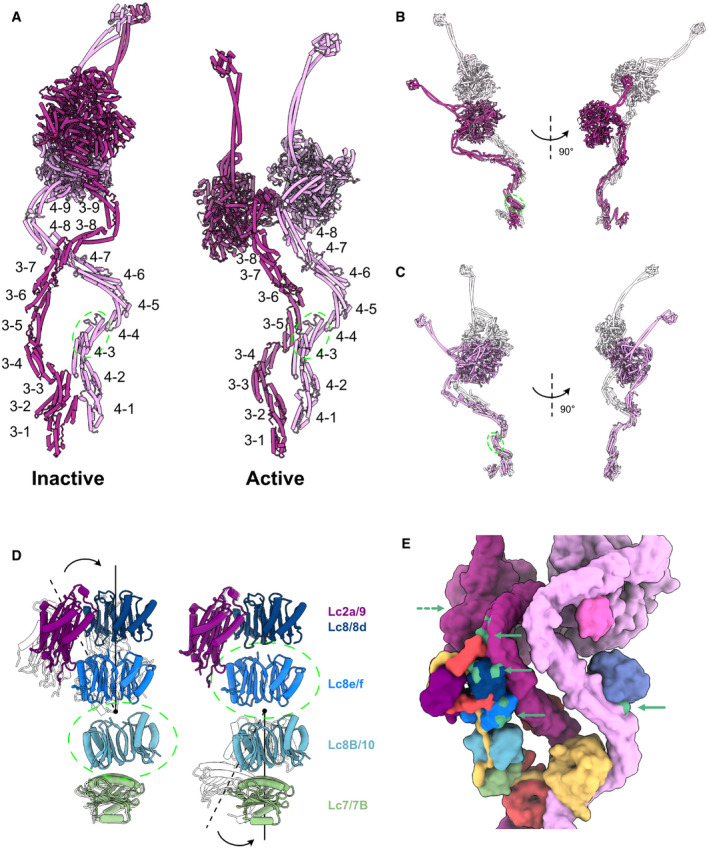
- A
The labeling of helix bundles in the inactive and active Dyh3 and Dyh4. Inactive and active structures are aligned on helix bundle 4 of Dyh4 (residues 414–513).
- B
Alignment of the inactive and active Dyh3 at helix bundle 3 (residue 448–536) showing ˜ 90‐degree rotation of the head domain (top).
- C
Alignment of inactive and active Dyh4 at helix bundle 3 (residue 414–513) showing compressing conformational changes (bottom).
- D
Bending conformational change in the LC tower. LC tower from the active ODA complex is in colors, and the LC tower from the Shulin–ODA is shown in transparent. LC towers are aligned based on either Lc8B/10 (left) or Lc8e/f (right) as indicated by green dashed circles.
- E
Regions of the ODA that interact with Shulin in the inactive conformation (green regions with green arrowhead) are spread out in the active conformation. The dash arrow indicates the region of Dyh3 head interacting with C3 domain of Shulin, now at the back of the view.
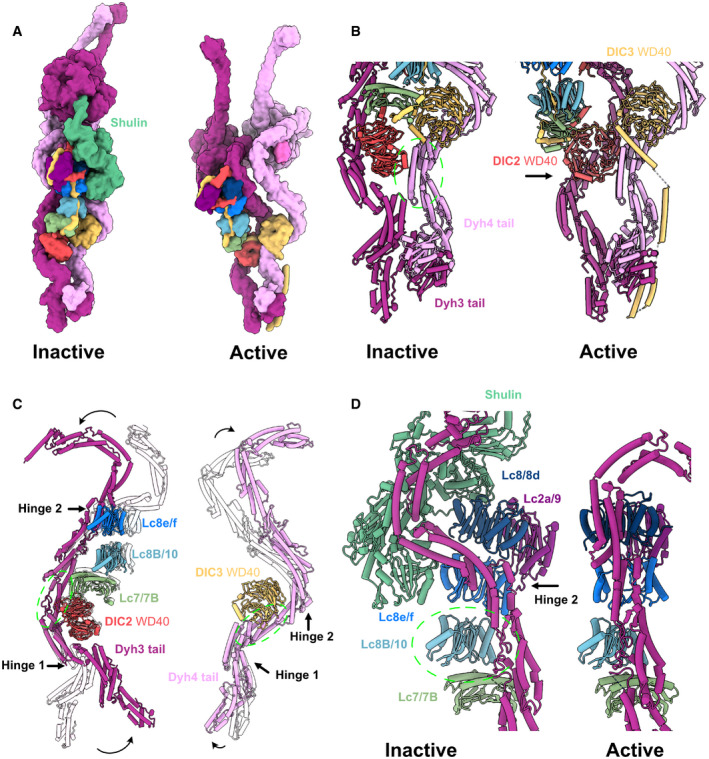
- A
The surface rendering of the inactive ODA model (with bound Shulin in green) and the active ODA model. Dyh5 is not shown.
- B
Remodeling of Dyh3 and Dyh4 tails and associated IC/LCs. The green circle indicates the region of alignment (Dyh4 residues 414–513, helix bundle 3). Dyh4 tail does not exhibit large conformational change while Dyh3 rotates almost 90 degrees, evident by the rotation of DIC2 WD40 domain.
- C
Superimposition of Dyh3 and Dyh4 tails between the inactive (transparent) and the active ODA (Dyh3 is aligned based on res. 535–646, helix bundle 5 while Dyh4 is aligned on res. 414–513, helix bundle 4). The Dyh3 tail exhibits two hinges with larger rotations while the Dyh4 tail also exhibits two hinges with smaller rotations.
- D
The changes in interaction between Dyh3 tail and the LC tower due to the remodeling of inactive (with Shulin in green) to active conformations (two structures are aligned based on Lc8b/10). The conformations of Dyh3 bundle 8, Lc8/8d, and Lc2a/9 are significantly different. The release of the Shulin leads to the rotation of the Dyh3 tail, which causes the different interaction pattern between Dyh3 and LC8/8d.
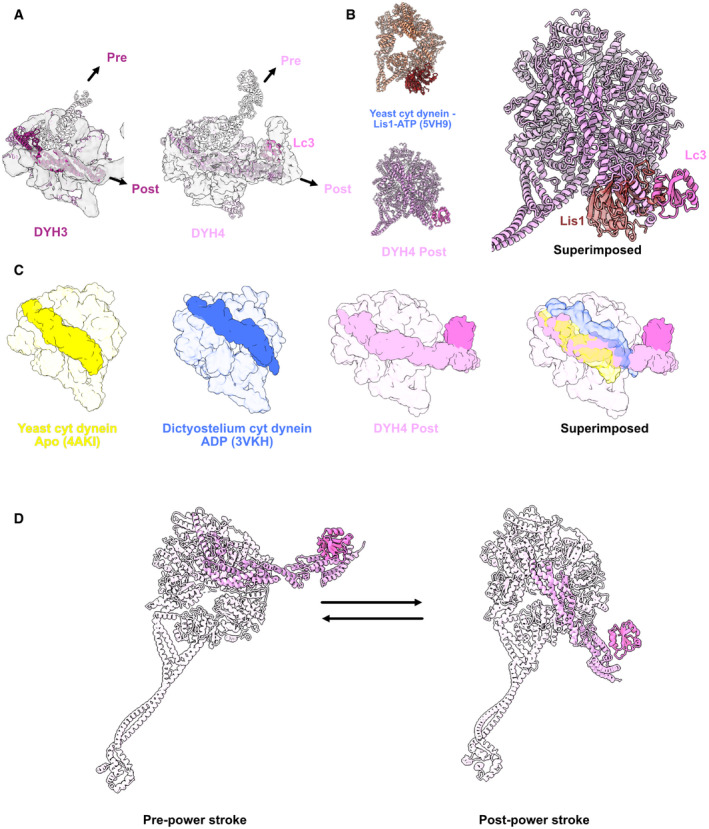
- A
Models of the Dyh3 and Dyh4 heads in post‐powerstroke conformations are fitted in the cryo‐EM maps of the ODA on the doublet. The Dyh3 and Dyh4 linkers in pre‐powerstroke conformations in the inactive Shulin–ODA model are also superimposed (shown in transparent).
- B
Comparison of yeast cytoplasmic dynein bound to Lis1 (PDB:
5VH9 ) with the Dyh4 bound to LC3. LC3 also binds to the AAA+ ring but in an opposite site from Lis1. - C
Comparison of the linker of Dyh4 in post‐powerstroke conformation with the yeast cytoplasmic dynein in apostate and dictyostelium cytoplasmic dynein in ADP state reveals that the Dyh4 linker is positioned in between of the linker positions in apo and ADP states. The structures are aligned based on the AAA+ ring without linker.
- D
Model for the conformation changes from pre‐powerstroke to post‐powerstrokes in Dyh4.
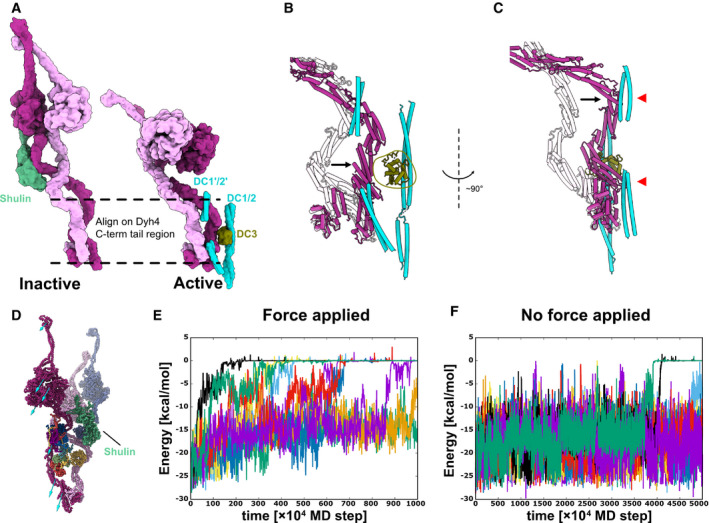
- A
Models of the inactive and the active ODA. Dyh3 and Dyh4 parts from the models are shown with Shulin and docking complex, respectively. The two structures are aligned based on the Dyh4 residues 414–513 (helix bundle 3).
- B, C
Detailed comparison of the Dyh3 before and after the remodeling. With the two structures aligned as in (A), Dyh3 tail in the active conformation indicates significant shift toward DC3 (B). Similarly, the Dyh3 tail in the active conformation indicates a significant shift toward the extended coiled‐coil region of DC1/2 (˜ 320–400 aa). Red arrowheads indicate the interaction sites of Dyh3 with the extended coiled‐coil region of DC1/2.
- D
Coarse grain molecular dynamics of the inactive Shulin–ODA complex. External force was applied in the direction of the arrow to simulate the remodeling of Dyh3 upon binding to the doublet microtubule. Shulin is shown in green.
- E, F
Energy trajectories between Shulin and the ODA complex with (E) and without (F) external force applied to Dyh3. 8 out of 10 setups showed detachment of Shulin (energy = 0) with external force in 1,000 × 104 MD steps, which roughly corresponds to 10 μs. (E). In contrast, only two out of 10 trajectories showed Shulin detachment without applied force even with 5,000 × 104 MD steps, which approximately corresponds to 50 μs. (F). It should be noted that our coarse‐grained MD simulation is performed in the condition where Shulin binding to the ODA complex is weakened, but it still showed the difference in detachment rate of Shulin in response to the global conformational change in the ODA complex.
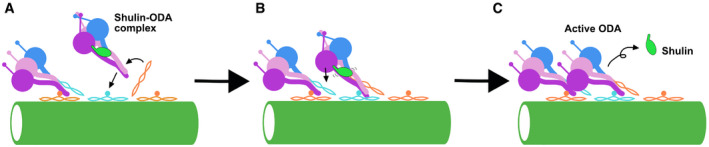
- A
Shulin–ODA docks on the doublet through interaction between the tail region of Dyh3 and the DC3.
- B
Extended coiled‐coil region of the DC1/2 catches the ODA complex at the tail domain and facilitates the remodeling of the tail. Head domain of Dyh3 also interacts with the neighboring ODA complex's tail. Therefore, the Dyh3 is “pulled” toward the doublet and binding of the Shulin destabilizes.
- C
Shulin detaches from the ODA complex and the head domains are remodeled and aligned parallel to each other. Head domains are also in post‐powerstroke conformations and ready to exert force.
References
-
- Abrishami V, Ilca SL, Gomez‐Blanco J, Rissanen I, de la Rosa‐Trevín JM, Reddy VS, Carazo J‐M, Huiskonen JT (2020) Localized reconstruction in scipion expedites the analysis of symmetry mismatches in Cryo‐EM data. Prog Biophys Mol Biol 160: 43–52 - PubMed
-
- Brokaw CJ, Kamiya R (1987) Bending patterns of Chlamydomonas flagella: IV. Mutants with defects in inner and outer dynein arms indicate differences in dynein arm function. Cell Motil Cytoskeleton 8: 68–75 - PubMed
Publication types
MeSH terms
Substances
Grants and funding
LinkOut - more resources
Full Text Sources
Other Literature Sources
