Comparative Study
. 2021 Aug 2:10:e68293.
doi: 10.7554/eLife.68293.

Contrasting effects of Western vs Mediterranean diets on monocyte inflammatory gene expression and social behavior in a primate model

Affiliations
Comparative Study

Contrasting effects of Western vs Mediterranean diets on monocyte inflammatory gene expression and social behavior in a primate model

Corbin S C Johnson et al. Elife. .

Abstract

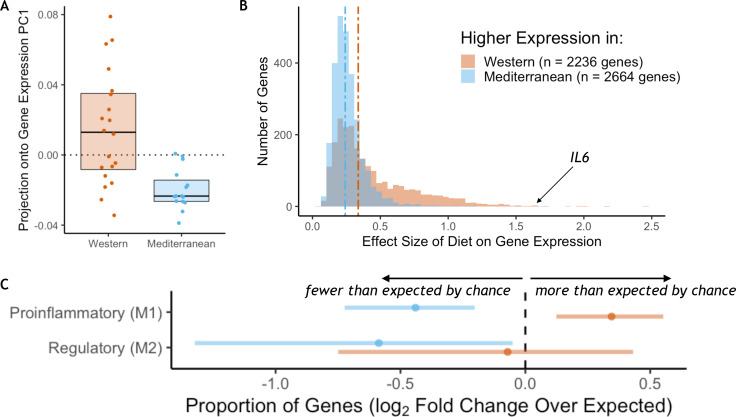
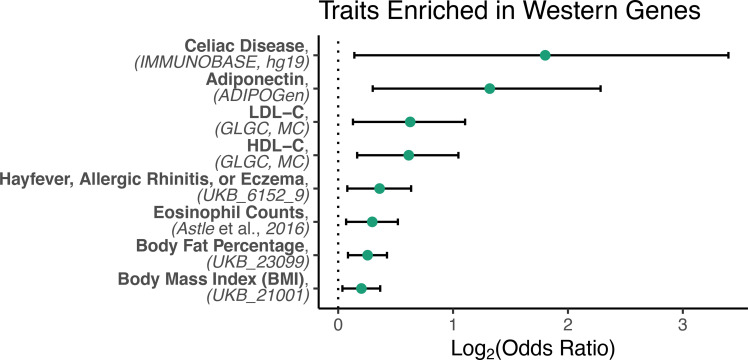
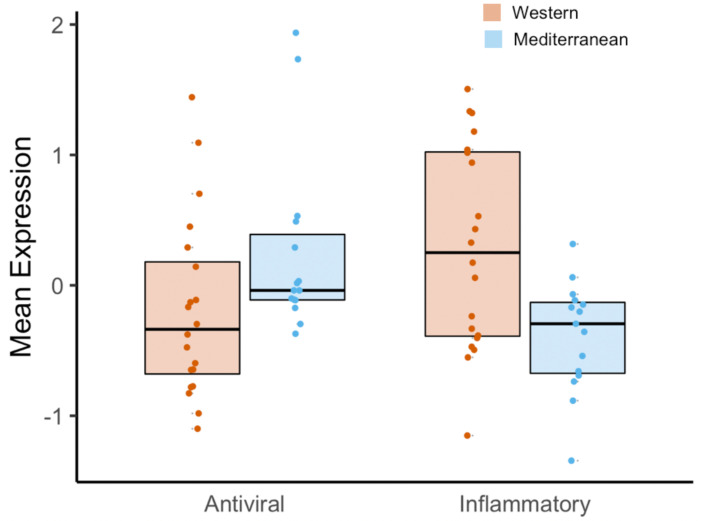
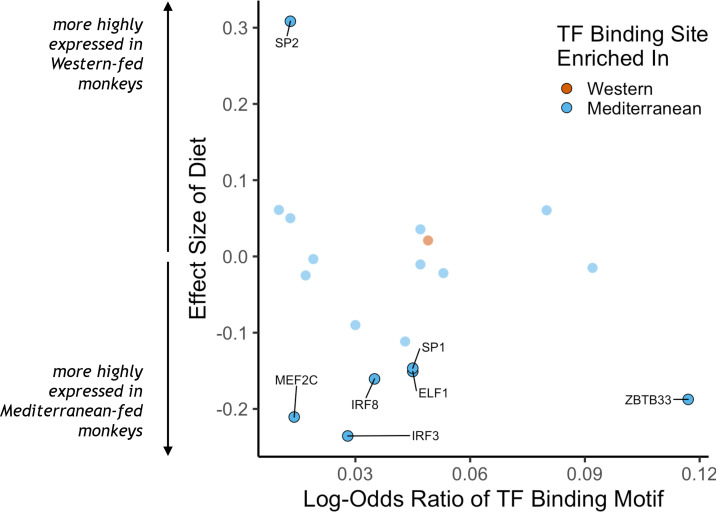
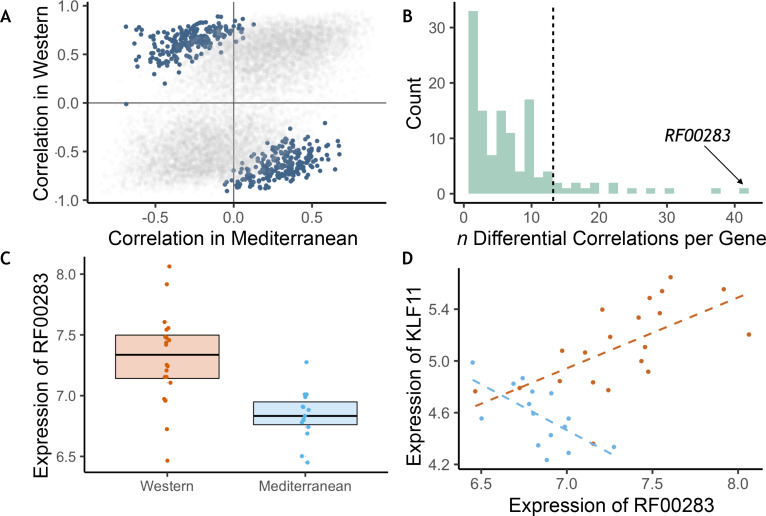
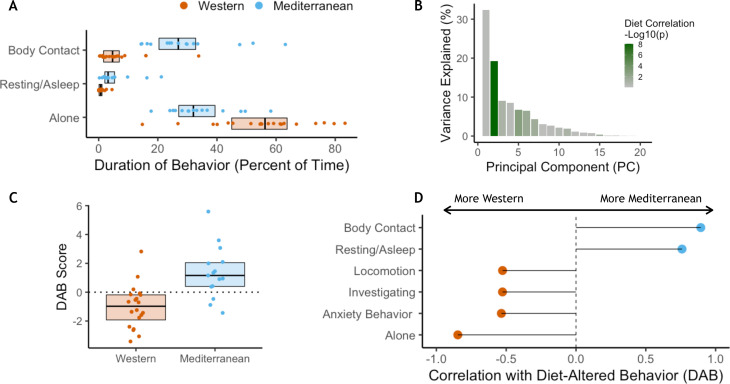
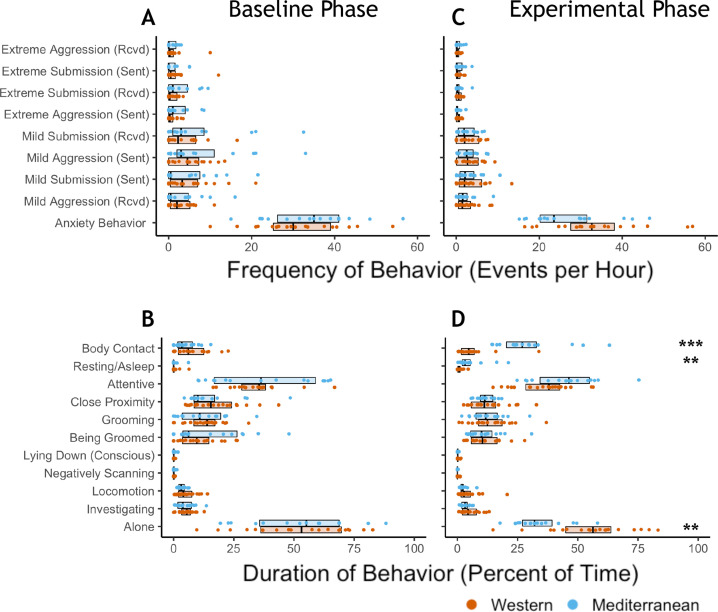
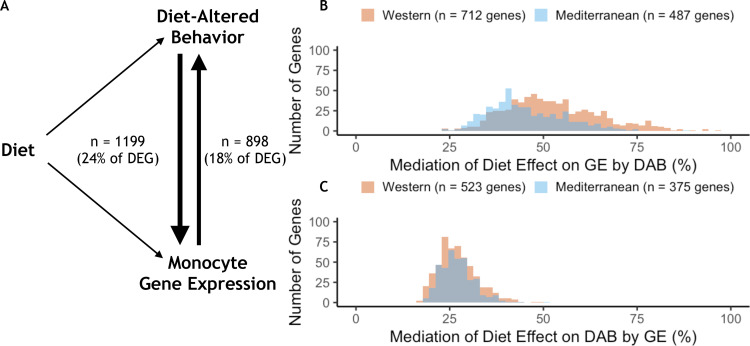
Dietary changes associated with industrialization increase the prevalence of chronic diseases, such as obesity, type II diabetes, and cardiovascular disease. This relationship is often attributed to an 'evolutionary mismatch' between human physiology and modern nutritional environments. Western diets enriched with foods that were scarce throughout human evolutionary history (e.g. simple sugars and saturated fats) promote inflammation and disease relative to diets more akin to ancestral human hunter-gatherer diets, such as a Mediterranean diet. Peripheral blood monocytes, precursors to macrophages and important mediators of innate immunity and inflammation, are sensitive to the environment and may represent a critical intermediate in the pathway linking diet to disease. We evaluated the effects of 15 months of whole diet manipulations mimicking Western or Mediterranean diet patterns on monocyte polarization in a well-established model of human health, the cynomolgus macaque (Macaca fascicularis). Monocyte transcriptional profiles differed markedly between diets, with 40% of transcripts showing differential expression (FDR < 0.05). Monocytes from Western diet consumers were polarized toward a more proinflammatory phenotype. The Western diet shifted the co-expression of 445 gene pairs, including small RNAs and transcription factors associated with metabolism and adiposity in humans, and dramatically altered behavior. For example, Western-fed individuals were more anxious and less socially integrated. These behavioral changes were also associated with some of the effects of diet on gene expression, suggesting an interaction between diet, central nervous system activity, and monocyte gene expression. This study provides new molecular insights into an evolutionary mismatch and uncovers new pathways through which Western diets alter monocyte polarization toward a proinflammatory phenotype.

Keywords: Macaca fascicularis; behavior; diet; epidemiology; evolutionary mismatch; gene regulation; global health; immunology; inflammation; monocyte.


Conflict of interest statement

CJ, CS, KM, AL, RD, TH, GH, SA, YL, CM, DH, EI, TR, NS No competing interests declared

Figures

Figure 1.
Figure 1.. Diet effects on monocyte gene expression.
(A) Diet was significantly associated with the first principal component of gene expression (59% variance explained, t(25.1) = 4.4, p = 1.72 x 10⁻⁴). (B) The average effect size of diet on Western genes was 60% stronger than the effect size of diet on Mediterranean genes (Mann-Whitney U = 4.1 x 10⁶, p = 6.1 x 10−117). (C) Western genes (orange) contained more M1 genes than expected by chance, indicating that the Western diet induced a shift toward a proinflammatory monocyte phenotype. Western genes were enriched for proinflammatory (M1-like) genes (fold-enrichment = 1.27, 95% CI = 1.09, 1.46), while Mediterranean genes (blue) were depleted of these same M1-like genes (fold-enrichment = 0.74, 95% CI = 0.61, 0.88). Regulatory (M2-like) genes were also under-represented in Mediterranean genes (fold-enrichment = 0.67, 95% CI = 0.40, 0.97), but not in Western genes (fold-enrichment = 0.95, 95% CI = 0.60, 1.35). Figure 1—figure supplement 1. The sets of Western and Mediterranean genes were compared to genes implicated in 103 complex human diseases and traits (Zhang et al., 2020). Fisher’s Exact Tests were used to calculate the enrichment of trait-associated genes in Western genes that are depicted here (FDR < 0.02, 95% CI) and no traits were enriched in Mediterranean genes. Figure 1—figure supplement 2. Western-diet fed animals exhibited significantly higher expression of pro-inflammatory genes involved in the conserved transcriptional response to adversity (CTRA Cole et al., 2015; Mann-Whitney U = 222, p = 0.016) and lower expression of antiviral- and antibody-related CTRA genes (Mann-Whitney U = 82, p = 0.023), both consistent with the CTRA. See Supplementary file 1A for CTRA categories.
Figure 1—figure supplement 1.
Figure 1—figure supplement 1.. Genes with significantly higher expression in monkeys fed the Western diet (‘Western genes’) were enriched for genes associated with numerous complex human diseases and traits.
Figure 1—figure supplement 2.
Figure 1—figure supplement 2.. Expression of genes in the conserved transcriptional response to adversity (CTRA Cole et al., 2015) indicate inflammatory effects of a Western diet that parallel the effects of social adversity.
Figure 2.
Figure 2.. Transcription factor (TF) binding motifs correlated with diet effects on gene expression.
The log-odds ratio of TF binding motif enrichment in Western genes (orange) or Mediterranean genes (blue) are depicted on the x-axis. The y-axis shows the effect size of diet on the expression of the gene that encodes for the TF. Only TFs with binding motifs significantly enriched in either gene set and that were detectably expressed in our samples are shown, with those significantly affected by diet (FDR < 0.05) outlined and labeled.
Figure 3.
Figure 3.. Diet altered monocyte gene co-expression.
(A) The Pearson correlation between each pair of genes within each of the experimental diets. Gene pairs that were significantly differently correlated between diets are highlighted in blue (n = 445 significant pairs, FDR < 0.2). (B) Of the genes involved in significant pairs, some were paired with more genes than expected by chance, called ‘hub’ genes (n = 16 hub genes; dotted black line is the maximum number of significant pairs expected by chance). The strongest hub gene was the non-coding RNA RF00283. (C) Residual normalized expression of RF00283 is significantly greater in Western- than Mediterranean-fed monkeys (βdiet = 0.51, FDR = 2.3 x 10⁻⁶). (D) Example of a differential correlation involving RF00283. Residual normalized expression of RF00283 is plotted against expression of KLF11, a differentially-expressed transcription factor that regulates insulin and has been associated with type II diabetes in humans (Neve et al., 2005). The two genes were more highly expressed in Western monocytes, were positively correlated with one another in Western-fed monkeys (Pearson’s r = 0.61, p = 4.2 x 10⁻³), were negatively correlated in Mediterranean-fed monkeys (Pearson’s r = −0.63, p = 0.011), and were differentially correlated between the two diets (p = 4.1 x 10⁻⁵, FDR = 0.11).
Figure 4.
Figure 4.. Diet alters behavioral phenotype.
(A) Three behaviors were significantly different between the two diet groups. Monkeys fed the Mediterranean diet spent more time in body contact (Holm-Bonferroni adjusted p (pHB) = 1.1 x 10⁻⁵) and resting (pHB = 1.6 x 10⁻³) than Western-fed monkeys. Monkeys eating the Western diet spent more time alone than Mediterranean-fed monkeys (pHB = 4.9 x 10⁻³). (B) Principal component 2 (PC2) explained 19% of the variance in behavior and was the only PC significantly correlated with diet. (C) PC2 represents a composite measure of diet-altered behavior, as individual loadings onto PC2 (‘DAB scores’; 19% of all variance in behavior) were significantly higher in Mediterranean diet compared to Western diet animals (t(26.8) = 4.13, p = 3.2 x 10⁻⁴). (D) Six of the 20 behaviors observed are significantly correlated with DAB score (pHB < 0.05). Here, significant correlations with DAB score in which behaviors are more frequent in Mediterranean diet or Western diet monkeys are indicated with blue or orange points, respectively. Figure 4—figure supplement 1. There were no differences between the Western- and Mediterranean-fed groups in the rates (A) or duration (B) of behaviors during the baseline phase, prior to diet manipulation. The boxplots depict the per-group medians and interquartile ranges for each behavior. Animals fed the Western diet are colored orange, and those fed the Mediterranean diet colored blue. Significant differences between the diet groups in the rates (C) or duration (D) of behaviors during the experimental phase are indicated (Mann-Whitney U test, Holm-Bonferroni adjusted p < 0.05 *, p < 0.01 **, p < 0.001 ***). Figure 4—figure supplement 2. The first axis of variance in behavior—which explained 31% of the overall variance—was significantly positively correlated with dominance rank across diets (Pearson’s r = 0.84, p = 3.9 x 10⁻¹⁰). All monkeys are assigned a rank between 0 and 1 based on the outcomes of dyadic interactions, where a higher rank indicates more dominant social status.
Figure 4—figure supplement 1.
Figure 4—figure supplement 1.. Diet manipulation altered behavior.
Figure 4—figure supplement 2.
Figure 4—figure supplement 2.. The first PC of all behavioral data captures dominance rank.
Figure 5.
Figure 5.. Behavior partially mediates the effect of diet on gene expression for 24% of diet-associated genes.
(A) Diet-altered behavior (DAB) mediated the effect of diet on gene expression for 24% (n = 1199) of genes for which diet had an effect (differentially expressed genes or DEGs). For 18% of DEGs, gene expression mediated the effect of diet on DAB score. (B) DAB score mediated 23–97% of the total effect of diet on gene expression in 1199 genes (n = 712 Western genes, orange; n = 487 Mediterranean genes, blue). DAB score mediated a greater number of Western genes than Mediterranean genes (p = 1.5 x 10⁻²¹) and accounted for a greater portion of the effect size of diet (p = 6.4 x 10⁻²⁵) in Western genes. (C) In gene-by-gene models of DAB score as a function of diet + gene expression, gene expression mediated 17–51% of the total effect of diet on DAB in 898 genes (n = 523 Western genes; n = 375 Mediterranean genes). Gene expression mediated a greater number of Western genes than Mediterranean genes (p = 4.6 x 10⁻¹⁴), although expression of these genes did not account for more of the effect of diet on DAB score than Mediterranean genes (Mann-Whitney U = 1.0 x 10⁵, p = 0.55).
Appendix 1—figure 1.
Appendix 1—figure 1.. RNA Integrity was correlated with both uncorrected gene expression and relative rank.
(A) RNA integrity (RIN) was correlated with PC1 of gene expression (62% of overall variance in gene expression) prior to correction for batch effects (Pearson’s r = 0.41, p = 0.020). Because of this, RIN was included as a batch effect prior to downstream analysis. (B) RIN was also correlated with relative dominance rank (Pearson’s r = 0.49, p = 5.1 x 10⁻³). Points are colored to indicate Western (orange) or Mediterranean (blue) diet to show that diet did not have an interactive effect in either case.
Appendix 2—figure 1.
Appendix 2—figure 1.. Greater phenotypic variability in Western diet fed monkeys does not show consistency in individual responsiveness across phenotypes.
(A) Monkeys fed the Western diet showed more variability than monkeys fed the Mediterranean diet in both diet-altered behavior (DAB) and change in body weight. However, the two phenotypes were not correlated within monkeys fed the Western diet (Pearson’s rWestern = −0.26, p = 0.28). (B) Western fed monkeys also showed more variability in the first principal component (PC1) of gene expression than Mediterranean fed monkeys. DAB and PC1 of gene expression were not significantly correlated in Western fed monkeys (Pearson’s rWestern = −0.13, p = 0.60). (C) PC1 of gene expression and change in body weight were not significantly correlated in Western fed monkeys (Pearson’s rWestern = −0.22, p = 0.36).
Appendix 2—figure 2.
Appendix 2—figure 2.. Quality control of cell purity by CD14 and CD3 expression levels: three samples were excluded due to lower CD14 and high CD3 – possible T cell contamination.
Normalized expression (reads per kilobase million) of CD14 and CD3 are plotted as markers of monocytes and T cells, respectively. Three samples were excluded as outliers due to possible T cell contamination.

Comment in

References

    1. Adams MR, Register TC, Golden DL, Wagner JD, Williams JK. Medroxyprogesterone acetate antagonizes inhibitory effects of conjugated equine estrogens on coronary artery atherosclerosis. Arteriosclerosis, Thrombosis, and Vascular Biology. 1997;17:217–221. doi: 10.1161/01.ATV.17.1.217. - DOI - PubMed
    1. Addo J, Ayerbe L, Mohan KM, Crichton S, Sheldenkar A, Chen R, Wolfe CD, McKevitt C. Socioeconomic status and stroke: an updated review. Stroke. 2012;43:1186–1191. doi: 10.1161/STROKEAHA.111.639732. - DOI - PubMed
    1. Akdemir D, Godfrey OU. R package; 2015. https://CRAN.R-project.org/package=EMMREML
    1. Alexa A, Rahnenfuhrer J. R package; 2019. https://rdrr.io/bioc/topGO/
    1. Bédard A, Riverin M, Dodin S, Corneau L, Lemieux S. Sex differences in the impact of the Mediterranean diet on cardiovascular risk profile. British Journal of Nutrition. 2012;108:1428–1434. doi: 10.1017/S0007114511006969. - DOI - PubMed

Publication types

Associated data