. 2021 Dec 4;72(22):7808-7825.
doi: 10.1093/jxb/erab365.

Small molecule inhibitors of mammalian GSK-3β promote in vitro plant cell reprogramming and somatic embryogenesis in crop and forest species

Affiliations

Small molecule inhibitors of mammalian GSK-3β promote in vitro plant cell reprogramming and somatic embryogenesis in crop and forest species

Eduardo Berenguer et al. J Exp Bot. .

Abstract

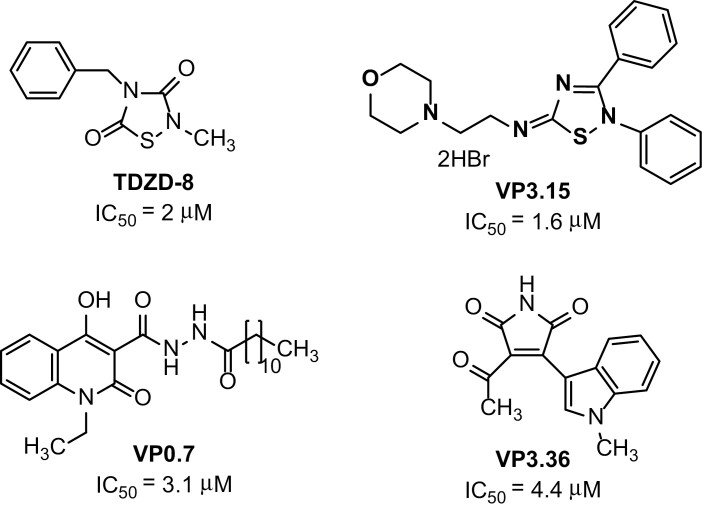
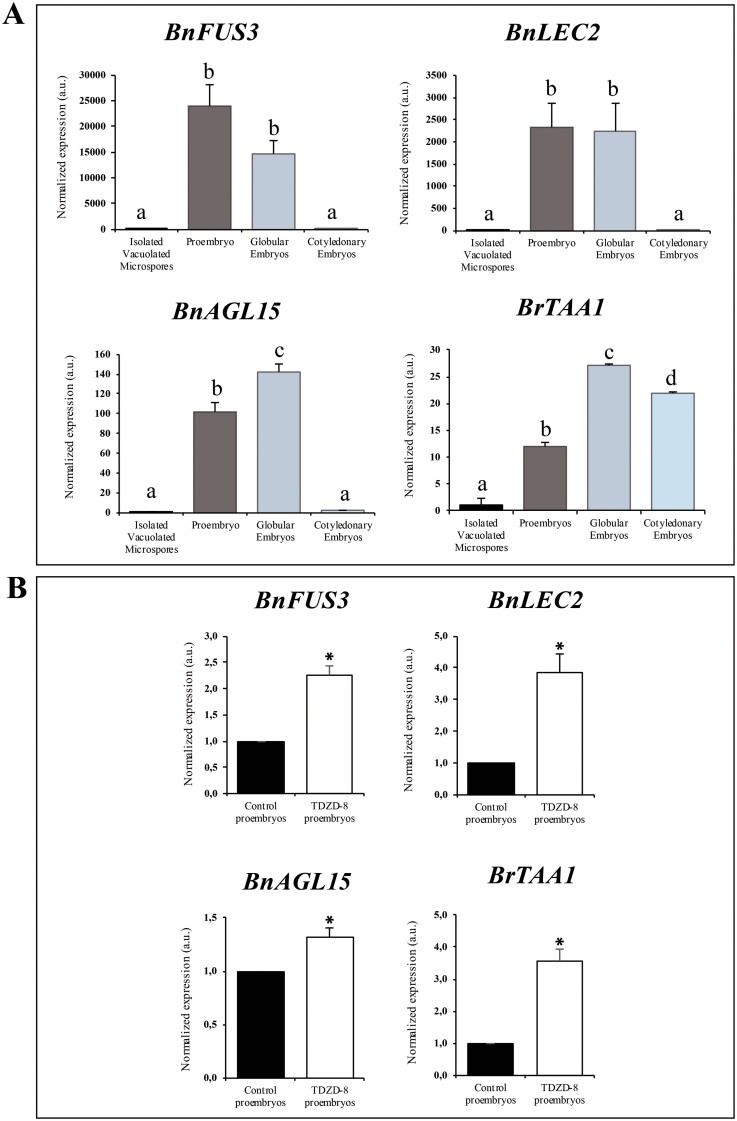
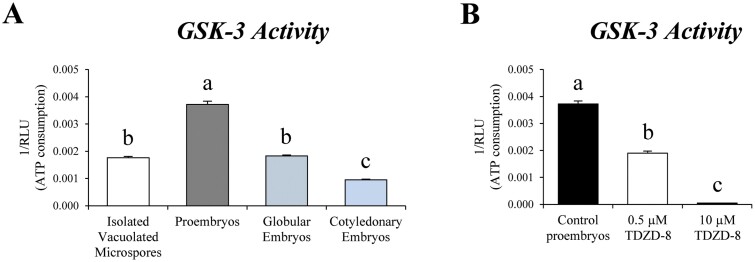
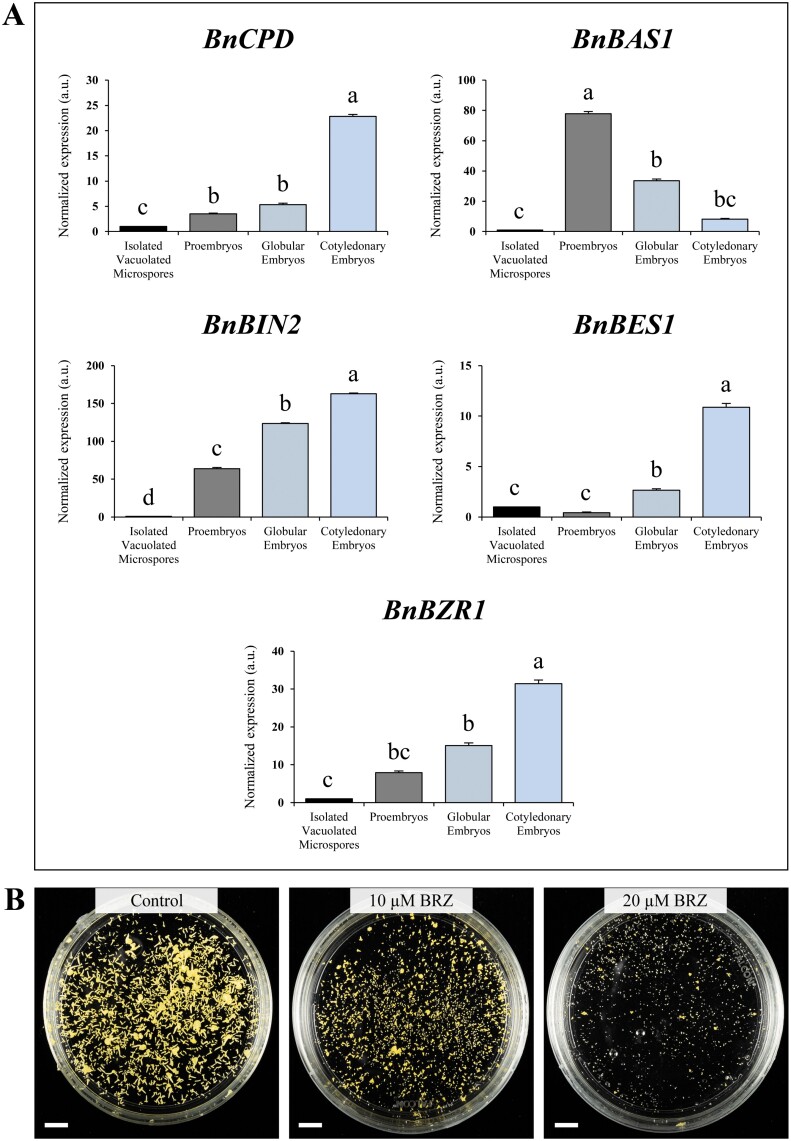
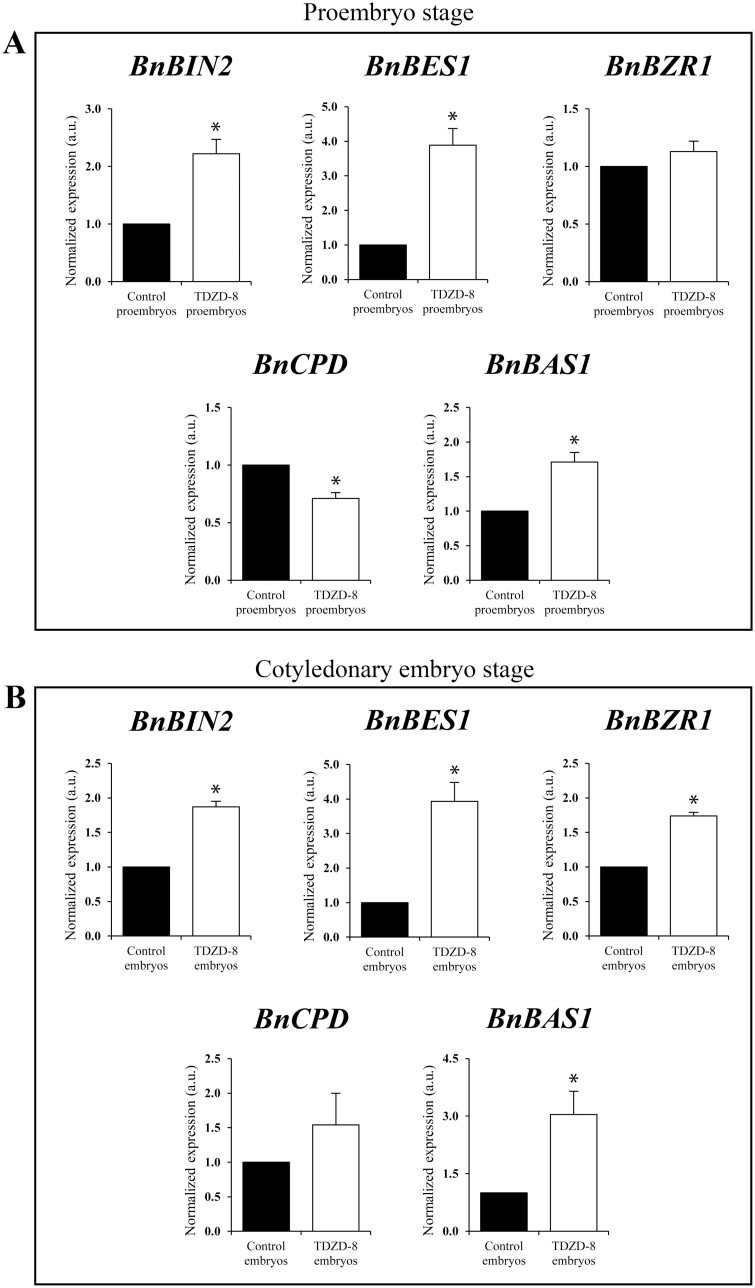
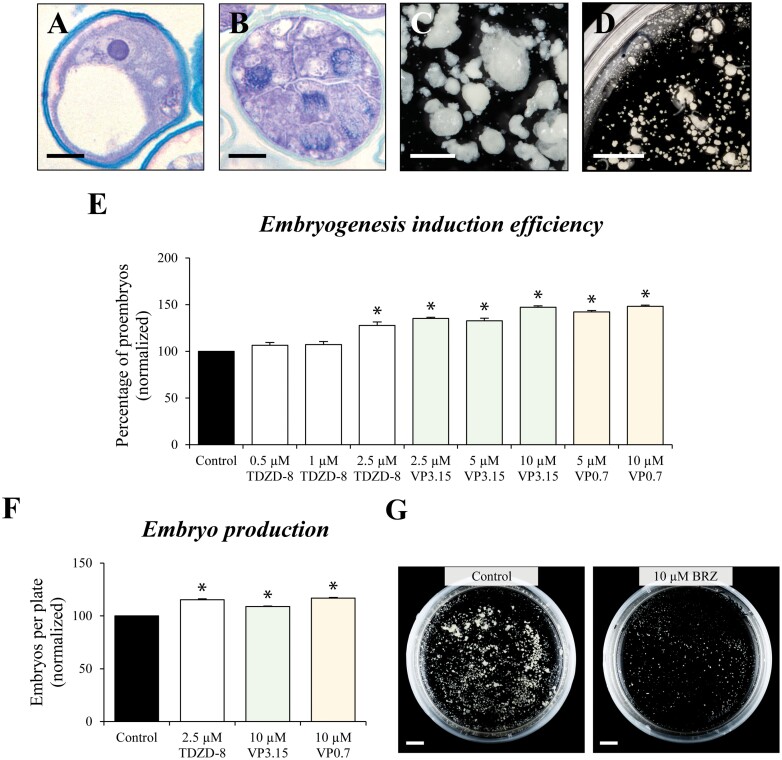
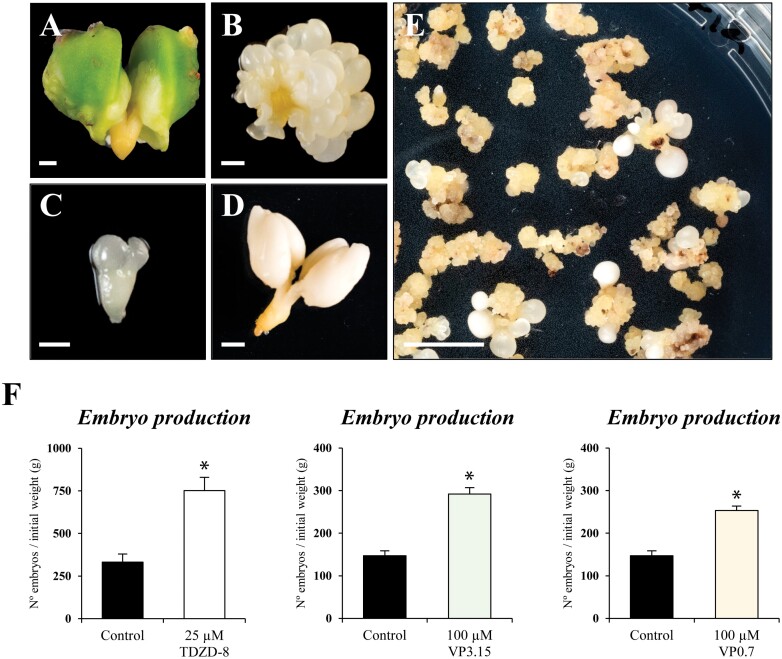
Plant in vitro regeneration systems, such as somatic embryogenesis, are essential in breeding; they permit propagation of elite genotypes, production of doubled-haploids, and regeneration of whole plants from gene editing or transformation events. However, in many crop and forest species, somatic embryogenesis is highly inefficient. We report a new strategy to improve in vitro embryogenesis using synthetic small molecule inhibitors of mammalian glycogen synthase kinase 3β (GSK-3β), never used in plants. These inhibitors increased in vitro embryo production in three different systems and species, microspore embryogenesis of Brassica napus and Hordeum vulgare, and somatic embryogenesis of Quercus suber. TDZD-8, a representative compound of the molecules tested, inhibited GSK-3 activity in microspore cultures, and increased expression of embryogenesis genes FUS3, LEC2, and AGL15. Plant GSK-3 kinase BIN2 is a master regulator of brassinosteroid (BR) signalling. During microspore embryogenesis, BR biosynthesis and signalling genes CPD, GSK-3-BIN2, BES1, and BZR1 were up-regulated and the BAS1 catabolic gene was repressed, indicating activation of the BR pathway. TDZD-8 increased expression of BR signalling elements, mimicking BR effects. The findings support that the small molecule inhibitors promoted somatic embryogenesis by activating the BR pathway, opening up the way for new strategies using GSK-3β inhibitors that could be extended to other species.

Keywords: Barley; brassinosteroids; cell reprogramming; cork oak; glycogen synthase kinase; microspore embryogenesis; rapeseed; small molecule inhibitors; somatic embryogenesis.


Figures

Fig. 1.
Fig. 1.
Molecular structure of the small molecule inhibitors of mammalian GSK-3β. The compounds are named TDZD-8, VP3.15, VP0.7, and VP3.36. The inhibitory potency of each compound is indicated by their IC50 values which are the concentration required to inhibit, in vitro, 50% of the human GSK-3 enzymatic activity.
Fig. 2.
Fig. 2.
Developmental stages of microspore embryogenesis of B. napus. Representative micrographs of toluidine blue-stained sections of (A) isolated vacuolated microspore (culture initiation), (B) proembryo (embryogenesis initiation), (C) globular embryo, and (D, E) cotyledonary embryos. (D) Detail at higher magnification. (E) Panoramic view of a region of the culture plate. Scale bars, 10 µm in (A–C); 1 mm in (D); and 10 mm in (E).
Fig. 3.
Fig. 3.
Effect of small molecule GSK-3β inhibitors on embryogenesis induction efficiency in microspore cultures of B. napus. (A) Histogram with the quantification of proembryos, the first sign of embryogenesis initiation, in control cultures and cultures treated with the four small molecules at different concentrations. (B) Representative micrograph of a 4 d microspore culture showing proembryos formed (indicated by arrows). Scale bar=20 µm. (C) Histogram with proembryo quantification in control and treated cultures with the selected (best) concentration of each compound. Columns represent the mean ±SEM. Values have been normalized to the control culture (100%). Asterisks in (A) and (C) indicate statistically significant differences (P<0.05) between control and treated cultures obtained after Student’s t-test.
Fig. 4.
Fig. 4.
Effects of TDZD-8 on microspore embryogenesis progression in B. napus. (A) DAPI staining of proembryos in control and TDZD-8-treated cultures, revealing several nuclei (blue signal) in the proembryos, which indicates embryogenesis initiation. (B) Microspore culture after 30 d treatment with TDZD-8 showing predominantly cotyledonary embryos. (C) Quantification of total embryo production in control and TDZD-8-treated cultures after 30 d culture. Columns represent the mean ±SEM. Values have been normalized to the control culture (100%). Asterisks indicate statistically significant differences (P<0.05) between control and treated cultures by Student’s t-test. (D) Germinated embryos of control and TDZD-8-treated cultures. Scale bars, 10 µm in (A); and 10 mm in (B, D).
Fig. 5.
Fig. 5.
Effect of TDZD-8 on expression of embryogenesis marker genes in microspore embryogenesis of B. napus. (A) Expression profiles during microspore embryogenesis of BnFUS3, BnLEC2, BnAGL15 (embryogenesis-specific genes), and BnTAA1 (auxin biosynthesis gene) in control cultures without the inhibitor. Values are normalized to vacuolated microspore expression levels. Data represent the mean ±SEM. Different letters indicate statistically significant differences (P<0.05) obtained after ANOVA and subsequent Tukey HSD tests. (B) Expression of BnFUS3, BnLEC2, BnAGL15, and BnTAA1 in control and TDZD-8-treated cultures at the proembryo stage. Values are normalized to control culture levels. Data represent the mean ±SEM. Asterisks indicate statistically significant differences (P<0.05) obtained by Student’s t-test.
Fig. 6.
Fig. 6.
GSK-3 enzymatic activity during microspore embryogenesis in B. napus in control conditions and under TDZD-8 treatment. (A) The histogram represents GSK-3 enzymatic activity during consecutive developmental stages of microspore embryogenesis, quantified as ATP consumption (see the Materials and methods). (B) The histogram represents GSK-3 enzymatic activity at the proembryo stage in control cultures and cultures treated with 0.5 µM and 10 µM TDZD-8. Data represent the mean ±SEM. Different letters indicate statistically significant differences (P<0.05) obtained after ANOVA and subsequent Tukey HSD tests.
Fig. 7.
Fig. 7.
Expression patterns of genes of the brassinosteroid pathway and effect of brassinazole (BRZ) in microspore embryogenesis of B. napus. (A) RT-qPCR analysis of transcript accumulation of BnCPD (a BR biosynthesis gene), BnBAS1 (a BR catabolism gene), BnBIN2, BnBES1, and BnBZR1 (BR signalling pathway genes) normalized to vacuolated microspore levels. Data represent the mean ±SEM. Different letters indicate statistically significant differences (P<0.05) obtained after ANOVA and subsequent Tukey HSD tests. (B) Plates showing the microspore-derived embryos produced after 30 d in control, 10 µM BRZ-treated, and 20 µM BRZ-treated cultures. Scales bars, 10 mm.
Fig. 8.
Fig. 8.
Effect of TDZD-8 on expression patterns of genes of the brassinosteroid pathway in microspore embryogenesis of B. napus. RT-qPCR analysis of transcript accumulation of BnCPD, BnBAS1, BnBIN2, BnBES1, and BnBZR1 in microspore cultures of 4 d, at the proembryo stage (A), and after 30 d, at the cotyledonary embryo stage (B). Values are normalized to control culture levels. Data represent the mean ±SEM. Asterisks indicate statistically significant differences (P<0.05) obtained by Student’s t-test.
Fig. 9.
Fig. 9.
Effect of small molecule GSK-3β inhibitors and brassinazole on embryogenesis induction efficiency in microspore cultures of H. vulgare. (A–C) Main developmental stages of microspore embryogenesis in H. vulgare: (A) isolated vacuolated microspores, at culture initiation, (B) proembryos at 4 d of culture, and (C, D) globular, transitional and coleoptilar embryos. (C) Detail at higher magnification. (D) Panoramic view of a region of a 30 d culture plate. (E) Histogram with the quantification of proembryos, the first sign of embryogenesis initiation, in control cultures and cultures treated with the small molecules at different concentrations. (F) Quantification of total embryo production in control cultures and cultures treated with the inhibitors, after 30 d of culture. Columns represent the mean ±SEM. Values have been normalized to control culture (100%). Asterisks in (E) and (F) indicate statistically significant differences (P<0.05) between control and treated cultures obtained after Student’s t-test. (G) Plates showing the microspore-derived embryos produced after 30 d in control and 10 µM BRZ-treated cultures. Scales bars, 10 mm.
Fig. 10.
Fig. 10.
Effect of small molecule GSK-3β inhibitors on somatic embryogenesis of Q. suber. (A–E) Main stages of somatic embryogenesis in Q. suber: (A) immature zygotic embryo, initial explant before embryogenesis induction, (B) cluster of embryogenic masses, originated from the original explant after induction, (C) torpedo embryo, (D) mature cotyledonary embryo, and (E) panoramic view of a culture plate showing proliferating embryogenic masses and somatic embryos at different developmental stages. (F) Quantification of embryo production estimated as the number of cotyledonary embryos originated per gram of embryogenic masses in control cultures and cultures treated with the inhibitors. Data represent the mean ±SEM. Asterisks indicate statistically significant differences (P<0.05) between control and treated cultures by Student’s t-test. Scale bars, 1 mm in (A–C); 2 mm in (D); and 10 mm in (E).

Comment in

Similar articles

Cited by

References

    1. Albrecht C, Russinova E, Kemmerling B, Kwaaitaal M, de Vries SC. 2008. Arabidopsis SOMATIC EMBRYOGENESIS RECEPTOR KINASE proteins serve brassinosteroid-dependent and -independent signaling pathways. Plant Physiology 148, 611–619. - PMC - PubMed
    1. Asami T, Min YK, Nagata N, Yamagishi K, Takatsuto S, Fujioka S, Murofushi N, Yamaguchi I, Yoshida S. 2000. Characterization of brassinazole, a triazole-type brassinosteroid biosynthesis inhibitor. Plant Physiology 123, 93–100. - PMC - PubMed
    1. Baki A, Bielik A, Molnár L, Szendrei G, Keserü GM. 2007. A high throughput luminescent assay for glycogen synthase kinase-3beta inhibitors. Assay and Drug Development Technologies 5, 75–83. - PubMed
    1. Belmonte M, Elhiti M, Waldner B, Stasolla C. 2010. Depletion of cellular brassinolide decreases embryo production and disrupts the architecture of the apical meristems in Brassica napus microspore-derived embryos. Journal of Experimental Botany 61, 2779–2794. - PMC - PubMed
    1. Berenguer E, Bárány I, Solís MT, Pérez-Pérez Y, Risueño MC, Testillano PS. 2017. Inhibition of histone H3K9 methylation by BIX-01294 promotes stress-induced microspore totipotency and enhances embryogenesis initiation. Frontiers in Plant Science 8, 1161. - PMC - PubMed

Publication types

Substances