. 2021 Aug 2;15(8):e0009625.
doi: 10.1371/journal.pntd.0009625. eCollection 2021 Aug.

Modelling the ability of mass drug administration to interrupt soil-transmitted helminth transmission: Community-based deworming in Kenya as a case study

Affiliations

Modelling the ability of mass drug administration to interrupt soil-transmitted helminth transmission: Community-based deworming in Kenya as a case study

Nyuk Sian Chong et al. PLoS Negl Trop Dis. .

Abstract

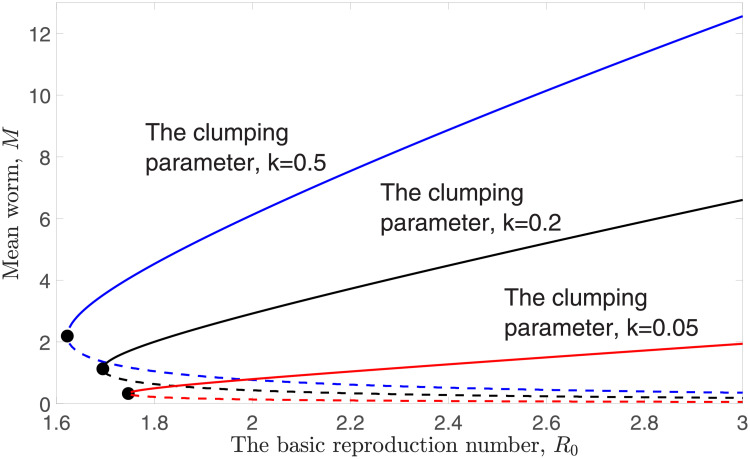
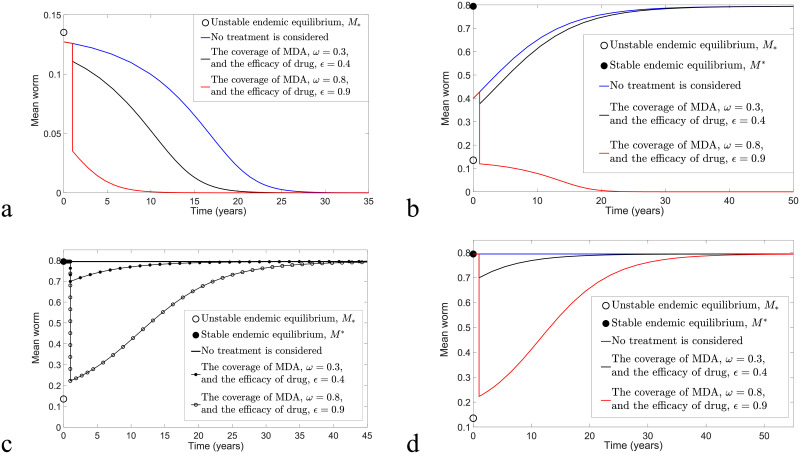
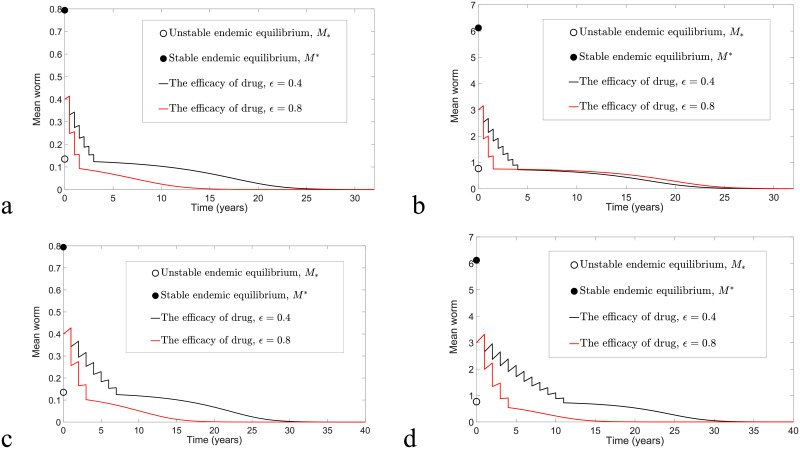
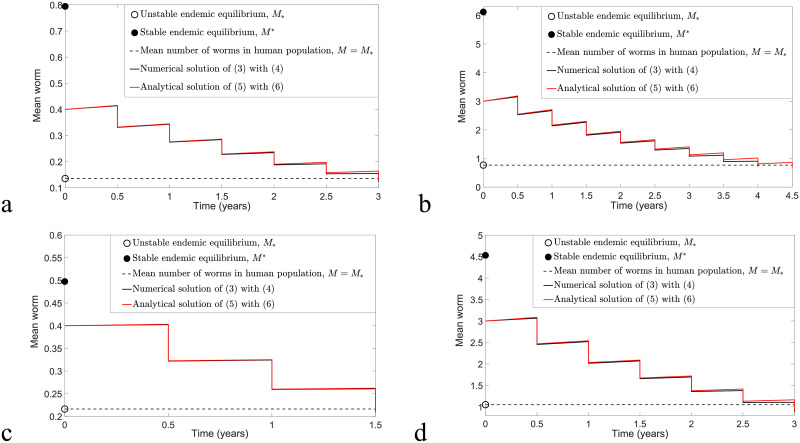
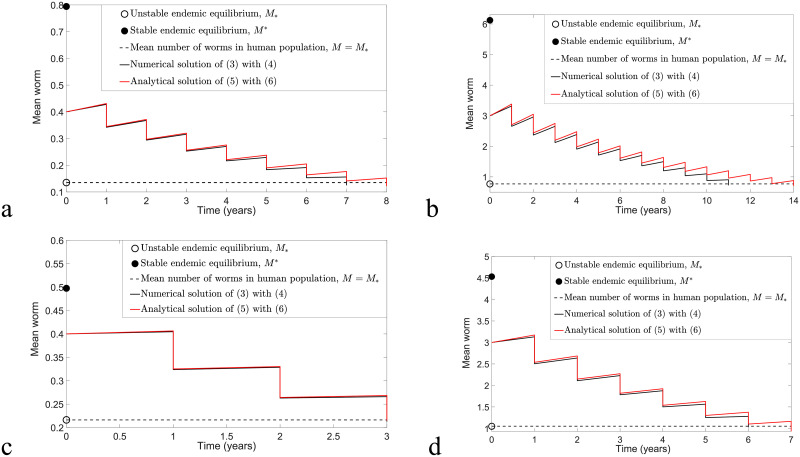
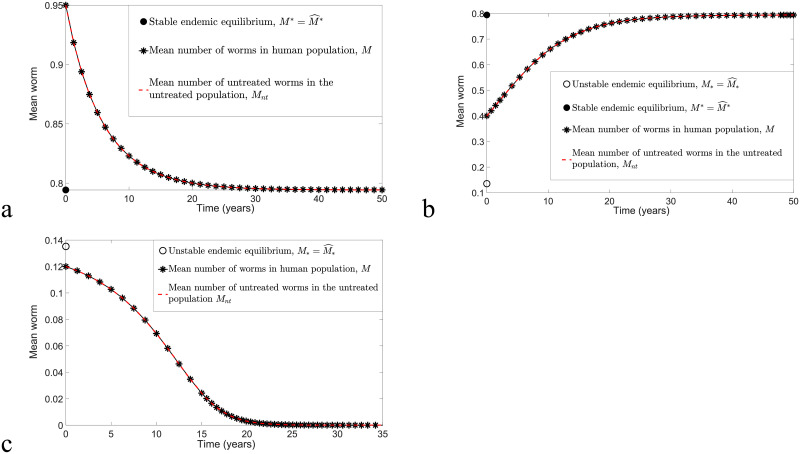
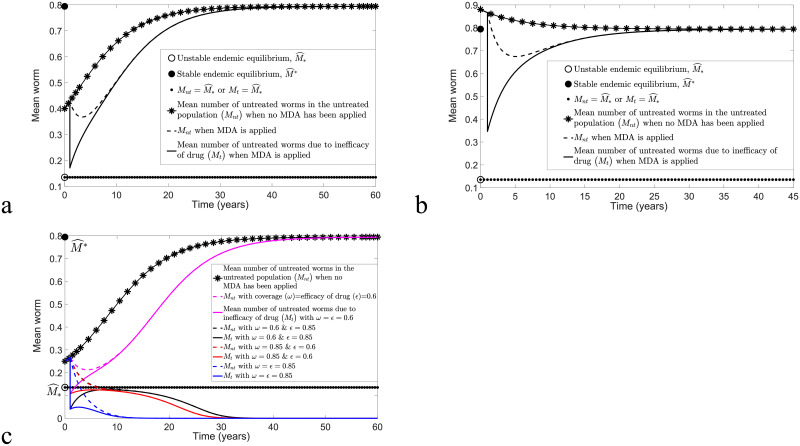
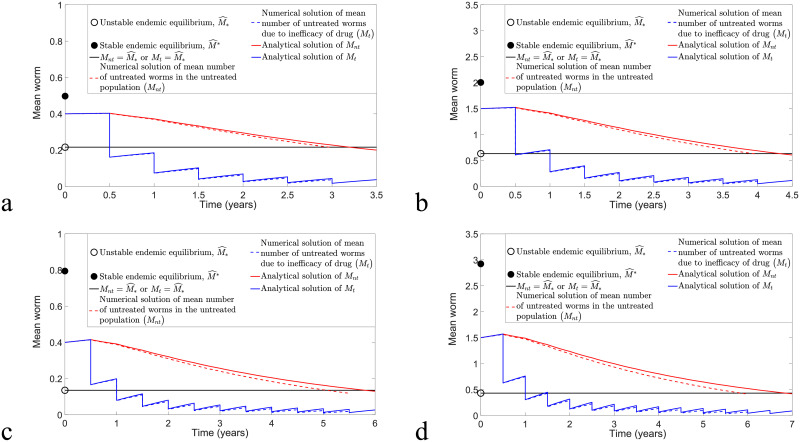
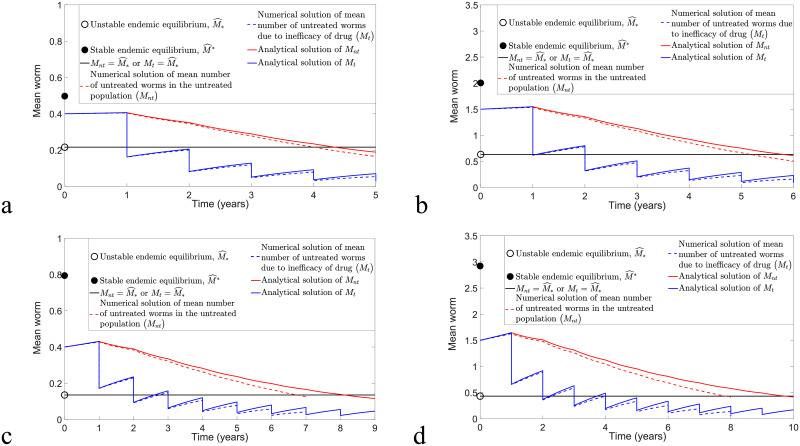
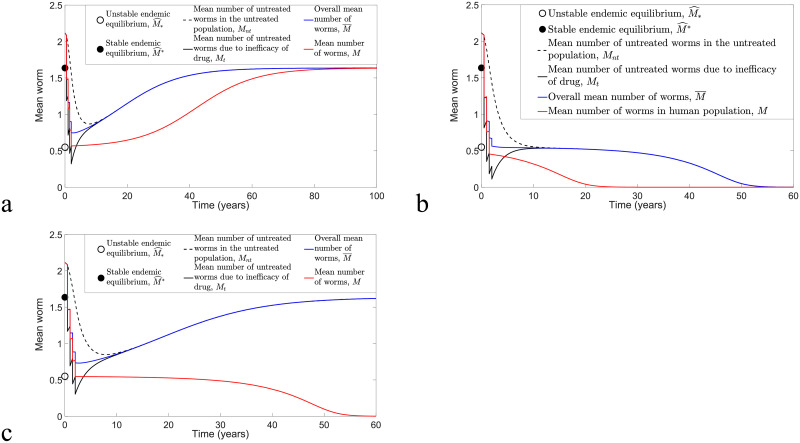
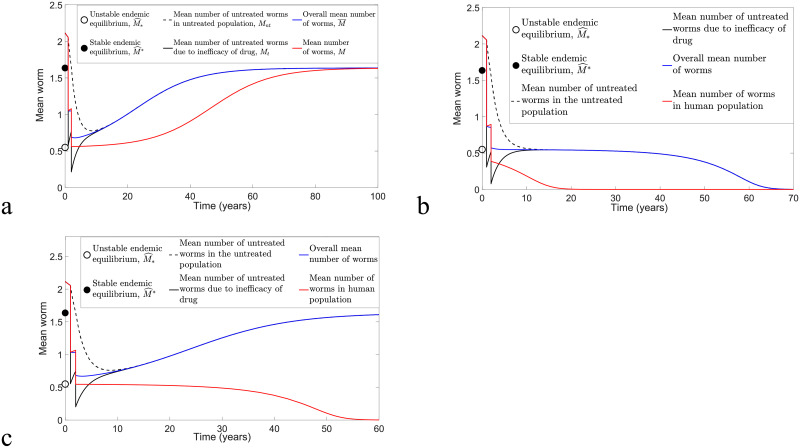
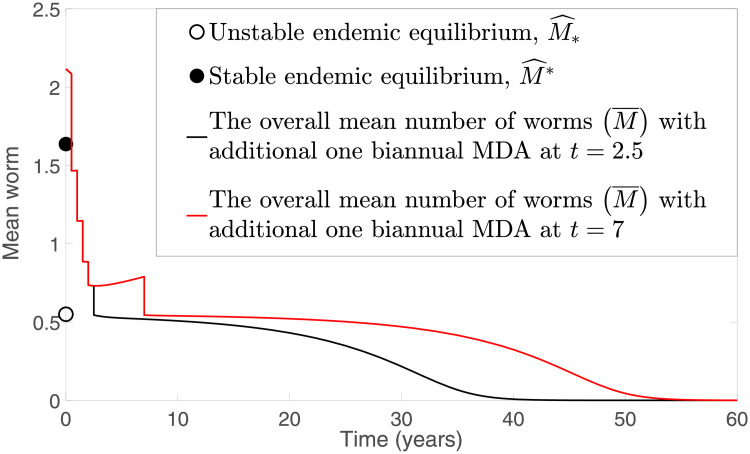
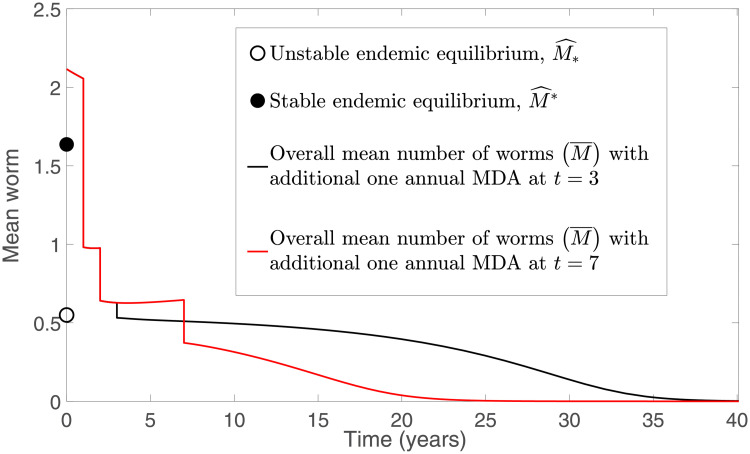
The World Health Organization has recommended the application of mass drug administration (MDA) in treating high prevalence neglected tropical diseases such as soil-transmitted helminths (STHs), schistosomiasis, lymphatic filariasis, onchocerciasis and trachoma. MDA-which is safe, effective and inexpensive-has been widely applied to eliminate or interrupt the transmission of STHs in particular and has been offered to people in endemic regions without requiring individual diagnosis. We propose two mathematical models to investigate the impact of MDA on the mean number of worms in both treated and untreated human subpopulations. By varying the efficay of drugs, initial conditions of the models, coverage and frequency of MDA (both annual and biannual), we examine the dynamic behaviour of both models and the possibility of interruption of transmission. Both models predict that the interruption of transmission is possible if the drug efficacy is sufficiently high, but STH infection remains endemic if the drug efficacy is sufficiently low. In between these two critical values, the two models produce different predictions. By applying an additional round of biannual and annual MDA, we find that interruption of transmission is likely to happen in both cases with lower drug efficacy. In order to interrupt the transmission of STH or eliminate the infection efficiently and effectively, it is crucial to identify the appropriate efficacy of drug, coverage, frequency, timing and number of rounds of MDA.


Conflict of interest statement

The authors have declared that no competing interests exist.

Figures

Fig 1
Fig 1. Numerical solutions of the endemic equilibria Meq as a function of R0 with different k values, fixing z = 0.96.
Fig 2
Fig 2. Transmission dynamics of model (3) and (4) considering no application of MDA and one round of MDA at time t = 1 with k = 0.05 and R0 = 2.
(a) M0 < M*. (b) M* < M0 < M*. (c) M0 = M*. (d) M0 > M*.
Fig 3
Fig 3. Transmission dynamics of model (3) and (4) by considering the implementation of biannual and annual MDA, M0 > M*, varying ϵ and choosing z = 0.96, R0 = 2 and ω = 0.5.
Top row: biannual MDA. Bottom row: annual MDA. Left column: k = 0.05. Right column: k = 0.5.
Fig 4
Fig 4. The comparison of the overestimate (5) and (6) and original model (3) and (4) by considering the implementation of biannual MDA with ϵ = 0.4 and ω = 0.5 and varying k and R0 values.
(a) R0 = 2, k = 0.05, n > 5.83 and MSE = 0.1258 × 10⁻⁴. (b) R0 = 2, k = 0.5, n > 8.34 and MSE = 0.2167 × 10⁻². (c) R0 = 1.8, k = 0.05, n > 2.86 and MSE = 0.5217 × 10⁻⁶. (d) R0 = 1.8, k = 0.5, n > 5.38 and MSE = 0.6392 × 10⁻³.
Fig 5
Fig 5. The comparison of solutions (5) and (6) and numerical solutions of model (3) and (4) by considering the implementation of annual MDA with ϵ = 0.4 and ω = 0.5 and varying k and R0 values.
(a) R0 = 2, k = 0.05, n > 7.29 and MSE = 0.6333 × 10⁻⁴. (b) R0 = 2, k = 0.5, n > 13.14 and MSE = 0.0156. (c) R0 = 1.8, k = 0.05, n > 2.96 and MSE = 0.2106 × 10⁻⁵. (d) R0 = 1.8, k = 0.5, n > 6.29 and MSE = 0.2264 × 10⁻².
Fig 6
Fig 6. The comparison of models (3) and (9) when no control strategy has been applied.
Both models have the same outcomes for arbitrary initial points, R0 = 2 and k = 0.05. (a) M0 > M* and Mnt0>M^*. (b) M* < M0 < M* and M^*<Mnt0<M^*. (c) M0 < M* and Mnt0<M^*.
Fig 7
Fig 7. The transmission dynamics of model (9) and (10) for a range of M^0>M^*, ϵ and ω values, with k = 0.05 and R0 = 2.
(a) ω = ϵ = 0.6 and M^*<M^0<M^*. (b) ω = ϵ = 0.6 and M^0>M^*. (c) M^0 around the neighbourhood of M^*.
Fig 8
Fig 8. Numerical comparison of model (12) and (13) and model (9) and (10) by considering the implementation of biannual MDA with ϵ = ω = 0.6 and varying k and R0 values.
(a) k = 0.05, R0 = 1.8 and MSE for Mnt and Mt are 5.9377 × 10⁻⁵ and 1.1881 × 10⁻⁵, respectively. (b) k = 0.2, R0 = 1.8 and MSE for Mnt and Mt are 1.5909 × 10⁻³ and 2.2534 × 10⁻⁴, respectively. (c) k = 0.05, R0 = 2 and MSE for Mnt and Mt are 2.6274 × 10⁻⁴ and 2.9925 × 10⁻⁵, respectively. (d) k = 0.2, R0 = 2 and MSE for Mnt and Mt are 4.5018 × 10⁻³ and 4.7219 × 10⁻⁴, respectively.
Fig 9
Fig 9. Numerical comparison of model (12) and (13) and model (9) and (10) for annual MDA with ϵ = ω = 0.6 and varying k and R0 values.
(a) k = 0.05, R0 = 1.8 and MSE for Mnt and Mt are 1.4241 × 10⁻⁴ and 4.9371 × 10⁻⁵, respectively. (b) k = 0.2, R0 = 1.8 and MSE for Mnt and Mt are 3.2954 × 10⁻³ and 9.5671 × 10⁻⁴, respectively. (c) k = 0.05, R0 = 2 and MSE for Mnt and Mt are 4.3739 × 10⁻⁴ and 1.1943 × 10⁻⁴, respectively. (d) k = 0.2, R0 = 2 and MSE for Mnt and Mt are 8.6585 × 10⁻³ and 2.1309 × 10⁻³, respectively.
Fig 10
Fig 10. Numerical results of model (3) and (4) and model (9) and (10) by varying ϵ and applying the coverage of MDA data from the TUMIKIA community-based biannual deworming control strategy.
(a) Disease persistence if ϵ < 0.44. (b) Disease extinction is possible if ϵ ≥ 0.61. (c) Disease extinction is possible for model (3) and (4) if ϵ ≥ 0.44, but the disease will remain in endemic state for model (9) and (10) if ϵ < 0.61.
Fig 11
Fig 11. The numerical results of model (3) and (4) and model (9) and (10) by varying ϵ and applying the coverage of MDA data from the TUMIKIA community-based annual deworming control strategy.
(a) Disease persistence if ϵ < 0.73. (b) Disease extinction if ϵ ≥ 0.85. (c) Disease elimination is possible for model (3) and (4) if ϵ ≥ 0.73, but the disease will remain in endemic state for model (9) and (10) if ϵ < 0.85.
Fig 12
Fig 12. Numerical solutions of model (9) and (10) with an additional round of TUMIKIA community-based biannual deworming strategy.
Fig 13
Fig 13. Numerical solutions of model (9) and (10) with an additional round of TUMIKIA community-based annual deworming strategy.

References

    1. Kealey A. & Smith? R.J. 2010. Neglected Tropical Diseases: Infection, modeling & control. J Health Care Poor Underserved 21: 53–69. doi: 10.1353/hpu.0.0270 - DOI - PubMed
    1. de Souza D. K. & Dorlo T. P. C. 2018. Safe mass drug administration for neglected tropical diseases. The Lancet 6(10): 1054–1055. - PubMed
    1. Keenan J.D., Hotez P.J., Amza A., Stoller N.E., Gaynor B.D., Porco T.C. et al.. 2013. Elimination and eradication of neglected tropical diseases with mass drug administrations: A survey of experts. PLoS Negl Trop Dis 7(12): e2562. doi: 10.1371/journal.pntd.0002562 - DOI - PMC - PubMed
    1. World Health Organization. 2017. Crossing the billion. Lymphatic filariasis, onchocerciasis, schistosomiasis, soil-transmitted helminthiases and trachoma: preventive chemotherapy for neglected tropical diseases. Geneva: World Health Organization. Licence: CC BY-NC-SA 3.0 IGO.
    1. World Health Organization. 2019. Neglected tropical diseases. https://www.who.int/neglected_diseases/diseases/en/ Accessed December 6, 2019.

Publication types

MeSH terms