. 2021 Oct;148(4):996-1006.e18.
doi: 10.1016/j.jaci.2021.07.022. Epub 2021 Jul 31.

Abnormality in the NK-cell population is prolonged in severe COVID-19 patients

Affiliations

Abnormality in the NK-cell population is prolonged in severe COVID-19 patients

Galam Leem et al. J Allergy Clin Immunol. 2021 Oct.

Abstract

Background: Our understanding of adaptive immune responses in patients with coronavirus disease 2019 (COVID-19) is rapidly evolving, but information on the innate immune responses by natural killer (NK) cells is still insufficient.

Objective: We aimed to examine the phenotypic and functional status of NK cells and their changes during the course of mild and severe COVID-19.

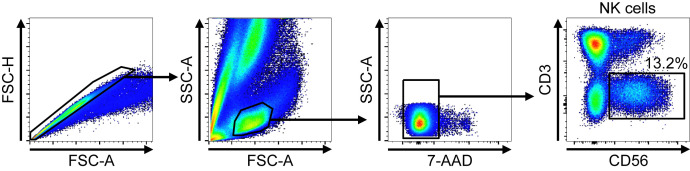
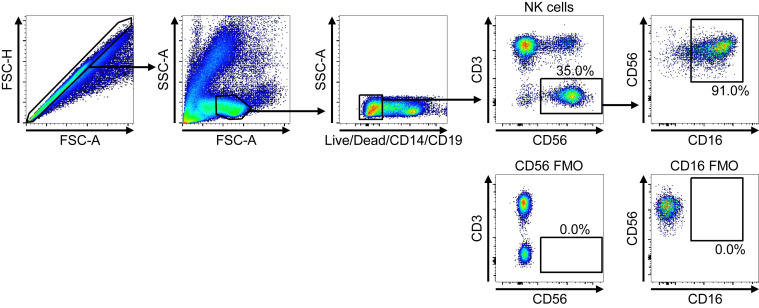
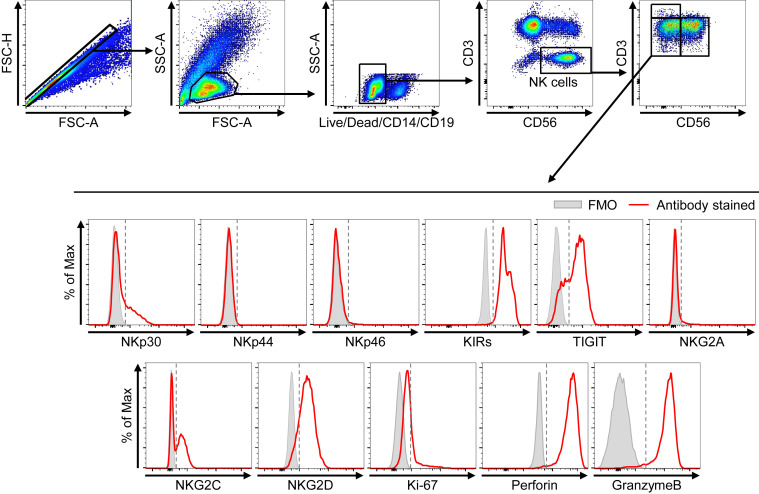
Methods: We performed RNA sequencing and flow cytometric analysis of NK cells from patients with mild and severe COVID-19 at multiple time points in the course of the disease using cryopreserved PBMCs.

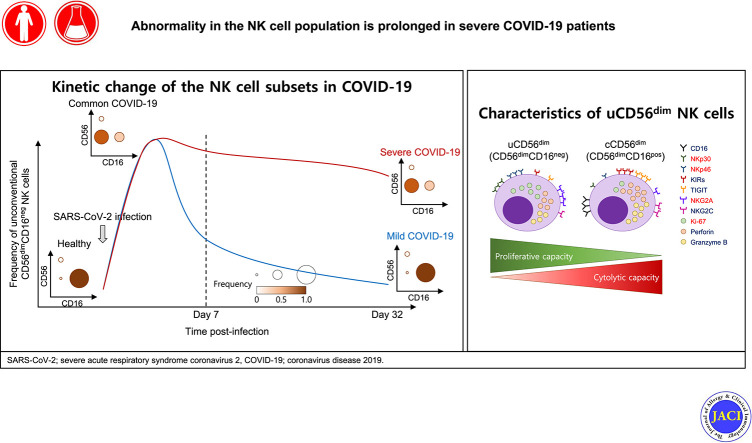
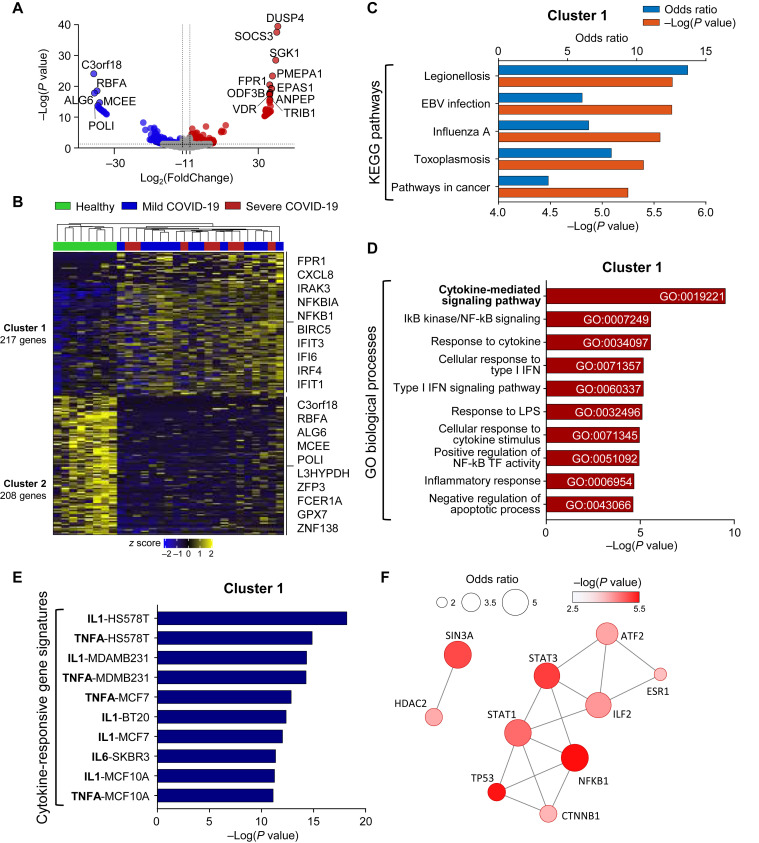
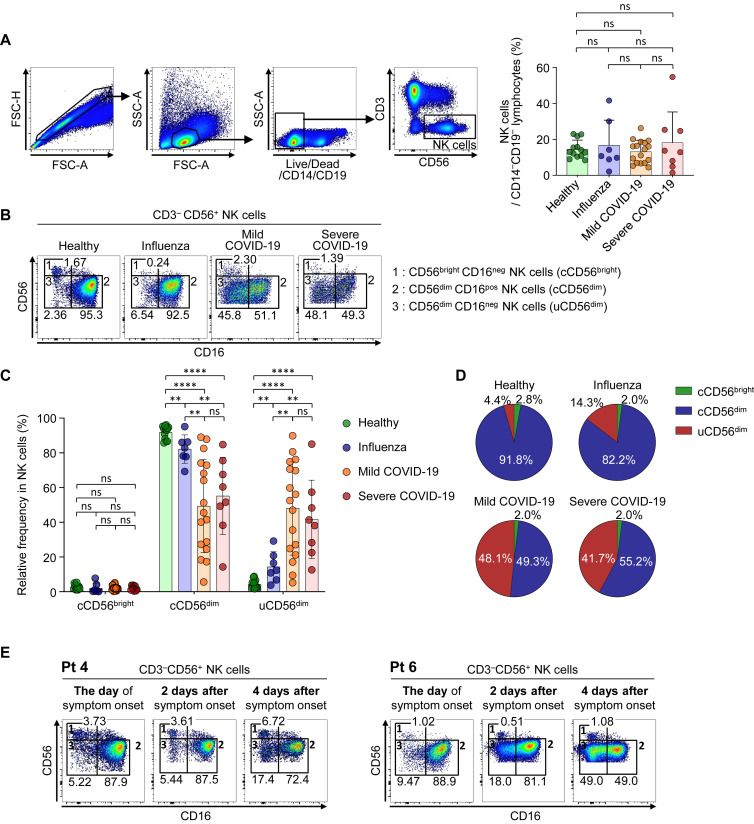
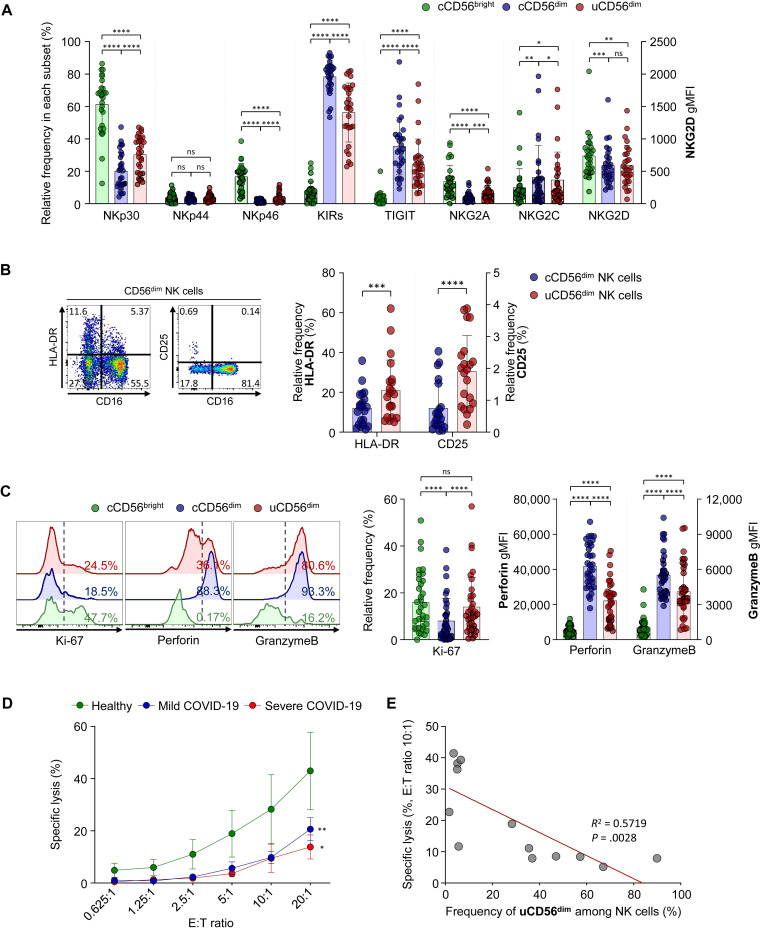
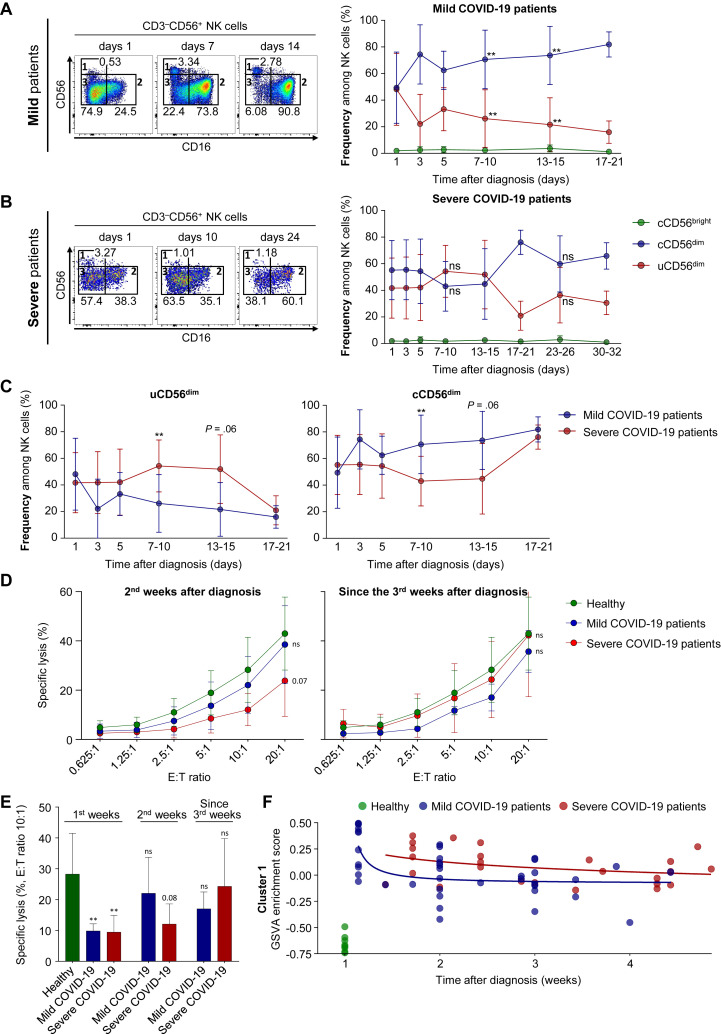
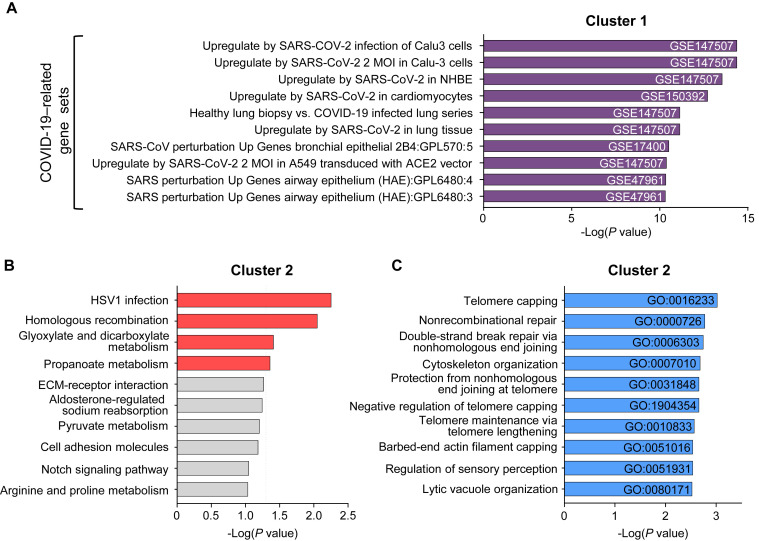
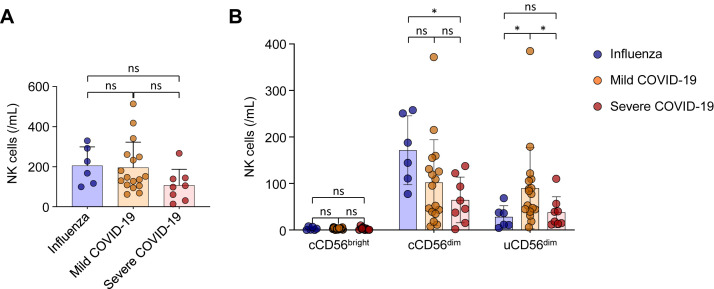
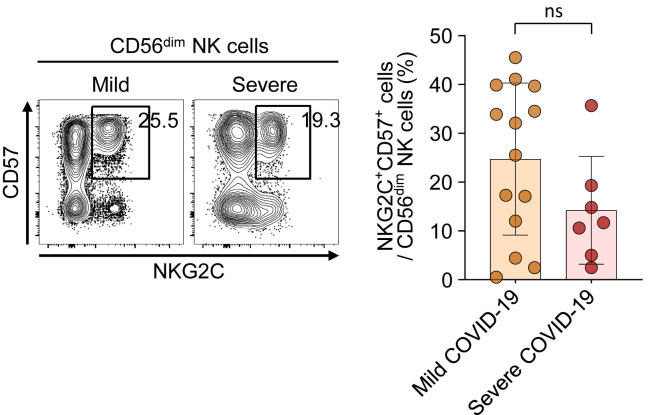
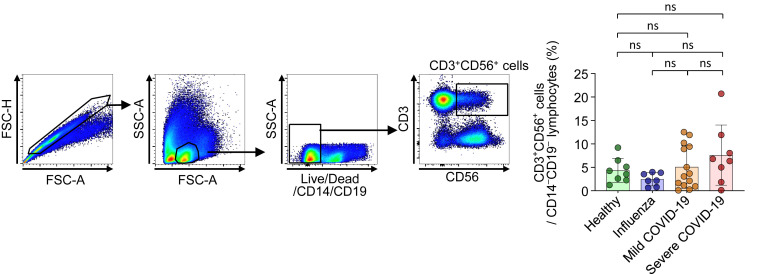
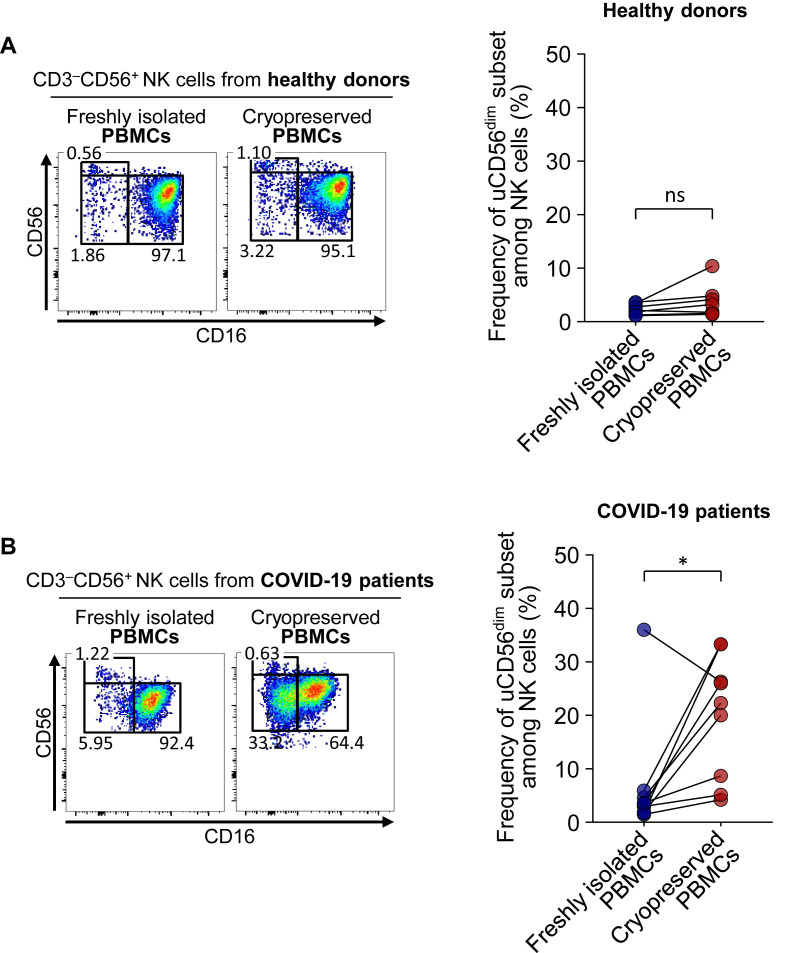
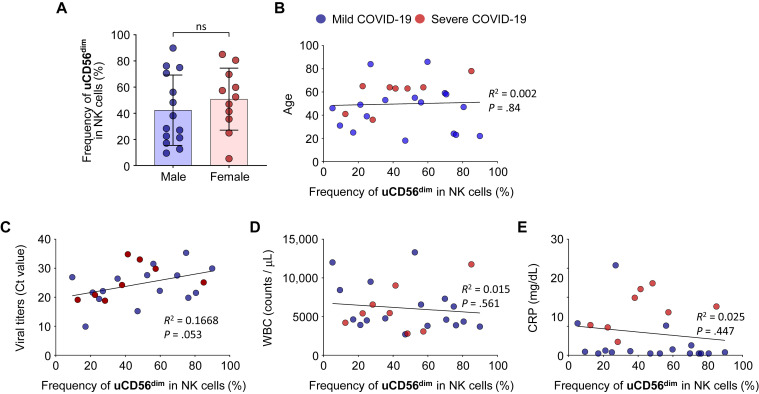
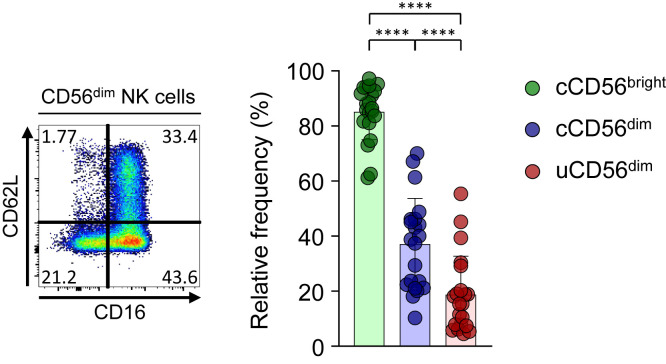
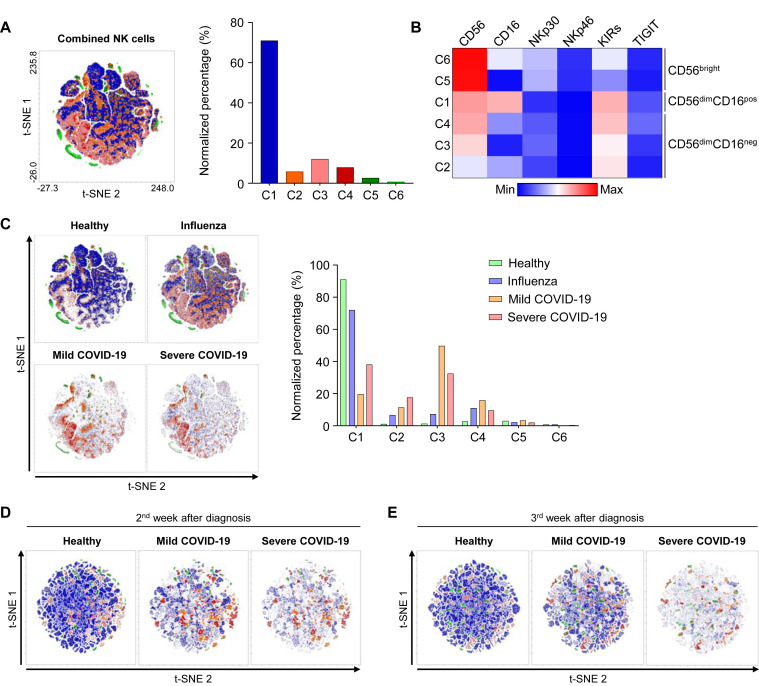
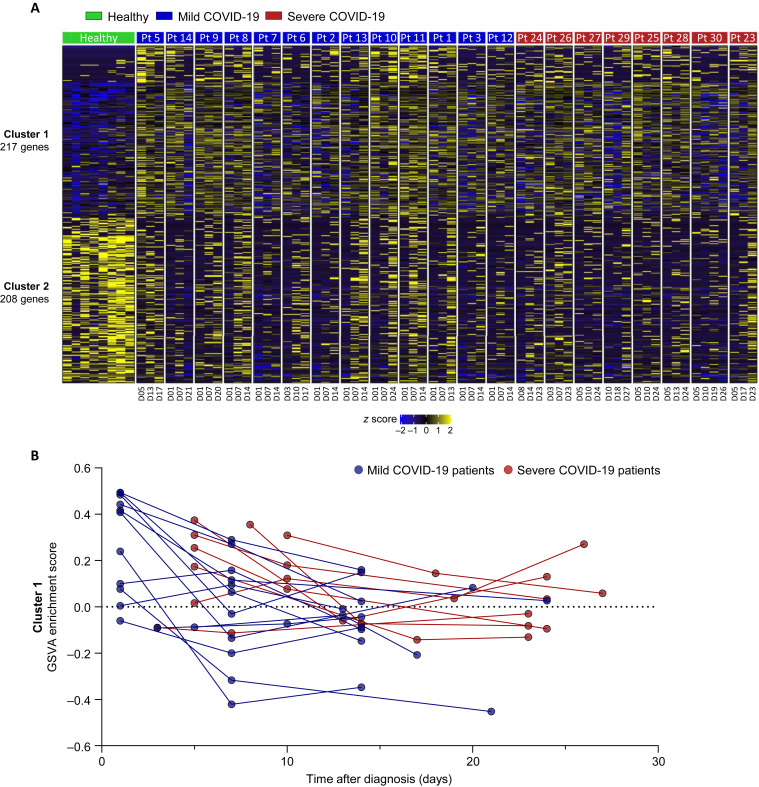
Results: In RNA-sequencing analysis, the NK cells exhibited distinctive features compared with healthy donors, with significant enrichment of proinflammatory cytokine-mediated signaling pathways. Intriguingly, we found that the unconventional CD56dimCD16neg NK-cell population expanded in cryopreserved PBMCs from patients with COVID-19 regardless of disease severity, accompanied by decreased NK-cell cytotoxicity. The NK-cell population was rapidly normalized alongside the disappearance of unconventional CD56dimCD16neg NK cells and the recovery of NK-cell cytotoxicity in patients with mild COVID-19, but this occurred slowly in patients with severe COVID-19.

Conclusions: The current longitudinal study provides a deep understanding of the NK-cell biology in COVID-19.

Keywords: COVID-19; NK cells; SARS-CoV-2; cytotoxicity; innate immunity; unconventional CD56(dim)CD16(neg) (uCD56(dim)) NK cell.


Figures

None
Graphical abstract
Fig 1
Fig 1
Transcriptome analysis of NK cells from healthy donors and patients with COVID-19. RNA-seq of sorted CD3CD56+ NK cells from cryopreserved/thawed PBMCs obtained from 8 healthy donors, 13 patients with mild COVID-19, and 8 patients with severe COVID-19 at the earliest time point for each. A and B, Volcano plot (Fig 1, A) and heatmap (Fig 1, B) showing upregulated or downregulated genes between healthy donors and patients with COVID-19: 217 genes were upregulated (cluster 1) and 208 genes were downregulated (cluster 2) in patients with COVID-19. Representative genes are annotated. C, KEGG pathway analysis of cluster 1. The top 5 pathways are presented with the odds ratio (blue bar) and −log(P value) (orange bar). D, Bar graphs showing the enrichment P values of the top 10 GO biological processes for cluster 1. GO IDs are annotated. E, Bar graphs showing the enrichment P values of the top 10 cytokine-responsive gene signatures from the L1000 LINCS database for cluster 1. Gene signatures are presented in the order of the cytokines (bold) and the name of the cytokine-treated cell lines. F, Protein-protein interaction network analysis of the top 10 cluster 1–related transcription factors. The size of the circle represents the odds ratio, and the fill color represents the value of −log(P value). GO, Gene ontology; KEGG, Kyoto Encyclopedia of Genes and Genomes; TF, transcription factor.
Fig 2
Fig 2
Identification of NK-cell subsets and phenotypes of each subset using flow cytometry. Data from samples obtained on the day of diagnosis (day 1) are presented for patients with COVID-19 (A-D). A, Representative flow cytometry plots showing the gating strategy for CD3CD56+ NK cells on the left. Right bar plots show cumulative data regarding the frequency of NK cells among CD14CD19 lymphocytes in healthy donors (green bar, n = 13), patients with influenza (blue bar, n = 7), patients with mild COVID-19 (orange bar, n = 17), and patients with severe COVID-19 (red bar, n = 8). B, Flow cytometry plots of NK cells from a representative healthy donor, patients with influenza, patients with mild COVID-19, and patients with severe COVID-19 with identification of each NK-cell subset: subset 1 represents cCD56bright NK cells, subset 2 cCD56dim NK cells, and subset 3 uCD56dim NK cells. The frequencies of each subset among NK cells are presented. C, Bar plots showing cumulative data regarding the relative frequencies of each subset among NK cells in healthy donors (green bar), patients with influenza (blue bar), patients with mild COVID-19 (orange bar), and patients with severe COVID-19 (red bar). D, Pie charts showing the average frequency of each NK-cell subset by disease group: green slice for cCD56bright, blue slice for cCD56dim, and red slice for uCD56dim NK cells. E, Expansion of the uCD56dim NK-cell population during the early acute phase of COVID-19. Flow cytometry plots for 2 patients (Pt 4 and Pt 6) on the day of symptom onset, 2 days after symptom onset, and 4 days after symptom onset are presented. FSC-A, Forward scatter-area; FSC-H, forward scatter-height; ns, not significant; Pt, patient; SSC-A, side scatter-area. ∗P < .05. ∗∗P < .01. ∗∗∗P < .001. ∗∗∗∗P < .0001.
Fig 3
Fig 3
Intracellular cytokine staining to evaluate the proliferating and cytolytic capacities of each NK-cell subset and assessment of NK-cell cytotoxicity the first week after diagnosis. A, Bar plots showing the cumulative data regarding the expression of NK-cell receptors in each NK-cell subset: cCD56bright (green bar), cCD56dim (blue bar), and uCD56dim NK cells (red bar). Data from 9 healthy donors, 7 patients with influenza, 6 patients with mild COVID-19, and 7 patients with severe COVID-19 are presented. The expression of NKp30, NKp44, NKp46, KIRs (KIR2D and KIR3DL1/2), TIGIT, NKG2A, and NKG2C is presented as the frequency among each NK-cell subset, and the expression of NKG2D is presented as the geometric MFI (gMFI). B, The expression of activation markers, including HLA-DR and CD25, was compared between cCD56dim (blue bar) and uCD56dim (red bar) NK cells from 21 patients with COVID-19. Left, Representative flow cytometry plots. Right, Bar plots showing cumulative data regarding the relative frequencies of HLA-DR and CD25 in each NK-cell subset. C, Representative half-offset flow cytometry histograms (left) showing Ki-67, perforin, and granzyme B expression in each NK-cell subset. Bar plots (right) are cumulative data regarding Ki-67 expression (%), perforin, and granzyme B (gMFI) in each NK-cell subset (green for cCD56bright, blue for cCD56dim, and red for uCD56dim NK cells). Data from 8 healthy donors, 7 patients with influenza, 12 patients with mild COVID-19, and 7 patients with severe COVID-19 are presented. D, Assessment of NK-cell cytotoxicity the first week after diagnosis (9 healthy donors, 7 patients with mild COVID-19, and 5 patients with severe COVID-19). E, Correlation of the percentage of specific lysis at an E:T ratio of 10:1 and the frequency of uCD56dim NK cells. Data from 6 healthy donors, 3 patients with mild COVID-19, and 4 patients with severe COVID-19 are presented. E:T, Effector to target; KIR, inhibitory killer-cell immunoglobulin-like receptor; ns, not significant; TIGIT, T-cell immunoglobulin and ITIM domain. Error bars indicate SD. ∗P < .05. ∗∗P < .01. ∗∗∗∗P < .0001.
Fig 4
Fig 4
The longitudinal change in NK cells. A and B, The longitudinal change in the frequencies of NK-cell subsets in 17 mild (Fig 4, A) and 8 severe (Fig 4, B) patients. Each representative flow cytometry plot of NK cells on the left is from 1 patient at 3 different time points after diagnosis. Right graphs represent cumulative data regarding the frequencies of each NK-cell subset (green for cCD56bright, blue for cCD56dim, and red for uCD56dim NK cells). Statistical analysis at each time point was a comparison to day-1 samples. C, Frequency of uCD56dim (left) and cCD56dim (right) at each time point between mild patients (blue line) and severe patients (red line). The statistical analysis at each time point was a comparison of mild patients with severe patients. D, The NK-cell cytotoxicity against K562 cells was assessed the second week after diagnosis (left, 8 mild patients and 5 severe patients) and since the third week after diagnosis (right, 4 mild patients and 5 severe patients). The green line represents the NK-cell cytotoxicity of healthy donors, the blue line represents mild patients, and the red line represents severe patients. E, Bar graph showing the specific lysis of K562 cells by NK cells at an E:T ratio of 10:1 at different time points. The statistical analysis was a comparison to healthy donors. F, The longitudinal GSVA enrichment score for cluster 1. E:T, Effector to target; GSVA, gene set variation analysis; ns, not significant. Error bar indicates SD. ∗∗P < .01. ∗∗∗P < .001. ∗∗∗∗P < .0001.
Fig E1
Fig E1
Gating strategies for NK-cell sorting before RNA-seq. After singlets and lymphocytes were gated by FSC and SSC, live cells were gated by 7-AAD staining. The CD3CD56+ cells were then gated for NK cells. FSC-A, Forward scatter-area; FSC-H, forward scatter-height; SSC-A, side scatter-area.
Fig E2
Fig E2
Gene set enrichment analysis of clusters 1 and 2. A, Bar graphs showing the top 10 enriched gene sets for cluster 1 from published COVID-19–related gene sets. GSE numbers are indicated. B and C, KEGG pathway analysis (Fig E2, B) and GO biological processes analysis with GO IDs (Fig E2, C) for cluster 2. The dashed line in Fig E2, B, indicates a P value of .05. The enriched pathways with P less than .05 are presented as red bars, and others are presented as gray bars. GO, Gene ontology; GSE, gene set enrichment; KEGG, Kyoto Encyclopedia of Genes and Genomes; MOI, multiplicity of infection; HSV1, herpes simplex virus type 1; ECM, exctracellular matrix.
Fig E3
Fig E3
Gating strategies for flow cytometric analysis of CD56 and CD16. FMO, Fluorescence minus one; FSC-A, forward scatter-area; FSC-H, forward scatter-height; SSC-A, side scatter-area.
Fig E4
Fig E4
Comparison of the absolute number of NK cells among patients with influenza and patients with mild and severe COVID-19. All data are presented as absolute counts of NK cells in 1 mL of blood. A, Comparison of the absolute number of NK cells among disease groups. B, Comparison of the absolute number of NK cells in each subset among disease groups. Blue dots represent patients with influenza, orange dots represent patients with mild COVID-19, and red dots represent patients with severe COVID-19. ns, Not significant. ∗P < .05.
Fig E5
Fig E5
The frequency of adaptive NK cells in patients with mild and severe COVID-19. Left, Representative flow cytometry plots showing the gating strategy for adaptive NK cells (CD57+NKG2C+CD56dim NK cells) in PBMCs. Right, Bar plots showing cumulative data regarding the frequency of adaptive NK cells in patients with mild COVID-19 (orange bar, n = 14) and patients with severe COVID-19 (red bar, n = 7). ns, Not significant.
Fig E6
Fig E6
The frequency of CD3+CD56+ cells in each disease group. Left, Representative flow cytometry plots showing the gating strategy for CD3+CD56+ cells in PBMCs. Right, Bar plots showing cumulative data regarding the frequency of CD3+CD56+ cells among CD14CD19 lymphocytes in healthy donors (green bar, n = 8), patients with influenza (blue bar, n = 7), patients with mild COVID-19 (orange bar, n = 14), and patients with severe COVID-19 (red bar, n = 8). FSC-A, forward scatter-area; FSC-H, forward scatter-height; ns, not significant; SSC-A, side scatter-area.
Fig E7
Fig E7
Comparison of NK-cell subsets between freshly isolated PBMCs and cryopreserved PBMCs from healthy donors (A) and patients with COVID-19 (B). Left, Representative flow cytometry plots. Right, Bar graph showing cumulative data regarding the paired comparison of the frequency of the uCD56dim subset among NK cells in healthy donors (Fig E7, A) and patients with COVID-19 (Fig E7, B). ns, Not significant. ∗P < .05.
Fig E8
Fig E8
Correlation between the expansion of uCD56dim NK-cell population and clinical parameters. Each bar plot and dot plot represents the correlation between the frequency of uCD56dim NK cells in patients with COVID-19 and clinical parameters, including sex (A), age (B), viral titers (C), WBC counts (D), and CRP (E). N = 25 (17 patients with mild COVID-19 and 8 patients with severe COVID-19). CRP, C-reactive protein; WBC, white blood cell.
Fig E9
Fig E9
Gating strategies for flow cytometric analysis of surface markers and intracellular cytokine staining. Flow cytometry plots for the staining of each marker (red line) in uCD56dim NK cells. Fluorescence minus one (FMO; gray bar) was used as a negative control. Gray dashed lines are cutoff points determined by FMO staining. FSC-A, forward scatter-area; FSC-H, forward scatter-height; SSC-A, side scatter-area
Fig E10
Fig E10
The expression of CD62L in CD56dim NK-cell subpopulations. Left, Representative flow cytometry plot from 1 patient. Right, Bar plots showing cumulative data regarding the relative frequency of CD62L in each NK-cell subset (green bar for cCD56bright, blue bar for cCD56dim, and red bar for uCD56dim; n = 21). Error bars indicate SD. ∗∗∗∗P < .0001.
Fig E11
Fig E11
t-SNE analysis of NK cells. A-C, The t-SNE analysis of NK cells from 8 healthy donors, 7 patients with influenza, 8 patients with mild COVID-19, and 7 patients with severe COVID-19 on the day of diagnosis. A, The left t-SNE plot shows 6 different clusters, and the bar graph shows the normalized percentage of each cluster. B, Heatmap showing the differential expression of CD56, CD16, NKp30, NKp46, KIRs, and TIGIT in each group. C, The t-SNE analysis performed separately by disease group. The bar graph shows the normalized percentage of each cluster by group (green box for healthy donors, blue box for patients with influenza, orange box for patients with mild COVID-19, and red box for patients with severe COVID-19). D and E, The t-SNE analyses were performed separately by group (6 healthy donors, 5 patients with mild COVID-19, and 6 patients with severe COVID-19) 1 week after diagnosis (Fig E11, D) and 2 weeks after diagnosis (Fig E11, E). KIR, Inhibitory killer-cell immunoglobulin-like receptor; TIGIT, T-cell immunoglobulin and ITIM domain; t-SNE, t-distributed stochastic neighbor embedding.
Fig E12
Fig E12
Transcriptomic profiles of NK cells during the disease course by patient. A, Heatmap showing the dynamic changes in the expression of cluster 1 and cluster 2 genes during the course of the disease by patient. Patient ID is annotated in green, blue, and red boxes, and the time points are annotated below. B, The longitudinal GSVA enrichment score for cluster 1. The same patients are connected by a blue (patients with mild COVID-19) or red line (patients with severe COVID-19). GSVA, Gene set variation analysis.

References

    1. Wu F., Zhao S., Yu B., Chen Y.M., Wang W., Song Z.G., et al. A new coronavirus associated with human respiratory disease in China. Nature. 2020;579:265–269. - PMC - PubMed
    1. Zhu N., Zhang D., Wang W., Li X., Yang B., Song J., et al. A novel coronavirus from patients with pneumonia in China, 2019. N Engl J Med. 2020;382:727–733. - PMC - PubMed
    1. World Health Organization Weekly epidemiological update—19 January 2021. https://www.who.int/publications/m/item/weekly-epidemiological-update---... Available at:
    1. Guan W.J., Ni Z.Y., Hu Y., Liang W.H., Ou C.Q., He J.X., et al. Clinical characteristics of coronavirus disease 2019 in China. N Engl J Med. 2020;382:1708–1720. - PMC - PubMed
    1. Ferretti A.P., Kula T., Wang Y., Nguyen D.M.V., Weinheimer A., Dunlap G.S., et al. Unbiased screens show CD8(+) T cells of COVID-19 patients recognize shared epitopes in SARS-CoV-2 that largely reside outside the spike protein. Immunity. 2020;53:1095–1107.e3. - PMC - PubMed