. 2021 Oct 1:197:108739.
doi: 10.1016/j.neuropharm.2021.108739. Epub 2021 Jul 31.

Different roles of T-type calcium channel isoforms in hypnosis induced by an endogenous neurosteroid epipregnanolone

Affiliations

Different roles of T-type calcium channel isoforms in hypnosis induced by an endogenous neurosteroid epipregnanolone

Ian Coulter et al. Neuropharmacology. .

Abstract

Background: Many neuroactive steroids induce sedation/hypnosis by potentiating γ-aminobutyric acid (GABAA) currents. However, we previously demonstrated that an endogenous neuroactive steroid epipregnanolone [(3β,5β)-3-hydroxypregnan-20-one] (EpiP) exerts potent peripheral analgesia and blocks T-type calcium currents while sparing GABAA currents in rat sensory neurons. This study seeks to investigate the behavioral effects elicited by systemic administration of EpiP and to characterize its use as an adjuvant agent to commonly used general anesthetics (GAs).

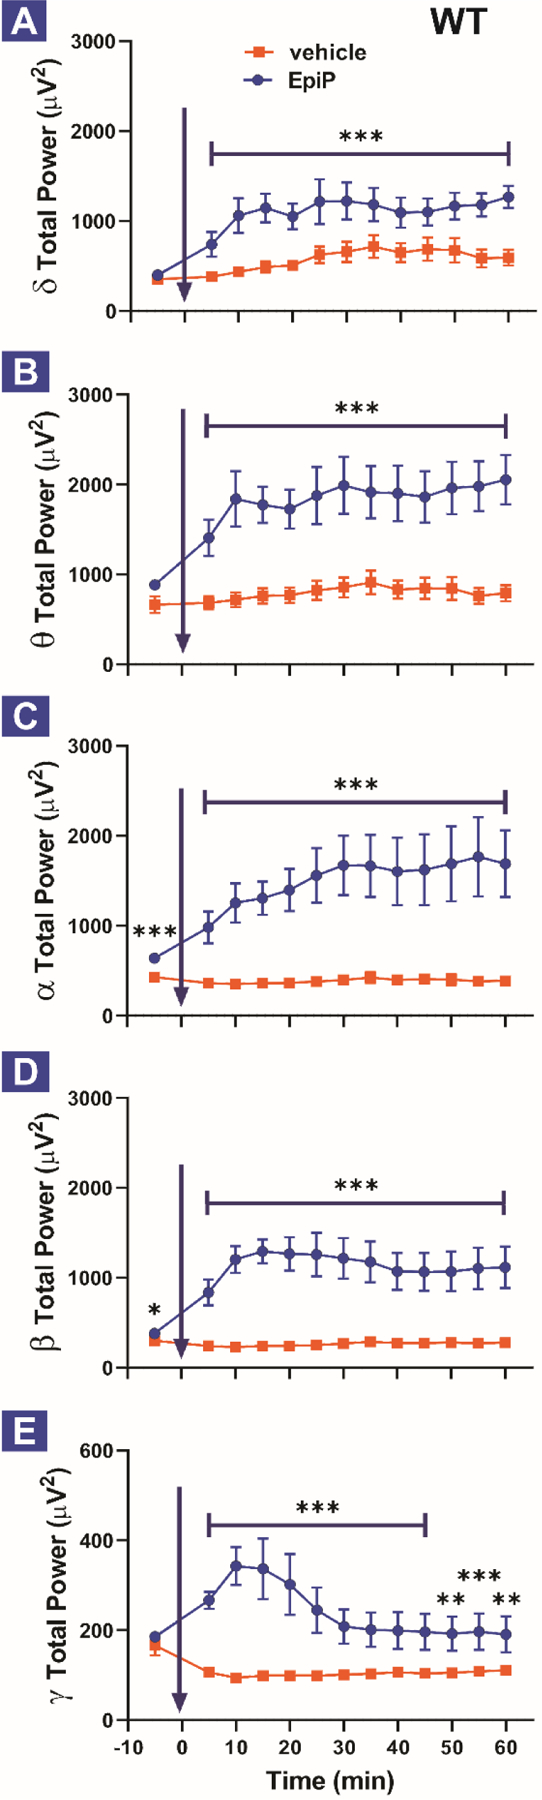
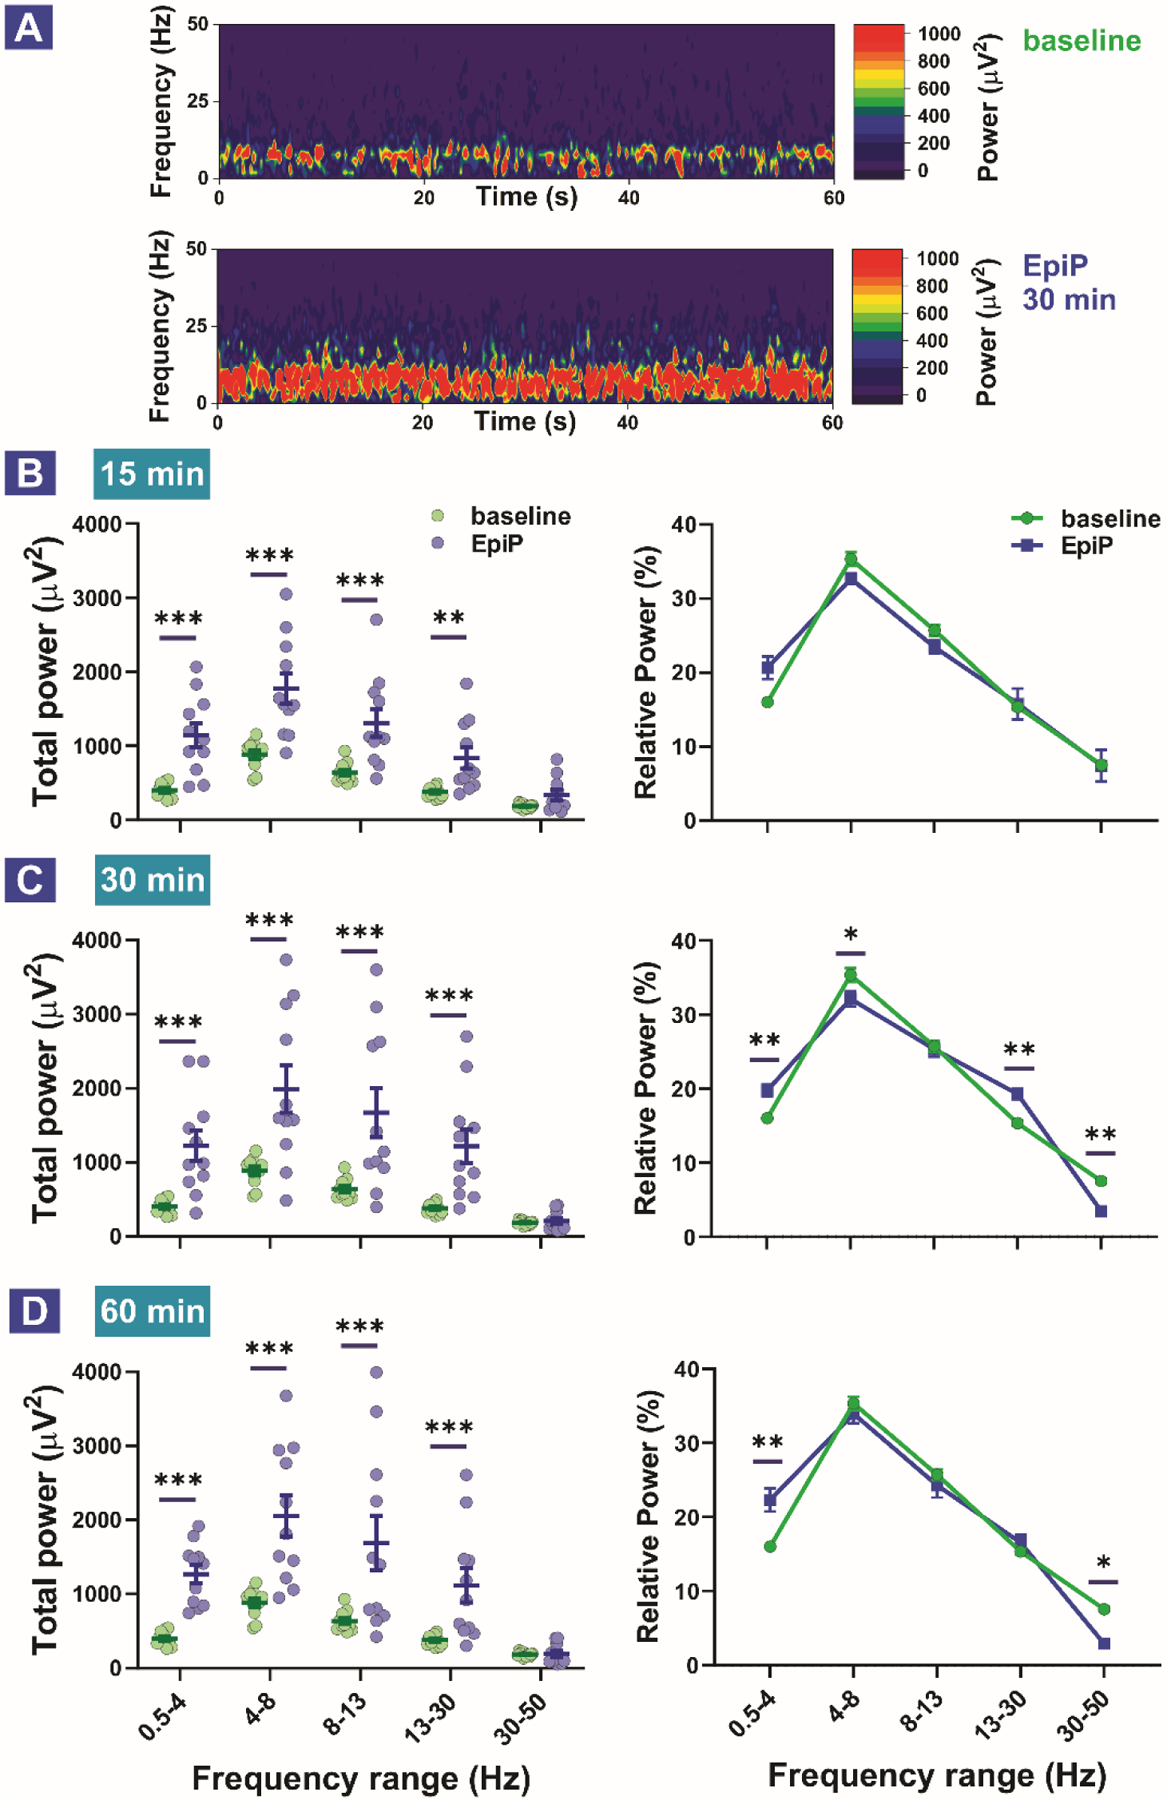
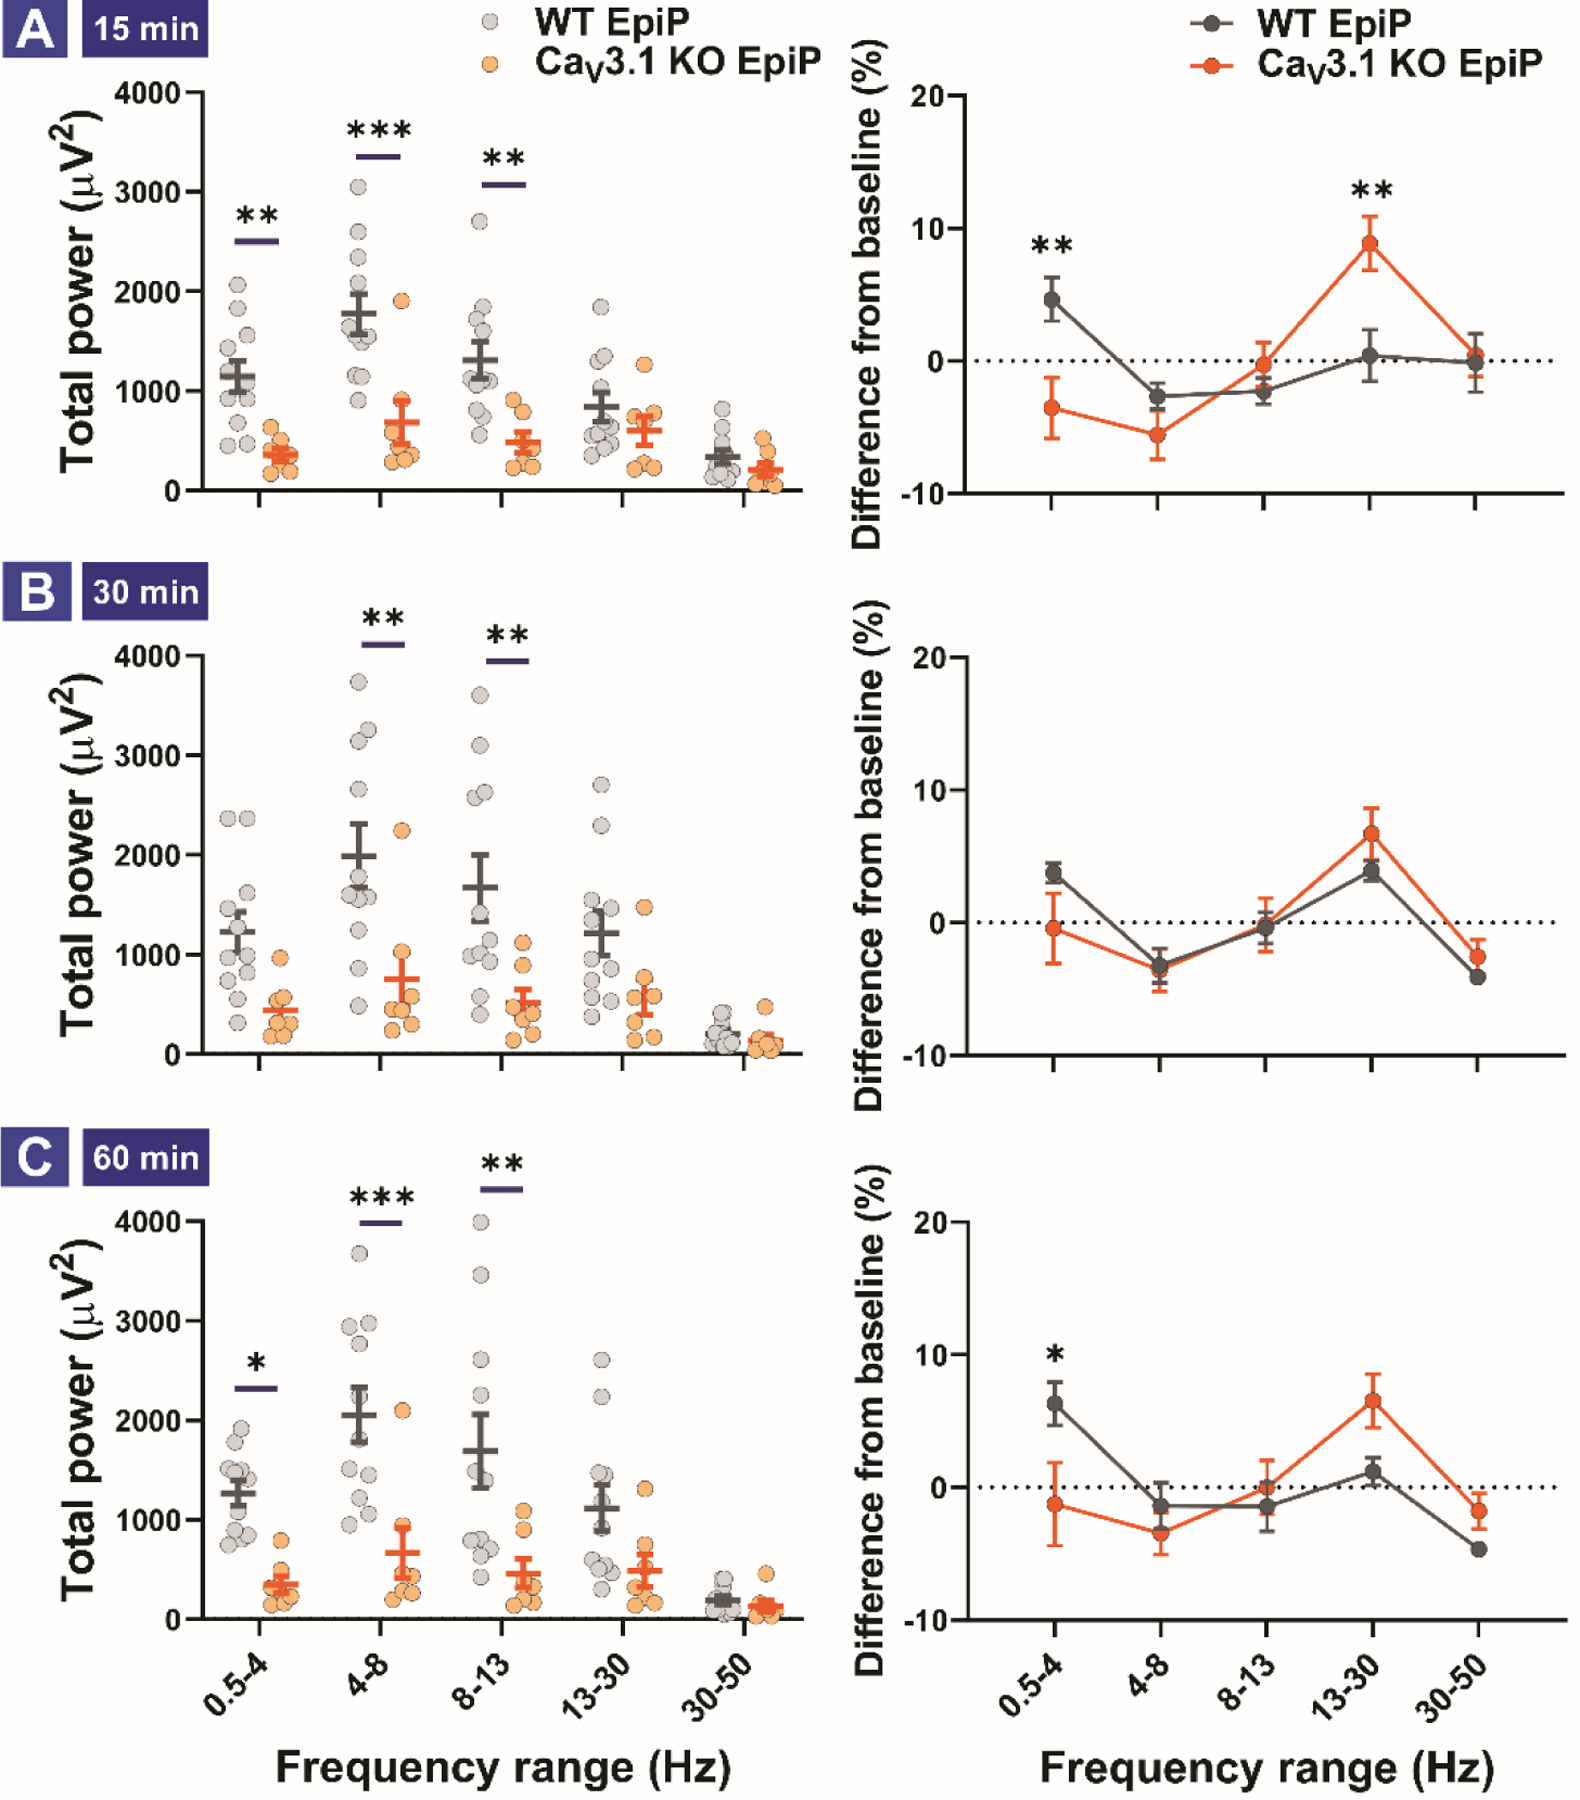
Methods: Here, we utilized electroencephalographic (EEG) recordings to characterize thalamocortical oscillations, as well as behavioral assessment and mouse genetics with wild-type (WT) and different knockout (KO) models of T-channel isoforms to investigate potential sedative/hypnotic and immobilizing properties of EpiP.

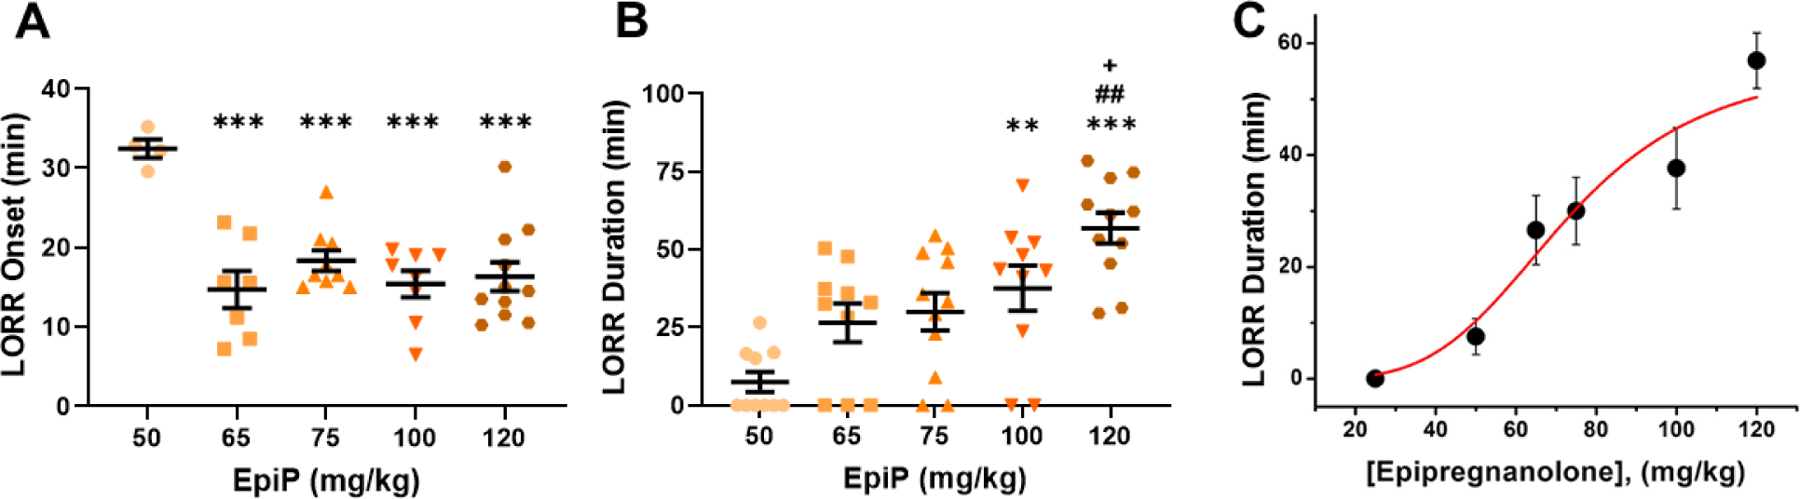
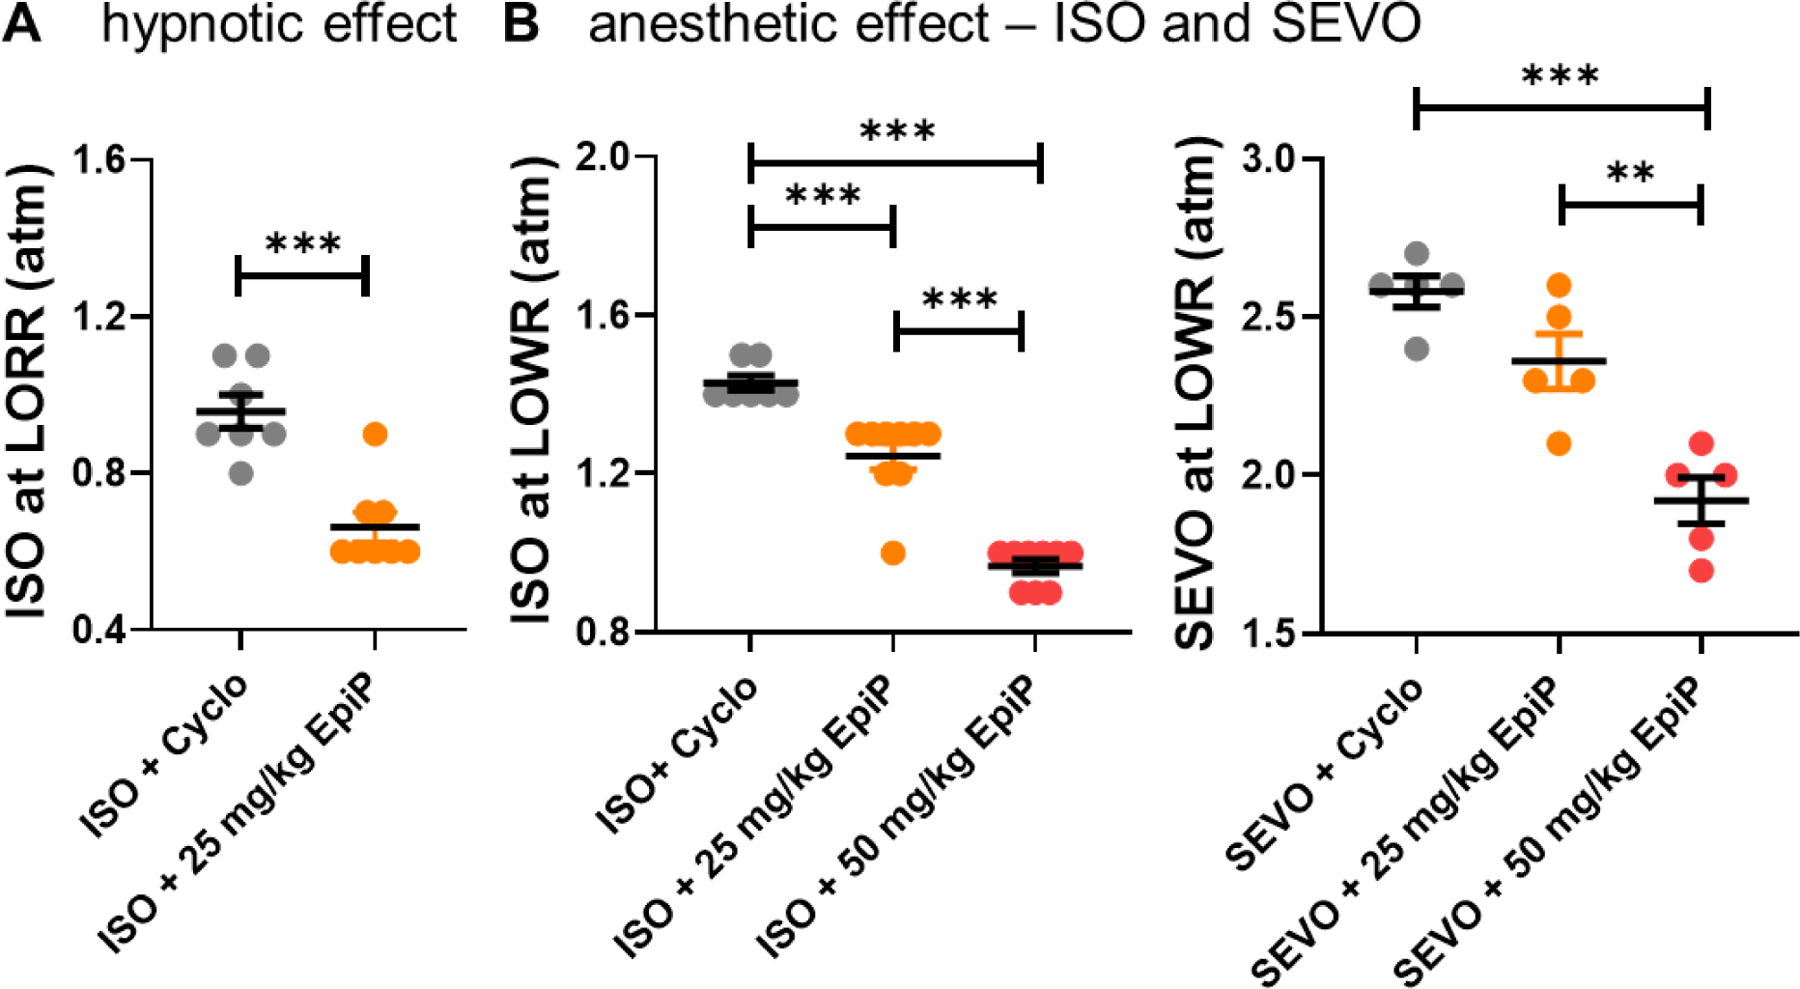
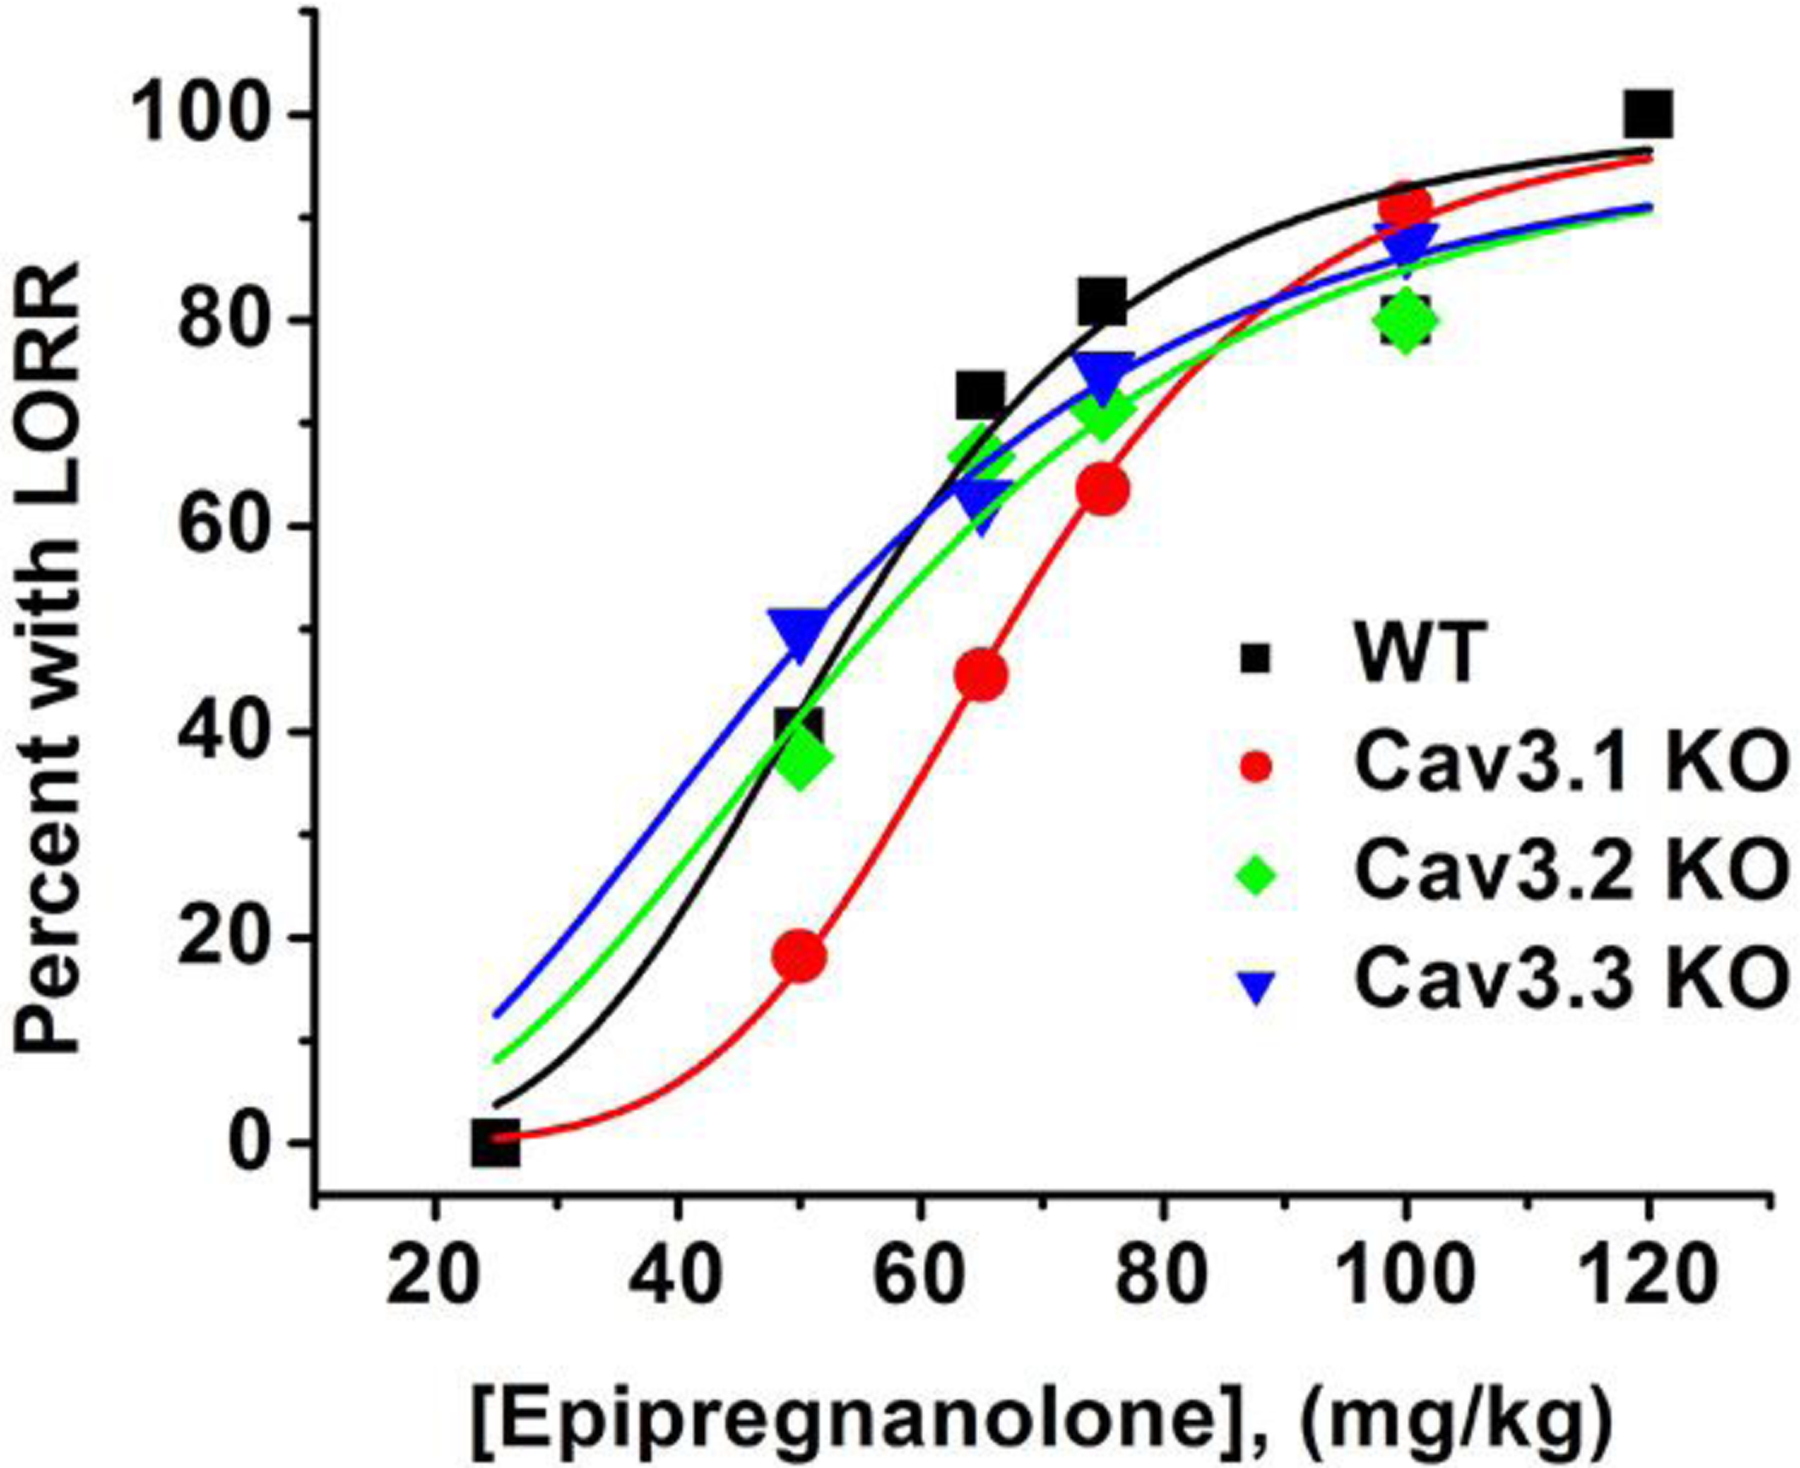
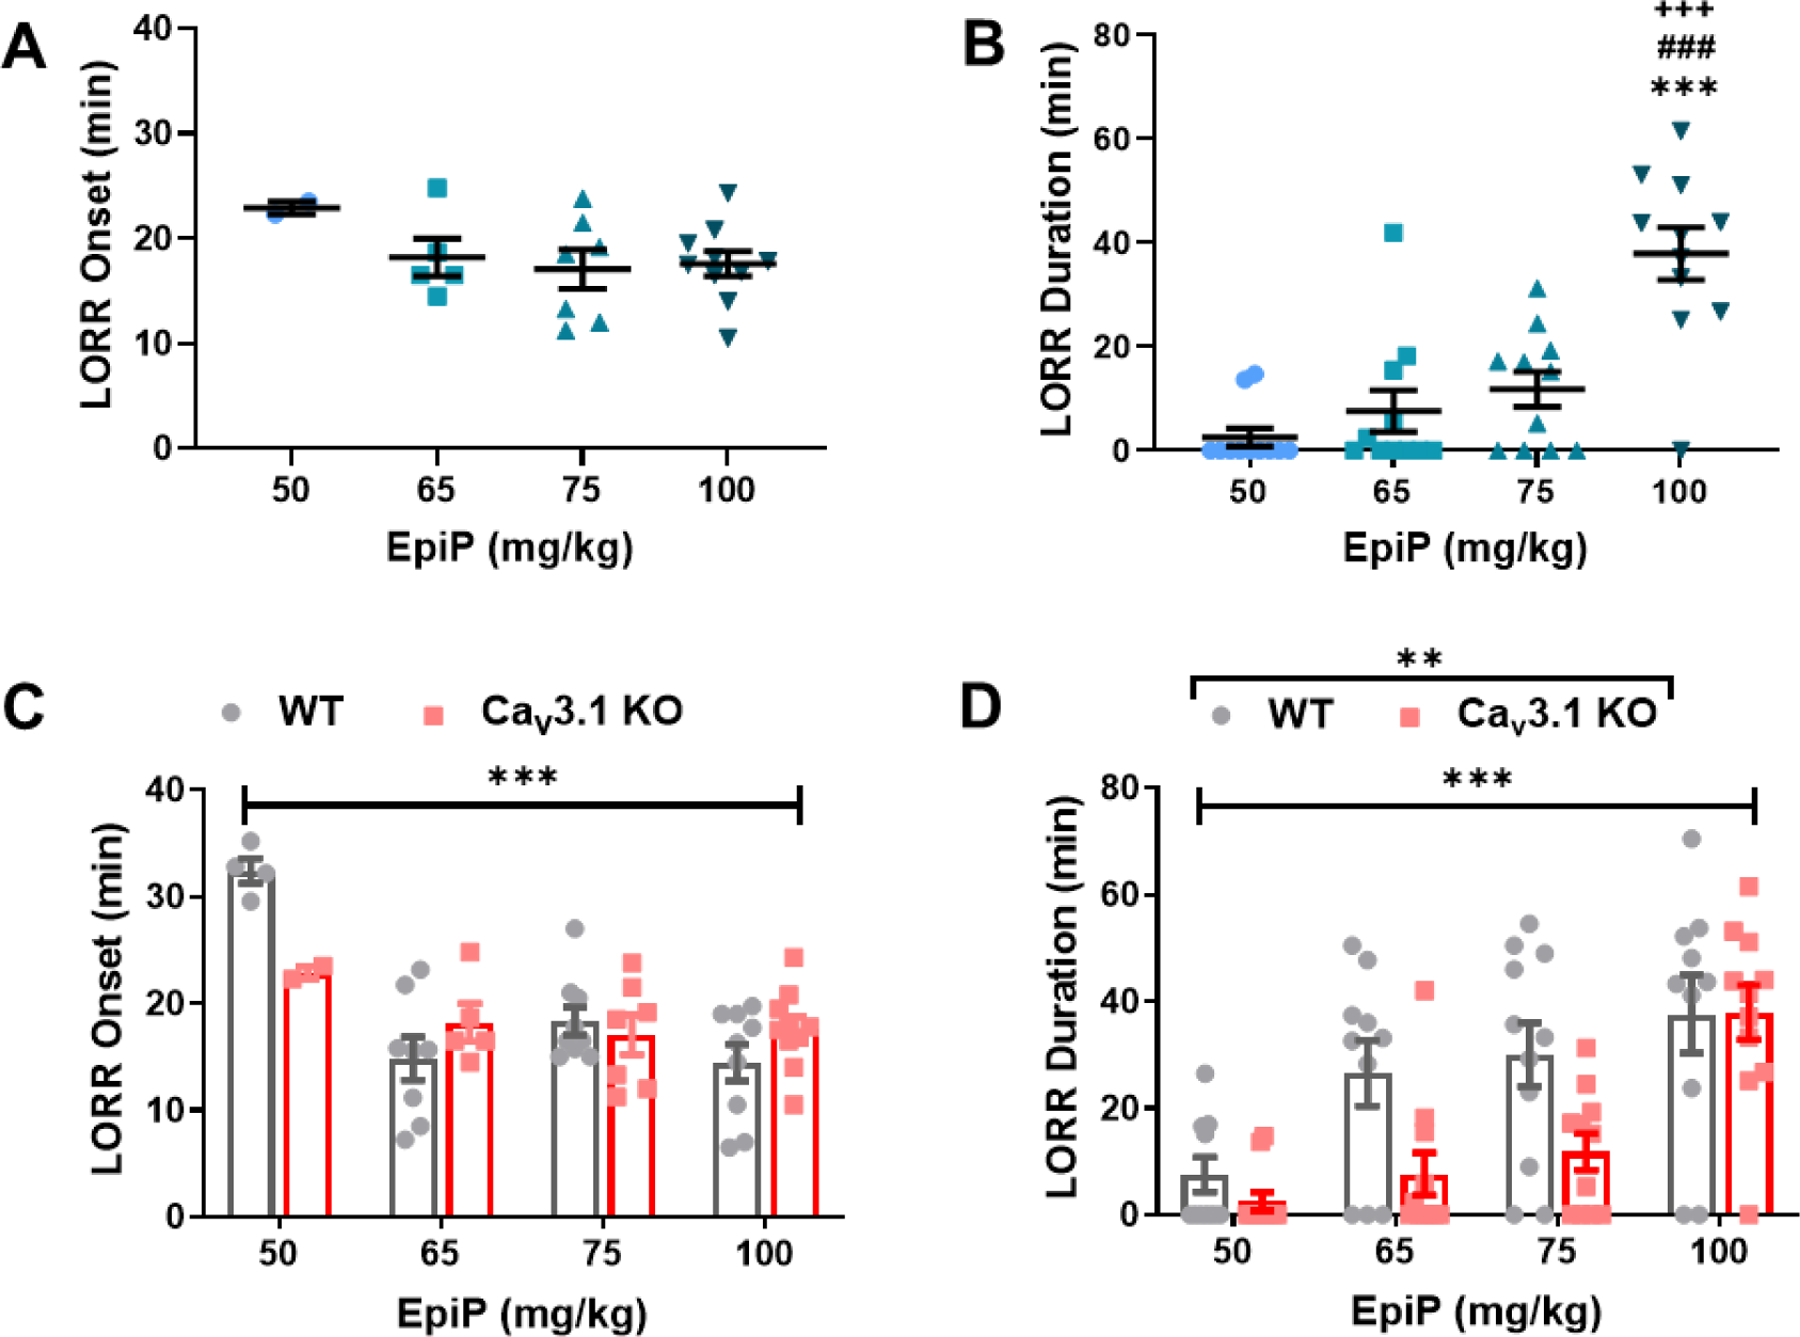
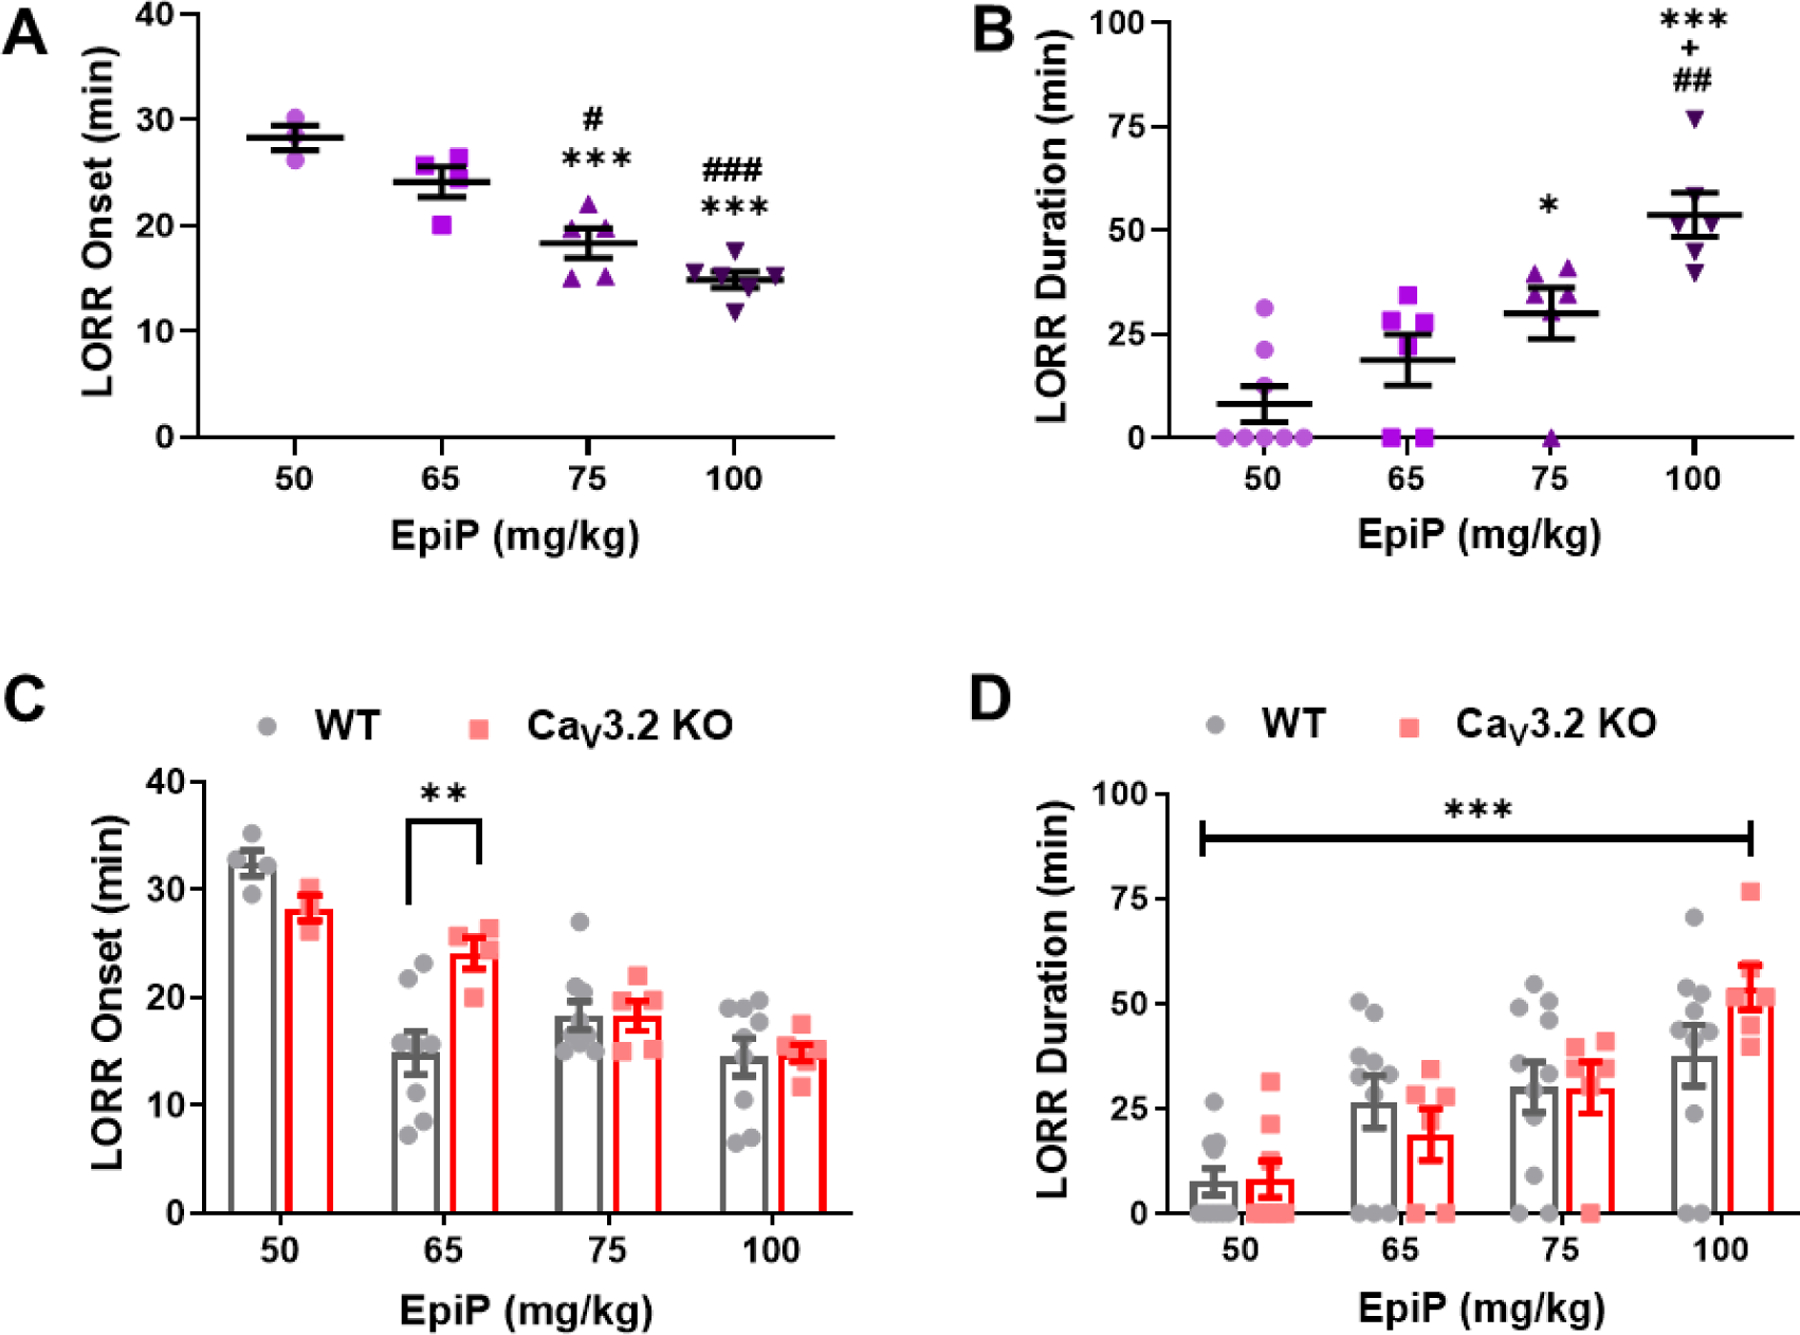
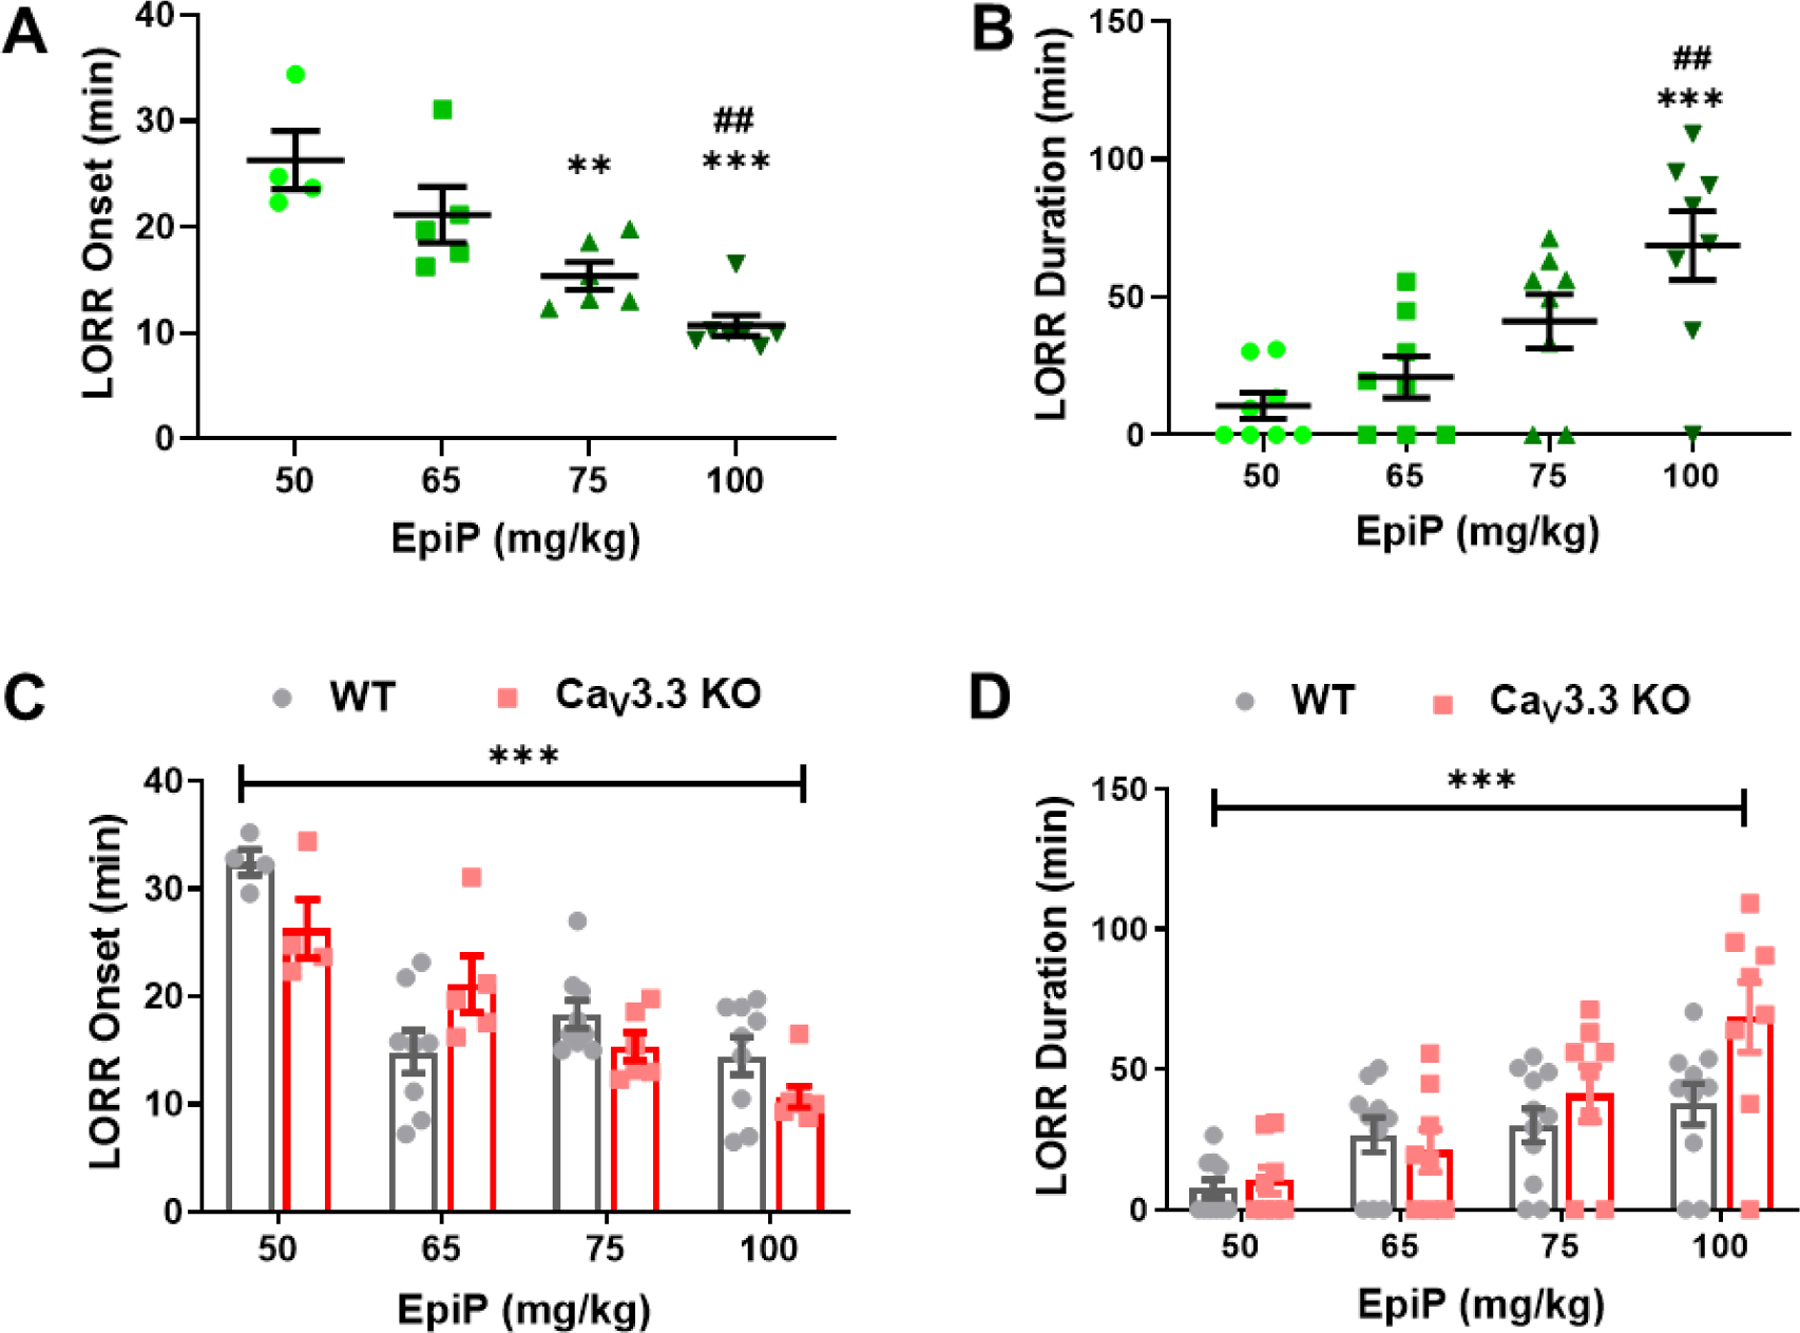
Results: Consistent with increased oscillations in slower EEG frequencies, EpiP induced an hypnotic state in WT mice when injected alone intra-peritoneally (i.p.) and effectively facilitated anesthetic effects of isoflurane (ISO) and sevoflurane (SEVO). The CaV3.1 (Cacna1g) KO mice demonstrated decreased sensitivity to EpiP-induced hypnosis when compared to WT mice, whereas no significant difference was noted between CaV3.2 (Cacna1h), CaV3.3 (Cacna1i) and WT mice. Finally, when compared to WT mice, onset of EpiP-induced hypnosis was delayed in CaV3.2 KO mice but not in CaV3.1 and CaV3.3 KO mice.

Conclusion: We posit that EpiP may have an important role as novel hypnotic and/or adjuvant to volatile anesthetic agents. We speculate that distinct hypnotic effects of EpiP across all three T-channel isoforms is due to their differential expression in thalamocortical circuitry.

Keywords: Calcium; Isoflurane; Low-voltage-activated; Righting reflex; Thalamus; Withdrawal reflex.


Conflict of interest statement

Conflict of interest

The authors received no compensation nor do they have any conflicting financial interests in regards to the work described in this manuscript.

Figures

Figure 1 -
Figure 1 -. EpiP is a dose-dependent hypnotic agent.
A. WT mice demonstrated a dose-dependent decrease in time to LORR onset with increasing EpiP dose (one way ANOVA F(4,34) = 9.494, p < 0.001). This effect was prominently seen in doses higher than 50 mg/kg. Specifically, we found a significant decrease in time to LORR onset from 50 mg/kg to 65 mg/kg, 75 mg/kg, 100 mg/kg, and 120 mg/kg, (p <0.001, <0.001, <0.001, and <0.001, respectively). B. LORR duration exhibited a dose-dependent response to EpiP (one way ANOVA F(4,34) = 10.000, p < 0.001). Statistical analysis yielded between 50 mg/kg and 100 mg/kg as well as 120 mg/kg (p = 0.003, <0.0001); between 65 mg/kg and 120 mg/kg (p = 0.002); and finally 75 mg/kg and 120 mg/kg (p = 0.006). C. Average duration of LORR is plotted against the injected dose of EpiP (same data as panel B of this figure). Solid red line is best fit of the data points using Hill-Langmuir equation yielding estimated ED50 of 72.53 ± 4.00 mg/kg and slope n of 4.05 ± 0.98. Fit was constrained to the maximal duration of 56.91 minutes achieved with dose of 120 mg/kg. *vs 50 mg/kg EpiP, #vs 65 mg/kg EpiP, +vs 75 mg/kg EpiP
Figure 2 -
Figure 2 -. EpiP significantly lowers ISO concentration necessary to induce hypnosis and lowers ISO and SEVO anesthetic concentration in WT mice.
A. A low dose of EpiP yielded a significant decrease in concentration of ISO necessary to induce LORR (unpaired two-tailed t-test t(13) = 5.20, p < 0.001). Animals given a sub-hypnotic dose of 25 mg/kg i.p injection of EpiP required 0.295 atm (95% CI +/− 0.058) less ISO than animals given vehicle alone to cause LORR. B. EpiP lowered the anesthetic concentration of ISO necessary to immobilize WT mice and inhibit the LOWR in a dose-dependent manner - left (one way ANOVA F(2,22) = 82.43, p < 0.001, post hoc presented on Figure). At 25 mg/kg of EpiP lowered ISO requirements for LOWR by 0.185 atm. At the dose of 50 mg/kg, EpiP further lowered the ISO requirement by 0.462 atm. Similarly EpiP lowered the anesthetic concentration of SEVO necessary to immobilize WT mice and inhibit the LOWR in a dose-dependent manner - right (one way ANOVA F(2,12) = 22.00, p < 0.001, post hoc presented on Figure).
Figure 3.
Figure 3.. Time course of total EEG power change after vehicle or EpiP injections
Total δ (A), θ (B), α (C), β (D) and γ (E) power during baseline recordings and 60 min after vehicle or neurosteroid i.p. injection (in 5-min bins). A. EpiP-injected animals had more absolute power in δ frequency range (0.5–4 Hz) in comparison to control (vehicle) (two way RM ANOVA, Interaction F(11,110) = 0.592, p = 0.832; EpiP F(1,10) = 26.47, p < 0.001, Time F(11,110) = 2.459, p = 0.009). B. EpiP-injected animals had more absolute power in θ frequency range (4–8 Hz) (two way RM ANOVA, Interaction F(11,110) = 0.621, p = 0.808; EpiP F(1,10) = 38.57, p < 0.001, Time F(11,110) = 1.413, p = 0.177). C. EpiP-injected animals had more absolute power in α frequency range (8–13 Hz) (two way RM ANOVA, Interaction F(11,110) = 1.130, p = 0.345; EpiP F(1,10) = 21.54, p < 0.001, Time F(11,110) = 1.492, p = 0.145). Note that baseline power in α frequency range was higher during baseline in EpiP experiment (paired t-test t(10) = 5.989, p < 0.001). D. EpiP-injected animals had more absolute power in β frequency range (13–30 Hz) (two way RM ANOVA, Interaction F(11,110) = 1.113, p = 0.358; EpiP F(1,10) = 31.48, p < 0.001, Time F(11,110) = 0.984, p = 0.465). Note that baseline power in β frequency range was higher during baseline in EpiP experiment (paired t-test t(10) = 2.326, p = 0.042). E. EpiP-injected animals had more absolute power in γ frequency range (30–50 Hz) in comparison to control (two way RM ANOVA, Interaction F(11,110) = 8.414, p < 0.001; EpiP F(1,10) = 14.05, p = 0.004, Time F(11,110) = 5.716, p < 0.001, post hoc presented on Figure). Analysis of recordings from 11 animals, the same animals were injected with vehicle on Day 1 and 24 hours later (Day 2) they were injected with EpiP 100 mg/kg.
Figure 4.
Figure 4.. Total and relative EEG power during baseline recordings, 15, 30 and 60 min after neurosteroid injections
A. Representative heat maps during baseline recordings and 30 minutes after EpiP injection. B. Total (left) and relative (right) power 15 min after i.p. injection of the neurosteroid. Analysis of total power revealed an increase in the δ, θ, α and β frequency ranges (two way RM ANOVA, Interaction F(4,40) = 6.517, p < 0.001; EpiP F(1,10) = 29.180, p < 0.001, Frequency F(4,40) = 42.24, p < 0.001; post-hoc presented on Figure). Analysis of relative power revealed no statistically significant change between baseline and EpiP (two way RM ANOVA, Interaction F(4,40) = 2.569, p = 0.05; EpiP F(1,10) = 0.639, p = 0.442, Frequency F(4,40) = 102.7, p < 0.001; post-hoc revealed trend in δ frequency range (p = 0.07)). C. Total (left) and relative (right) power 30 min after i.p. injection of the neurosteroid. Analysis of total power revealed an increase in the δ, θ, α and β frequency ranges (two way RM ANOVA, Interaction F(4,40) = 11.85, p < 0.001; EpiP F(1,10) = 13.95, p = 0.004, Frequency F(4,40) = 44.24, p < 0.001; post-hoc presented on Figure). Analysis of relative power revealed rise in δ and β and drop in θ and γ relative power (two way RM ANOVA, Interaction F(4,40) = 12.94, p < 0.001; EpiP F(1,40) = 2.386, p = 0.153, Frequency F(4,40) = 295.1, p < 0.001; post-hoc presented on Figure). D. Total (left) and relative (right) power 60 min after i.p. injection of the neurosteroid. Analysis of total power revealed an increase in the δ, θ, α and β frequency ranges (two way RM ANOVA, Interaction F(4,40) = 10.85, p < 0.001; EpiP F(1,10) = 16.11, p = 0.002, Frequency F(4,40) = 43.53, p < 0.001; post-hoc presented on Figure). Analysis of relative power revealed rise in δ and drop γ relative power (two way RM ANOVA, Interaction F(4,40) = 6.44, p < 0.001; EpiP F(1,40) = 0.563, p = 0.47, Frequency F(4,40) = 204.3, p < 0.001; post-hoc presented on Figure). Analysis of recordings was averaged from 11 animals. *p < 0.05, **p < 0.01, ***p < 0.001
Figure 5 -
Figure 5 -. Different sensitivity of T-channel isoform-specific knockout mice to EpiP-induced hypnosis.
This graph shows best fit (solid lines) of dose-response curves to escalating doses of EpiP to percent of mice with LORR using Hill-Langmuir equation. All fits are constrained to 100% maximal effect. Estimated ED50 values in mg/kg and slope of the curve n and (SEM) were as follows: WT mice ED50 54.1 ± 2.8, n 4.2 ± 0.9; CaV3.1 KO mice ED50 67.1 ± 0.5, n 5.3 ± 0.2; CaV3.2 KO mice ED50 56.1 ± 3.2, n 3.0 ± 0.7; CaV3.3 KO mice ED50 51.1 ± 1.8, n 2.7 ± 0.3. Total of mice included to generate the data was 11 for WT mice and CaV3.1 KO mice, and 8 for CaV3.2 KO mice and CaV3.3 KO mice.
Figure 6 -
Figure 6 -. Knockout of the CaV3.1 channel confers resistance to the hypnotic effects of EpiP.
A. We found weak dose-dependent changes in LORR onset in CaV3.1 KO mice (one-way ANOVA F(3,20) = 1.116, p = 0.3661). B. EpiP caused a dose-dependent hypnosis in CaV3.1 KO mice (one-way ANOVA F(3,40) = 17.840, p < 0.001). Bonferroni’s multiple comparison test shows that there was a statistically significant difference between 50 mg/kg and 100 mg/kg (p < 0.001); 65 mg/kg and 100 mg/kg (p < 0.001); and 75 mg/kg and 100 mg/kg (p < 0.001). C. No difference in LORR onset between CaV3.1 KO and WT mice was measured (two-way ANOVA Interaction F(3,46) = 3.388, p = 0.026; Dose F(3,46) = 9.971, p < 0.001, Genotype F(1,46) = 0.612, p = 0.438). D. The CaV3.1 KO mice demonstrate an overall shorter LORR duration than WT mice (two-way ANOVA Interaction F(3,77) = 1.967, p = 0.126; Dose F(3,77) = 15.370, p < 0.001, Genotype F(1,77) = 9.263, p = 0.003). The WT data shown here is the same as those from Figure 1. *vs 50 mg/kg EpiP, #vs 65 mg/kg EpiP, +vs 75 mg/kg EpiP
Figure 7 -
Figure 7 -. EpiP exerts dose-dependent hypnosis in CaV3.2 KO mice that shows delayed induction but same duration when compared to WT mice.
A. CaV3.2 KO mice exhibited dose-dependent onset of LORR changes in response to EpiP (one-way ANOVA F(3,14) = 23.380, p < 0.001). Multiple comparisons analysis indicates that there was a significant difference between 50 mg/kg and both 75 mg/kg and 100 mg/kg (p < 0.001, p < 0.001); as well as between 65 mg/kg and both 75 mg/kg and 100 mg/kg (p = 0.024, p < 0.001). B. EpiP generated a dose-dependent hypnosis in CaV3.2 KO mice (one-way ANOVA F(3,22) = 13.330, p < 0.001). Post-hoc analysis showed a statistically significant difference between 50 mg/kg and both 75 mg/kg (p = 0.046) and 100 mg/kg (p < 0.001); 65 mg/kg and 100 mg/kg (p = 0.0014); and finally between 75 mg/kg and 100 mg/kg (p = 0.040). C. No overall difference in LORR onset between CaV3.2 KO and WT mice (two-way ANOVA Interaction F(3,40) = 4.483, p = 0.008; Dose F(3,40) = 22.870, p < 0.001, Genotype F(1,40) = 1.131, p = 0.294). Post-hoc analysis with Bonferroni’s multiple comparisons demonstrated that WT mice had earlier onset of LORR at 65 mg/kg (p = 0.0028). D. LORR Duration in CaV3.2 KO male mice was not significantly different from WT mice (two-way ANOVA Interaction F(3,59) = 1.288, p = 0.287; Dose F(3,59) = 13.780, p < 0.001, Genotype F(1,59) = 0.258, p = 0.613). The WT data shown here is the same as those from Figure 1. *vs 50 mg/kg EpiP, #vs 65 mg/kg EpiP, +vs 75 mg/kg EpiP
Figure 8 -
Figure 8 -. EpiP induces dose-dependent hypnosis in CaV3.3 KO mice that is not significantly different from WT mice.
A. Increasing doses of EpiP caused a decreasing time to LORR in a dose-dependent fashion (one-way ANOVA F(3,18) = 13.580, p < 0.001). Post-hoc analysis illustrated significance between 50 mg/kg and both 75 mg/kg (p = 0.005) as well as 100 mg/kg (p < 0.001); and 65 mg/kg and 100 mg/kg (p = 0.003). B. CaV3.3 KO mice demonstrated a dose-dependent hypnosis duration in response to EpiP (one-way ANOVA F(3,28) = 7.906, p < 0.001). Bonferroni’s multiple comparisons specifically showed significant differences between 50 mg/kg and 100 mg/kg (p < 0.001); and between 65 mg/kg and 100 mg/kg (p = 0.006). C. The CaV3.3 KO mice exhibited no difference in LORR onset from WT mice (Interaction F(3,44) = 4.168, p = 0.011; Dose F(3,44) = 24.440, p < 0.001, Genotype F(1,44) = 1.556, p = 0.219). D. We did not find a significant difference in overall LORR duration between CaV3.3 KO and WT mice. (Interaction F(3,65) = 2.230, p = 0.093; Dose F(3,65) = 12.730, p < 0.001, Genotype F(1,65) = 3.616, p = 0.062). Despite the overall insignificant finding, there appears to be a trend indicating that CaV3.3 KO mice showed longer LORR duration than WT mice at the highest dose. The WT data shown here is the same as those from Figure 1. *vs 50 mg/kg EpiP, #vs 65 mg/kg EpiP, +vs 75 mg/kg EpiP
Figure 9.
Figure 9.. Total and relative EEG power differences between WT and CaV3.1 KO animals 15, 30 and 60 min after neurosteroid injections
A. Total (left) and relative (right) power 15 min after i.p. injection of the neurosteroid. Analysis of total power revealed an increase in the δ, θ and α frequency ranges in WT animals in comparison to mutant mice (two way RM ANOVA, Interaction F(4,64) = 6.78, p < 0.001; Frequency F(4,64) = 19.09, p < 0.001, Genotype F(1,16) = 11.96, p = 0.003; post-hoc presented on Figure). Analysis of difference from baseline (relative power) revealed δ rise in WT and β rise in mutant animals (two way RM ANOVA, Interaction F(4,64) = 4.652, p = 0.002; Frequency F(4,64) = 4.976, p = 0.001, Genotype F(1,16) = 1.025, p = 0.326; post-hoc presented on Figure). B. Total (left) and relative (right) power 30 min after i.p. injection of the neurosteroid. Analysis of total power revealed an increase in the θ and α frequency ranges (two way RM ANOVA, Interaction F(4,64) = 6.86, p < 0.001; Frequency F(4,64) = 24.76, p < 0.001, Genotype F(1,16) = 6.807, p = 0.019; post-hoc presented on Figure). Analysis of differences from baseline (relative power) revealed no change between baseline and EpiP. C. Total (left) and relative (right) power 60 min after i.p. injection of the neurosteroid. Analysis of total power revealed an increase in the δ, θ and α frequency ranges in WT animals (two way RM ANOVA, Interaction F(4,64) = 7.781, p < 0.001; Frequency F(4,64) = 22.04, p < 0.001, Genotype F(1,16) = 9.197, p = 0.008; post-hoc presented on Figure). Analysis of difference from baseline (relative power) revealed rise in δ on WT animals (two way RM ANOVA, Interaction F(4,64) = 3.30, p = 0.016; Frequency F(4,64) = 5.020, p = 0.001, Genotype F(1,16) = 0.108, p = 0.747; post-hoc presented on Figure). Analysis of recordings was averaged from 11 (WT) and 7 (CaV3.1 KO) animals. *p < 0.05, **p < 0.01, ***p < 0.001

Similar articles

Cited by

References

    1. Akeju O, Brown EN, 2017. Neural oscillations demonstrate that general anesthesia and sedative states are neurophysiologically distinct from sleep. Curr. Opin. Neurobiol 44, 178–185. - PMC - PubMed
    1. Alkire MT, Hudetz AG, Tononi G, 2008. Consciousness and anesthesia. Science 322, 876–880. - PMC - PubMed
    1. Atluri N, Joksimovic SM, Oklopcic A, Milanovic D, Klawitter J, Eggan P, Krishnan K, Covey DF, Todorovic SM, Jevtovic-Todorovic V, 2018. A neurosteroid analogue with T-type calcium channel blocking properties is an effective hypnotic, but is not harmful to neonatal rat brain. Br. J. Anaesth 120, 768–778. - PMC - PubMed
    1. Ayoola C, Hwang SM, Hong SJ, Rose KE, Boyd C, Bozic N, Park JY, Osuru HP, DiGruccio MR, Covey DF, Jevtovic-Todorovic V, Todorovic SM, 2014. Inhibition of CaV3.2 T-type calcium channels in peripheral sensory neurons contributes to analgesic properties of epipregnanolone. Psychopharmacology (Berl). 231, 3503–3515. - PMC - PubMed
    1. Belelli D, Lambert JJ, 2005. Neurosteroids : endogenous regulators of the GABAA receptor. Nat Rev Neurosci 6, 565–575. - PubMed

Publication types