

Comparison of 90Y SIRT predicted and delivered absorbed doses using a PSF conversion method
- PMID: 34339928
- PMCID: PMC8501309
- DOI: 10.1016/j.ejmp.2021.07.026
Comparison of 90Y SIRT predicted and delivered absorbed doses using a PSF conversion method
Abstract
Purpose: The aims of this study were to develop and apply a method to correct for the differences in partial volume effects of pre-therapy Technetium-99 m (99mTc)-MAA SPECT and post-therapy Yttrium-90 (90Y) bremsstrahlung SPECT imaging in selective internal radiation therapy, and to use this method to improve quantitative comparison of predicted and delivered 90Y absorbed doses.
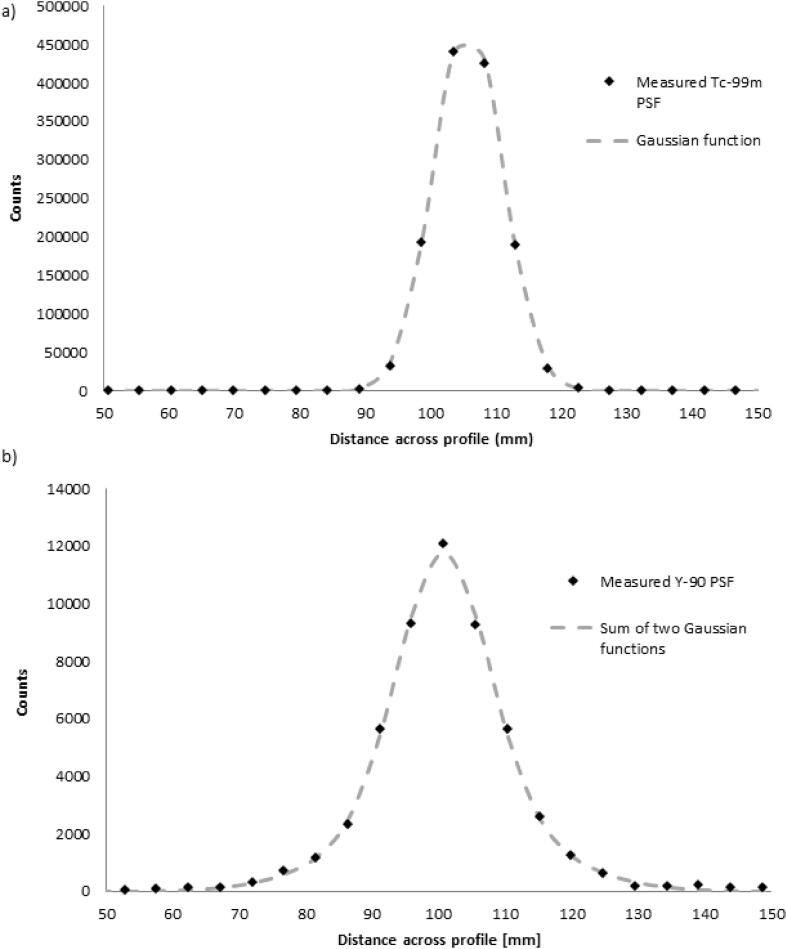
Methods: The spatial resolution of 99mTc SPECT data was converted to that of 90Y SPECT data using a function calculated from 99mTc and 90Y point spread functions. This resolution conversion method (RCM) was first applied to 99mTc and 90Y SPECT phantom data to validate the method, and then to clinical data to assess the power of 99mTc SPECT imaging to predict the therapeutic absorbed dose.
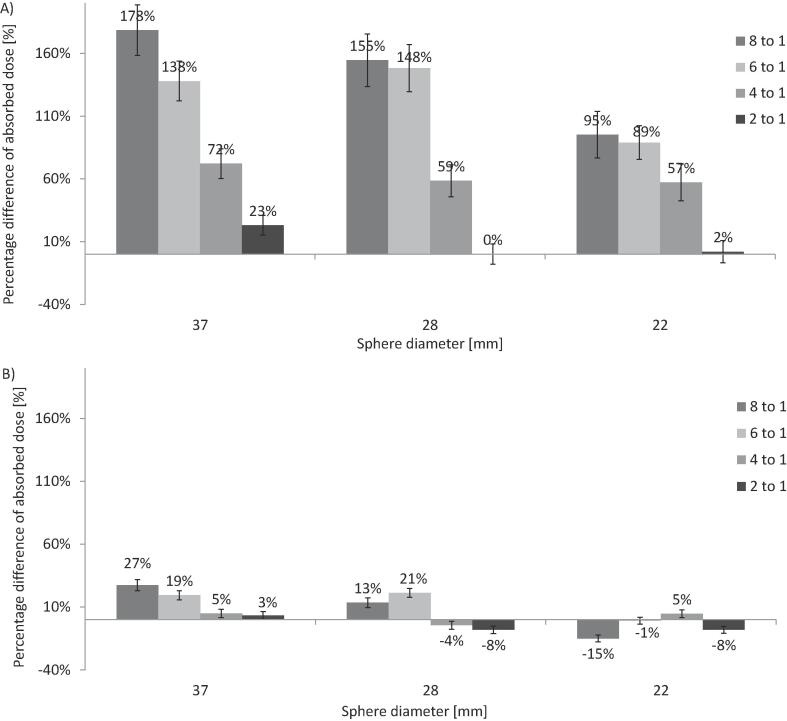
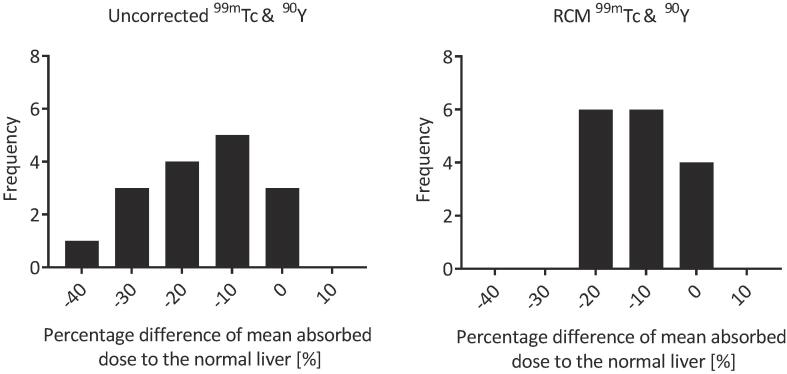
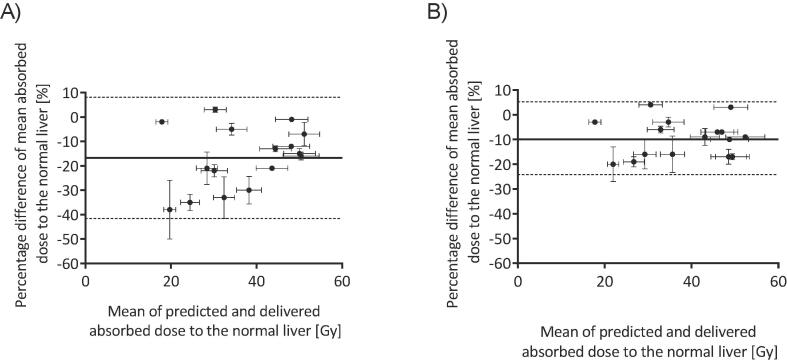
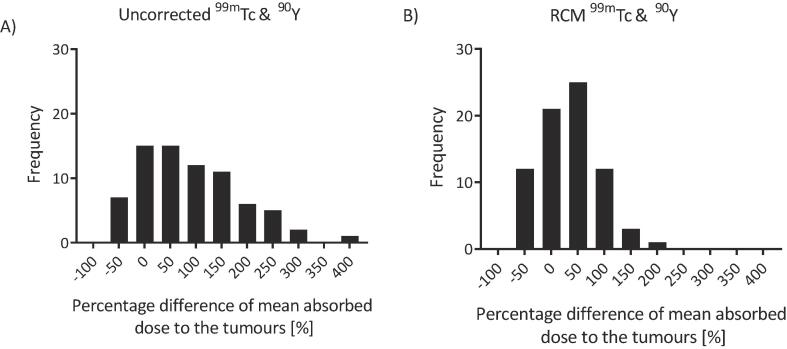
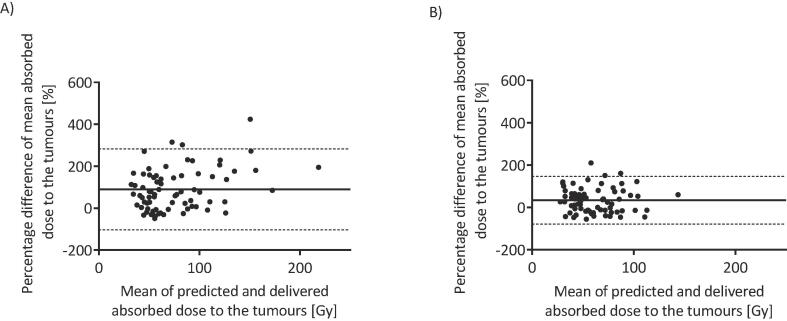
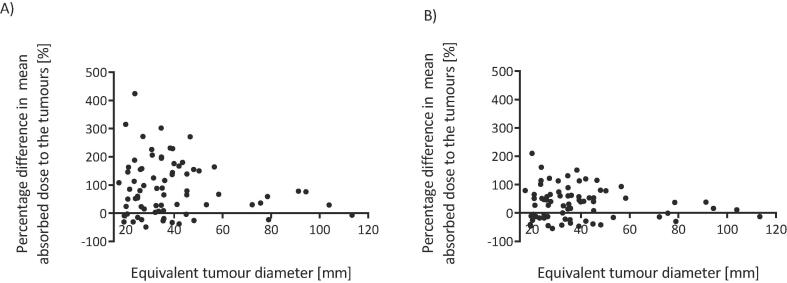
Results: The maximum difference between absorbed doses to phantom spheres was 178%. This was reduced to 27% after the RCM was applied. The clinical data demonstrated differences within 38% for mean absorbed doses delivered to the normal liver, which were reduced to 20% after application of the RCM. Analysis of clinical data showed that therapeutic absorbed doses delivered to tumours greater than 100 cm3 were predicted to within 52%, although there were differences of up to 210% for smaller tumours, even after the RCM was applied.
Conclusions: The RCM was successfully verified using phantom data. Analysis of the clinical data established that the 99mTc pre-therapy imaging was predictive of the 90Y absorbed dose to the normal liver to within 20%, but had poor predictability for tumours smaller than 100 cm3.
Keywords: Dosimetry; Liver; Microspheres; Radioembolisation; SIRT; Y-90.
Copyright © 2021 Associazione Italiana di Fisica Medica. Published by Elsevier Ltd. All rights reserved.
Conflict of interest statement
The authors declare that they have no known competing financial interests or personal relationships that could have appeared to influence the work reported in this paper.
Figures
Similar articles
-
Comparison of absorbed doses to the tumoral and non-tumoral liver in HCC patients undergoing 99mTc-MAA and 90Y-microspheres radioembolization.Ann Nucl Med. 2024 Mar;38(3):210-218. doi: 10.1007/s12149-023-01890-5. Epub 2023 Dec 24. Ann Nucl Med. 2024. PMID: 38142421
-
90 Y SPECT/CT quantitative study and comparison of uptake with pretreatment 99 m Tc-MAA SPECT/CT in radiomicrosphere therapy.J Appl Clin Med Phys. 2019 Feb;20(2):30-42. doi: 10.1002/acm2.12512. Epub 2019 Jan 9. J Appl Clin Med Phys. 2019. PMID: 30628156 Free PMC article.
-
3D image-based dosimetry for Yttrium-90 radioembolization of hepatocellular carcinoma: Impact of imaging method on absorbed dose estimates.Phys Med. 2020 Dec;80:317-326. doi: 10.1016/j.ejmp.2020.11.016. Epub 2020 Nov 25. Phys Med. 2020. PMID: 33248338
-
Clinical impact of (99m)Tc-MAA SPECT/CT-based dosimetry in the radioembolization of liver malignancies with (90)Y-loaded microspheres.Eur J Nucl Med Mol Imaging. 2016 Mar;43(3):559-75. doi: 10.1007/s00259-015-3157-8. Epub 2015 Sep 4. Eur J Nucl Med Mol Imaging. 2016. PMID: 26338177 Free PMC article. Review.
-
90Y-Loaded Microsphere SIRT of HCC Patients With Portal Vein Thrombosis: High Clinical Impact of 99mTc-MAA SPECT/CT-Based Dosimetry.Semin Nucl Med. 2019 May;49(3):218-226. doi: 10.1053/j.semnuclmed.2019.01.006. Epub 2019 Feb 7. Semin Nucl Med. 2019. PMID: 30954188 Review.
References
-
- Salem R., Padia S.A., Lam M., Bell J., Chiesa C., Fowers K. Clinical and dosimetric considerations for Y90: recommendations from an international multidisciplinary working group. Eur J Nucl Med Mol I. 2019;46(8):1695–1704. - PubMed
-
- Elschot M., Vermolen B.J., Lam M.G.E.H., de Keizer B., van den Bosch M.A.A.J., de Jong H.W.A.M. Quantitative comparison of PET and Bremsstrahlung SPECT for imaging the in vivo yttrium-90 microsphere distribution after liver radioembolization. PLoS ONE. 2013;8(2):e55742. doi: 10.1371/journal.pone.0055742. - DOI - PMC - PubMed
-
- Ott R.J., Flower M.A., Jones A., McCready V.R. The measurement of radiation doses from P32 chromic phosphate therapy of the peritoneum using SPECT. Eur J Nucl Med. 1985;11(8):305–308. - PubMed
MeSH terms
Substances
LinkOut - more resources
Full Text Sources
Medical
