. 2021 Aug 31;12(4):e0181621.
doi: 10.1128/mBio.01816-21. Epub 2021 Aug 3.

Orientia tsutsugamushi Nucleomodulin Ank13 Exploits the RaDAR Nuclear Import Pathway To Modulate Host Cell Transcription

Affiliations

Orientia tsutsugamushi Nucleomodulin Ank13 Exploits the RaDAR Nuclear Import Pathway To Modulate Host Cell Transcription

Haley E Adcox et al. mBio. .

Abstract

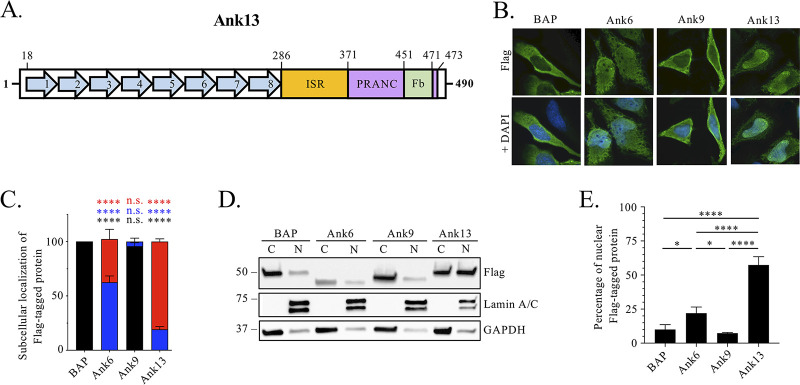
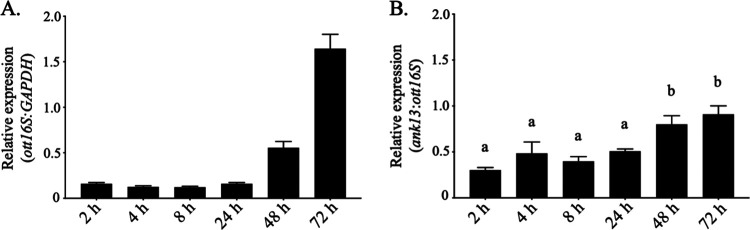
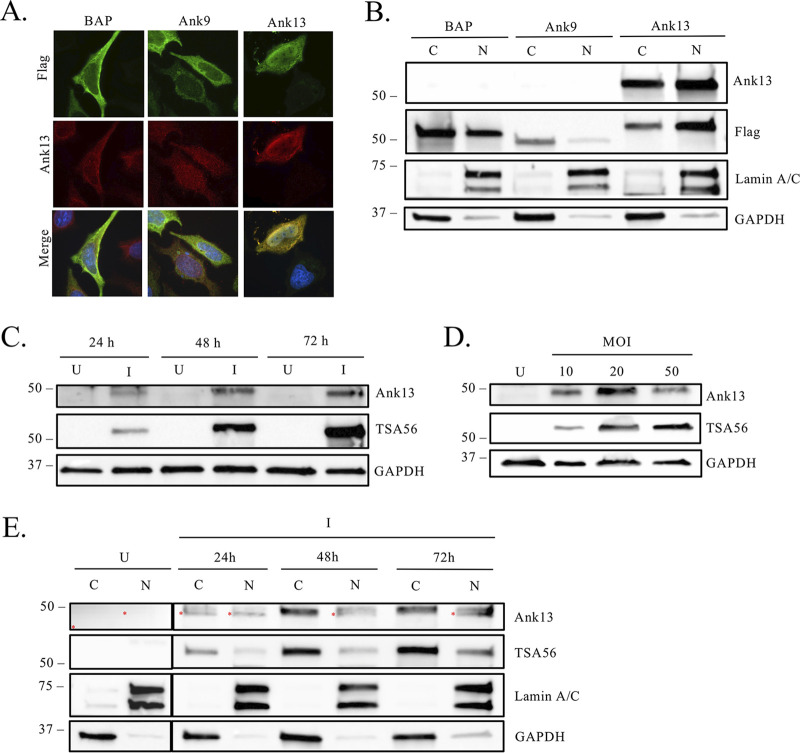
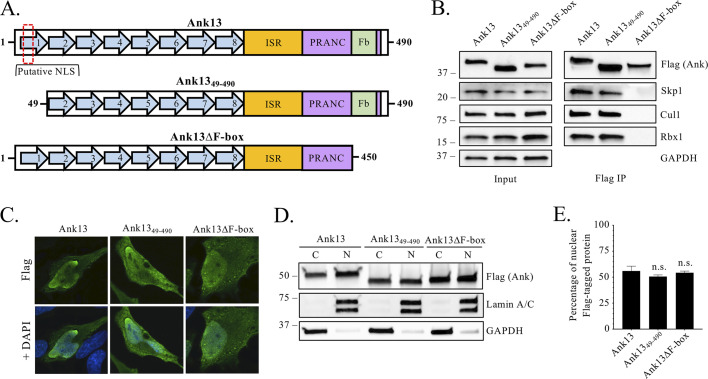
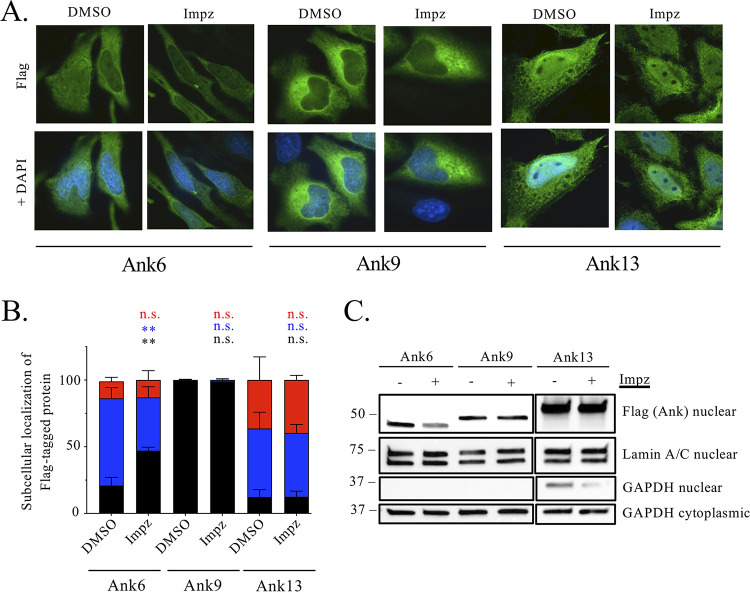
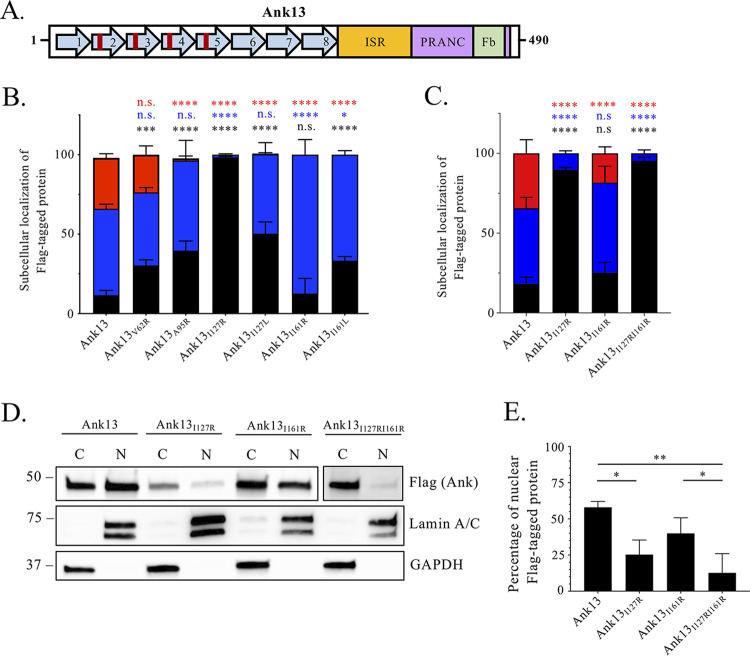
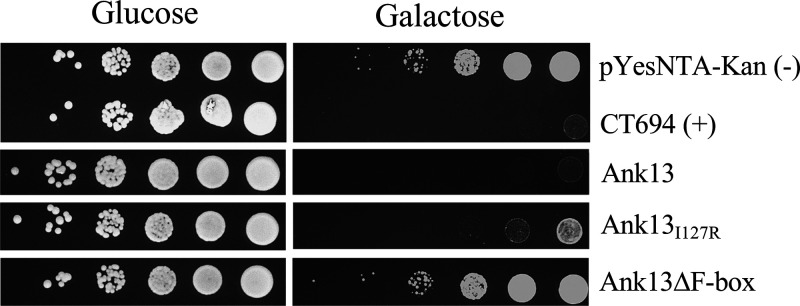
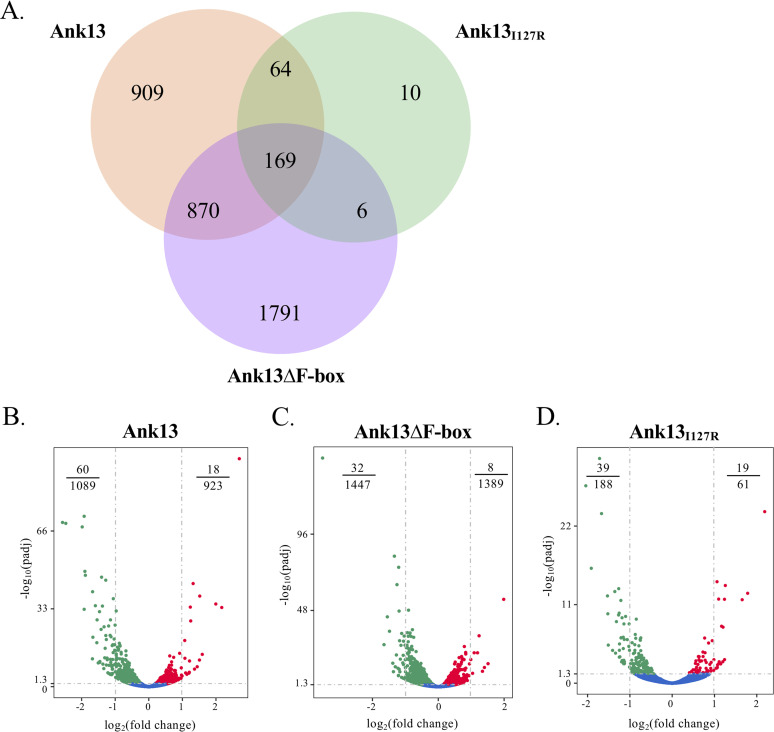
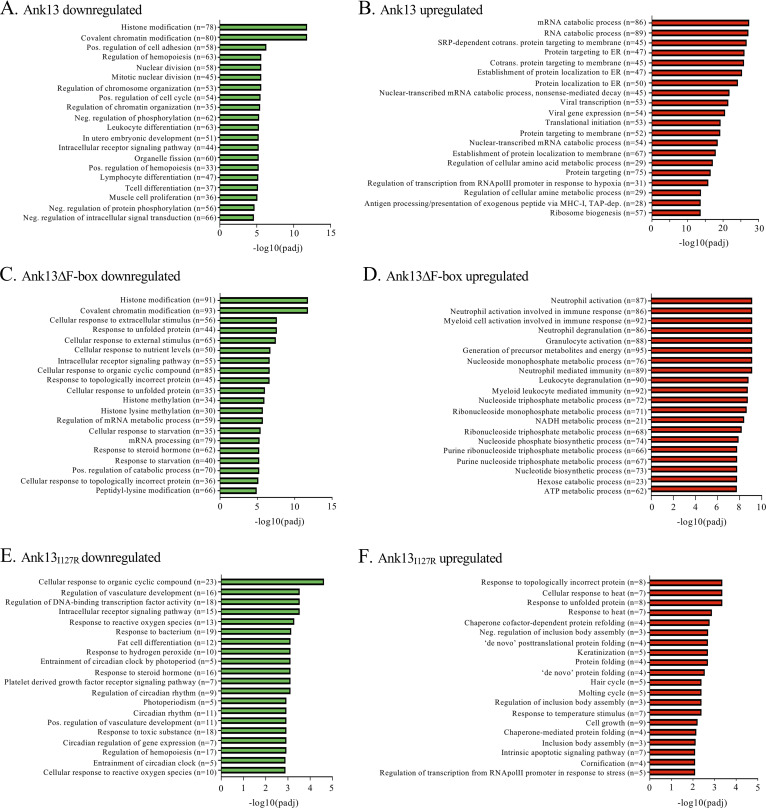
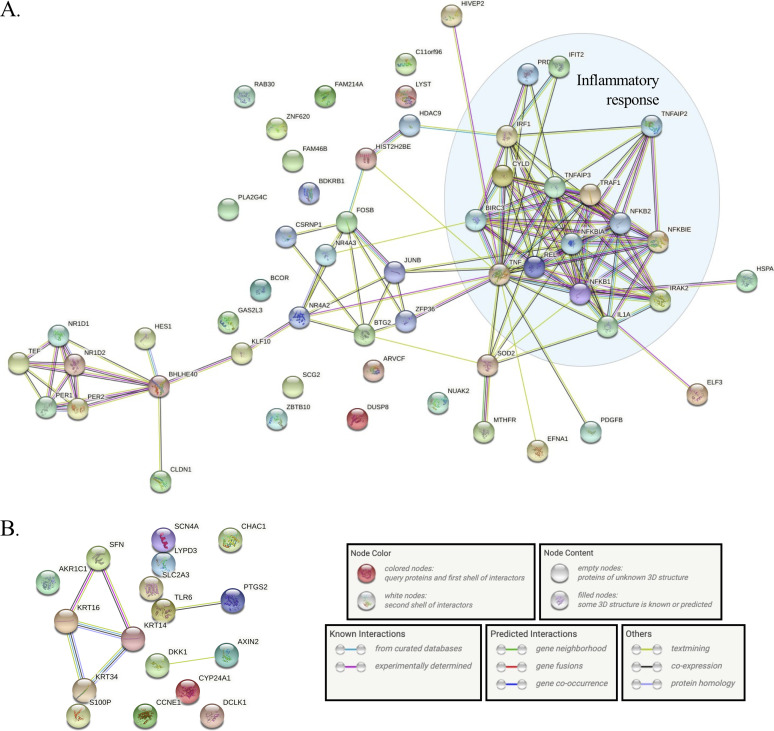
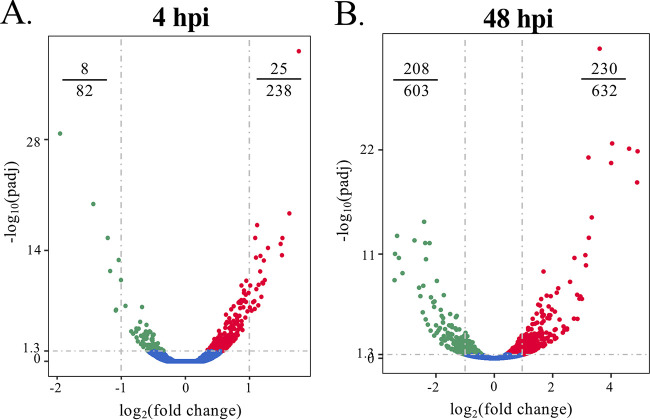
Orientia tsutsugamushi is the etiologic agent of scrub typhus, the deadliest of all diseases caused by obligate intracellular bacteria. Nucleomodulins, bacterial effectors that dysregulate eukaryotic transcription, are being increasingly recognized as key virulence factors. How they translocate into the nucleus and their functionally essential domains are poorly defined. We demonstrate that Ank13, an O. tsutsugamushi effector conserved among clinical isolates and expressed during infection, localizes to the nucleus in an importin β1-independent manner. Rather, Ank13 nucleotropism requires an isoleucine at the thirteenth position of its fourth ankyrin repeat, consistent with utilization of eukaryotic RaDAR (RanGDP-ankyrin repeats) nuclear import. RNA-seq analyses of cells expressing green fluorescent protein (GFP)-tagged Ank13, nucleotropism-deficient Ank13I127R, or Ank13ΔF-box, which lacks the F-box domain essential for interacting with SCF ubiquitin ligase, revealed Ank13 to be a nucleomodulin that predominantly downregulates transcription of more than 2,000 genes. Its ability to do so involves its nucleotropism and F-box in synergistic and mutually exclusive manners. Ank13 also acts in the cytoplasm to dysregulate smaller cohorts of genes. The effector's toxicity in yeast heavily depends on its F-box and less so on its nucleotropism. Genes negatively regulated by Ank13 include those involved in the inflammatory response, transcriptional control, and epigenetics. Importantly, the majority of genes that GFP-Ank13 most strongly downregulates are quiescent or repressed in O. tsutsugamushi-infected cells when Ank13 expression is strongest. Ank13 is the first nucleomodulin identified to coopt RaDAR and a multifaceted effector that functions in the nucleus and cytoplasm via F-box-dependent and -independent mechanisms to globally reprogram host cell transcription. IMPORTANCE Nucleomodulins are recently defined effectors used by diverse intracellular bacteria to manipulate eukaryotic gene expression and convert host cells into hospitable niches. How nucleomodulins enter the nucleus, their functional domains, and the genes that they modulate are incompletely characterized. Orientia tsutsugamushi is an intracellular bacterial pathogen that causes scrub typhus, which can be fatal. O. tsutsugamushi Ank13 is the first example of a microbial protein that coopts eukaryotic RaDAR (RanGDP-ankyrin repeats) nuclear import. It dysregulates expression of a multitude of host genes with those involved in transcriptional control and the inflammatory response being among the most prominent. Ank13 does so via mechanisms that are dependent and independent of both its nucleotropism and eukaryotic-like F-box domain that interfaces with ubiquitin ligase machinery. Nearly all the genes most strongly downregulated by ectopically expressed Ank13 are repressed in O. tsutsugamushi-infected cells, implicating its importance for intracellular colonization and scrub typhus molecular pathogenesis.

Keywords: Orientia tsutsugamushi; Rickettsia; ankyrin repeat; bacterial effector; intracellular bacterium; nucleomodulin.


Figures

FIG 1
FIG 1
Ank13 is nucleotropic. (A) Schematic of Ank13 depicting its eight tandemly arranged ankyrin repeats (blue arrows), ISR (orange), and F-box (Fb; green). The Fb occurs as part of a larger encompassing PRANC domain (purple). Amino acids that constitute each domain are indicated. (B to E) Flag-Ank13 predominantly localizes to the nucleus. Transfected HeLa cells expressing Flag-tagged BAP, Ank6, Ank9, or Ank13 were examined by immunofluorescence microscopy (B and C) and Western blot analysis of nuclear [N] and cytoplasmic [C] fractions (D and E). (B) Representative images of fixed cells immunolabeled with Flag antibody and stained with DAPI. (C) One hundred cells were examined per condition in triplicate to quantify the means ± the standard deviations (SD) for the percentages of cells exhibiting Flag immunosignal localization, which was scored as being exclusively cytoplasmic (black), throughout the cell (blue), or exclusively in the nucleus (red). Two-way ANOVA with Dunnett’s correction determined significance between subcellular locations of Flag-tagged proteins compared to Flag-BAP. The data are representative of three experiments with similar results. (D) Fractions were probed with lamin A/C and GAPDH antibodies to verify fraction purity and Flag antibody to determine localization of Flag-tagged protein. (E) The nuclear densitometric value was divided by the sum of nuclear and cytoplasmic densitometric values for Flag-tagged proteins in panel D. The quotient was multiplied by 100 to yield the percentage of Flag-tagged protein in the nucleus. Data presented are percentages (means ± the SD) of Flag-tagged proteins exhibiting nuclear localization from three separate experiments. One-way ANOVA with Tukey’s post hoc test was used to test for significant difference in percentage of nuclear Flag-tagged protein among the conditions. Statistically significant values are indicated. *, P < 0.05; ****, P < 0.0001. n.s., not significant.
FIG 2
FIG 2
O. tsutsugamushi expresses ank13 during infection of host cells. HeLa cells were synchronously infected with O. tsutsugamushi, followed by collection of total RNA at the indicated time points. RT-qPCR was performed using gene-specific primers. Relative O. tsutsugamushi 16S rRNA gene (ott16S)-to-human GAPDH (A) and ank13-to-ott16S expression (B) was determined using the 2−ΔΔCT method. The data are mean values ± the SD from three experiments performed in triplicate. One-way ANOVA with Tukey’s post hoc test was used to test for significant difference of relative ank13 levels across time points. The mean values indicated by the letter “a” are significantly different from those labeled “b.”
FIG 3
FIG 3
Antiserum specific for Ank13288-360 detects ectopically expressed and O. tsutsugamushi Ank13 in infected cells. (A and B) Anti-Ank13288-360 (anti-Ank13) specifically recognizes Flag-Ank13. HeLa cells expressing Flag-tagged BAP, Ank9, or Ank13 were either (i) fixed, probed with anti-Flag and anti-Ank13, stained with DAPI, and examined by immunofluorescence microscopy (A) or (ii) lysed and separated into cytoplasmic [C] and nuclear [N] fractions that were subjected to Western blot analyses using lamin A/C, GAPDH, Ank13, and Flag epitope antibodies (B). (C to E) Anti-Ank13 detects bacterium-derived Ank13 in O. tsutsugamushi-infected cells. HeLa cells were either mock [U] or infected [I] with O. tsutsugamushi at an MOI of 10, and whole-cell lysates were collected at 24, 48, and 72 h (C). An MOI of 10, 20, or 50 and whole-cell lysates was collected at 72 h (D), or an MOI of 10 and cytoplasmic [C] and nuclear [N] fractions was collected at 24, 48, and 72 h (E). Western blots were probed with the indicated antibodies. Red asterisks in panel E denote nonspecific host cell-derived bands. The results are representative of at least three experiments with similar results.
FIG 4
FIG 4
A putative NLS does not contribute to Ank13 nucleotropism. (A) Schematics of wild-type and Ank13 truncated mutant proteins. A red hatched line box indicates the putative NLS that consists of residues 10 to 42 and occurs within ankyrin repeat 1. (B) Confirmation that Ank13ΔF-box fails to interact with SCF ubiquitin ligase components. HeLa cells were transfected to express Flag-tagged Ank13, Ank1349-490, or Ank13ΔF-box. Input lysates were subjected to Western blotting with Flag antibody to verify ectopic expression of the proteins of interest; antibodies against Skp1, Cul1, and Rbx1 to confirm their presence; and GAPDH antibody to validate that equivalent amounts of protein were present in each sample. Whole-cell lysates were incubated with Flag antibody-conjugated agarose beads to immunoprecipitate (IP) Flag-tagged proteins and their interacting proteins. The resulting Western blot was probed with indicated antibodies to confirm recovery of the Flag-tagged proteins and assess for Skp1, Cul1, or Rbx1 coimmunoprecipitation. (C to E) Ankyrin repeat 1 (containing the putative NLS) and the F-box of Ank13 are dispensable for nuclear localization. Transfected HeLa cells expressing Flag-Ank13, Flag-Ank1349-490, or Flag-Ank13ΔF-box were either fixed, probed with Flag antibody, stained with DAPI, and examined by immunofluorescence microscopy (C) or lysed and resolved into cytoplasmic [C] and nuclear [N] fractions that were subjected to Western blot analyses using the indicated antibodies (D). (E) The nuclear densitometric value was divided by the sum of nuclear and cytoplasmic densitometric values for Flag-tagged proteins in panel D. The quotient was multiplied by 100 to yield the percentage of Flag-tagged protein in the nucleus. Data presented are the percentages (means ± the SD) of Flag-tagged proteins exhibiting nuclear localization from three separate experiments. One-way ANOVA with Tukey’s post hoc test was used to assess for significant differences among the conditions. n.s., not significant.
FIG 5
FIG 5
Ank13 nuclear accumulation is importazole-insensitive. HeLa cells expressing Flag-tagged Ank6, Ank9, or Ank13 were treated with importazole (Impz) or DMSO for 3 h and then fixed, probed with Flag antibody, stained with DAPI, and examined by immunofluorescence microscopy. (A) Representative immunofluorescent images. (B) One hundred cells per condition were examined in triplicate to quantify the percentages (means ± the SD) of cells exhibiting Flag immunosignal subcellular localization, scored as being exclusively cytoplasmic (black), throughout the cell (blue), or exclusively in the nucleus (red). Two-way ANOVA with Dunnett’s correction was used to determine significance between subcellular locations of Flag-Ank13 in cells treated with Impz versus DMSO. (C) Transfected HeLa cells were separated into cytoplasmic [C] and nuclear [N] fractions that were subjected to Western blot analyses using Flag antibody to verify Flag-tagged protein expression and antibodies against lamin A/C and GAPDH to confirm fraction purity. The data are representative of three experiments with similar results. Statistically significant values are indicated. **, P < 0.01; n.s., not significant.
FIG 6
FIG 6
Iso127 and Iso161 are critical for and contribute to Ank13 nuclear localization. (A) Schematic of Ank13 with the relative positions of V62, A95, I127, and I161 denoted as red lines. These amino acids were replaced with R or L to generate indicated mutants. (B to E) Transfected HeLa cells expressing Flag-Ank13 or Flag-Ank13 bearing the indicated amino acid substitutions were either examined by immunofluorescence microscopy (B and C) or Western blot analysis of nuclear [N] and cytoplasmic [C] fractions (D and E). (B and C) One hundred cells were examined per condition in triplicate to quantify the percentages (means ± the SD) of cells exhibiting Flag immunosignal localization, which was scored as being exclusively cytoplasmic (black), throughout the cell (blue), or exclusively in the nucleus (red). Two-way ANOVA with Dunnett’s correction determined significance between subcellular locations of Flag-tagged proteins compared to Flag-Ank13. (D) Western-blotted cytoplasmic [C] and nuclear [N] fractions were probed with lamin A/C and GAPDH antibody to verify fraction purity and Flag antibody to determine localization of Flag-tagged protein. (E) The densitometric value of each Flag-tagged protein in the nucleus was divided by the sum of the densitometric values for nuclear and cytoplasmic signals in panel D. The quotient was multiplied by 100 to yield the percentage of Flag-tagged protein in the nucleus. Data presented are the means ± the SD percentage of Flag-tagged proteins exhibiting nuclear localization from three separate experiments. One-way ANOVA with Tukey’s post hoc test was used to assess for significant differences among the conditions. *, P < 0.05; **, P < 0.01; ***, P < 0.001; ****, P < 0.0001. n.s., not significant.
FIG 7
FIG 7
Ank13 interferes with yeast growth in a nuclear translocation- and F-box-dependent manner. S. cerevisiae W303 was transformed with pYesNTA-Kan constructs for expressing C. trachomatis CT694, Ank13, Ank13I127R, Ank13ΔF-box, or vector alone. Transformants were diluted to an optical density at 600 nm of 0.2 and spotted as 10-fold serial dilutions onto dropout media containing 2% glucose (noninducing conditions) or 2% galactose (inducing conditions). The data are representative of two to four experiments with similar results.
FIG 8
FIG 8
Differential gene expression profiles influenced by Ank13, Ank13I127R, or Ank13ΔF-box. (A) Venn diagram showing unique and shared genes differentially expressed by Ank13 (orange, 2012 total), Ank13ΔF-box (purple, 2836 total), or Ank13I127R (green, 249 total). The sum within each circle is the total number of differentially expressed genes in this group and overlapping regions show the number of common genes among comparison groups. (B to D) Volcano plots showing differential expression profiles for cells expressing GFP-tagged Ank13 (B), Ank13ΔF-box (C), or Ank13I127R (D) compared to GFP. Gray horizontal dashed line indicates the threshold for significantly differentially expressed genes (Padj < 0.05). Vertical dashes indicate genes exhibiting a log2(fold change) of >1 or <−1. Each dot corresponds to an individual gene. Blue dots indicate no significant difference in expression for cells expressing GFP fusions compared to cells expressing GFP. Red and green dots indicate genes that are up- or downregulated, respectively, in cells expressing GFP-fusions versus cells expressing GFP. Fractions in top corners denote the number of genes with log2(fold change) of >1 or <−1 out of the total number of differentially expressed genes.
FIG 9
FIG 9
Differentially regulated pathways in cells expressing Ank13, Ank13I127R, or Ank13ΔF-box grouped by biological process. Bar plots showing the GO terms subdivided by biological processes that are down- or upregulated in cells expressing GFP-tagged Ank13 (A and B), Ank13ΔF-box (C and D), or Ank13I127R (E and F) compared to cells expressing GFP. Shown are the top 20 most significantly enriched downregulated (green; A, C, and E) and upregulated (red; B, D, and F) GO terms as determined by –log10(Padj) value. n = number of genes included in GO term.
FIG 10
FIG 10
Genes downregulated in cells expressing Ank13 show enriched modulation of the inflammatory response. The 60 host genes that were downregulated (A) or 18 genes that were upregulated (B) ≥2-fold in cells expressing GFP-Ank13 were subjected to STRING analysis. The shaded blue oval in panel A was added manually to denote genes involved in host cell inflammatory response.
FIG 11
FIG 11
Differential gene expression profiles influenced by O. tsutsugamushi infection. Volcano plots showing differential expression profiles for cells infected with O. tsutsugamushi for 4 h (A) or 48 h (B) compared to uninfected cells. Gray horizontal dashed line indicates the threshold for significantly differentially expressed genes (Padj < 0.05). Vertical dashes indicate genes exhibiting a log2(fold change) of >1 or <−1. Each dot corresponds to an individual gene. Blue dots indicate no significant difference in infected cells compared to uninfected cells. Red and green dots indicate genes that are up- or downregulated, respectively, in cells expressing GFP fusions versus cells expressing GFP. Fractions in top corners denote the number of genes with log2(fold change) of >1 or <−1 out of the total number of differentially expressed genes.

Similar articles

Cited by

References

    1. Bierne H, Pourpre R. 2020. Bacterial factors targeting the nucleus: the growing family of nucleomodulins. Toxins 12:220. doi:10.3390/toxins12040220. - DOI - PMC - PubMed
    1. Hanford HE, Von Dwingelo J, Abu Kwaik Y. 2021. Bacterial nucleomodulins: a coevolutionary adaptation to the eukaryotic command center. PLoS Pathog 17:e1009184. doi:10.1371/journal.ppat.1009184. - DOI - PMC - PubMed
    1. Luce-Fedrow A, Lehman ML, Kelly DJ, Mullins K, Maina AN, Stewart RL, Ge H, John HS, Jiang J, Richards AL. 2018. A review of scrub typhus (Orientia tsutsugamushi and related organisms): then, now, and tomorrow. Tropical Med 3:8. doi:10.3390/tropicalmed3010008. - DOI - PMC - PubMed
    1. Xu G, Walker DH, Jupiter D, Melby PC, Arcari CM. 2017. A review of the global epidemiology of scrub typhus. PLoS Negl Trop Dis 11:e0006062. doi:10.1371/journal.pntd.0006062. - DOI - PMC - PubMed
    1. Weitzel T, Martínez-Valdebenito C, Acosta-Jamett G, Jiang J, Richards AL, Abarca K. 2019. Scrub typhus in continental Chile, 2016-2018. Emerg Infect Dis 25:1214–1217. doi:10.3201/eid2506.181860. - DOI - PMC - PubMed

Publication types

LinkOut - more resources