. 2021 Aug 31;12(4):e0115321.
doi: 10.1128/mBio.01153-21. Epub 2021 Aug 3.

Captive Common Marmosets (Callithrix jacchus) Are Colonized throughout Their Lives by a Community of Bifidobacterium Species with Species-Specific Genomic Content That Can Support Adaptation to Distinct Metabolic Niches

Affiliations

Captive Common Marmosets (Callithrix jacchus) Are Colonized throughout Their Lives by a Community of Bifidobacterium Species with Species-Specific Genomic Content That Can Support Adaptation to Distinct Metabolic Niches

Lifeng Zhu et al. mBio. .

Abstract

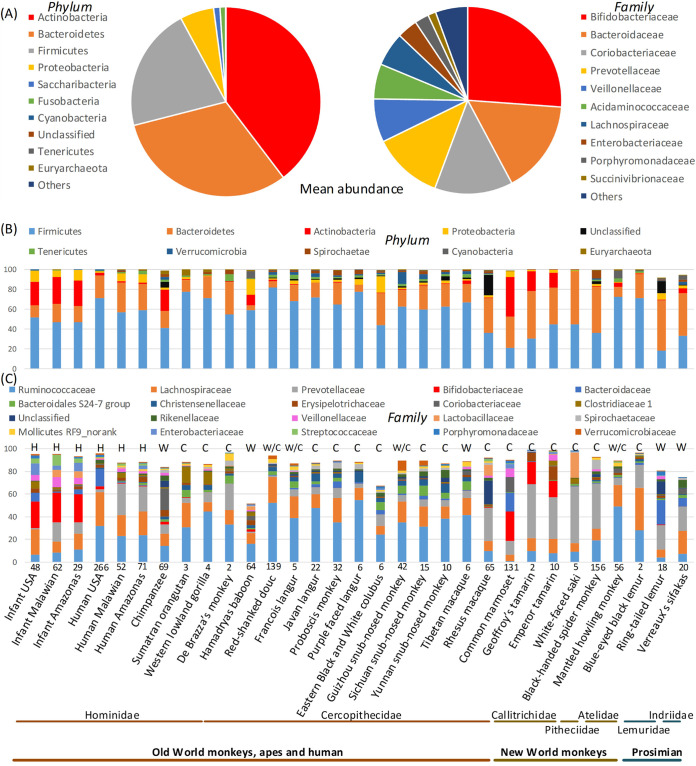
The common marmoset (Callithrix jacchus) is an omnivorous New World primate whose diet in the wild includes large amounts of fruit, seeds, flowers, and a variety of lizards and invertebrates. Marmosets also feed heavily on tree gums and exudates, and they have evolved unique morphological and anatomical characteristics to facilitate gum feeding (gummivory). In this study, we characterized the fecal microbiomes of adult and infant animals from a captive population of common marmosets at the Callitrichid Research Center at the University of Nebraska at Omaha under their normal dietary and environmental conditions. The microbiomes of adult animals were dominated by species of Bifidobacterium, Bacteroides, Prevotella, Phascolarctobacterium, Megamonas, and Megasphaera. Culturing and genomic analysis of the Bifidobacterium populations from adult animals identified four known marmoset-associated species (B. reuteri, B. aesculapii, B. myosotis, and B. hapali) and three unclassified taxa of Bifidobacterium that are phylogenetically distinct. Species-specific quantitative PCR (qPCR) confirmed that these same species of Bifidobacterium are abundant members of the microbiome throughout the lives of the animals. Genomic loci in each Bifidobacterium species encode enzymes to support growth and major marmoset milk oligosaccharides during breastfeeding; however, metabolic islands that can support growth on complex polysaccharide substrates in the diets of captive adults (pectin, xyloglucan, and xylan), including loci in B. aesculapii that can support its unique ability to grow on arabinogalactan-rich tree gums, were species-specific. IMPORTANCEBifidobacterium species are recognized as important, beneficial microbes in the human gut microbiome, and their ability colonize individuals at different stages of life is influenced by host, dietary, environmental, and ecological factors, which is poorly understood. The common marmoset is an emerging nonhuman primate model with a short maturation period, making this model amenable to study the microbiome throughout a life history. Features of the microbiome in captive marmosets are also shared with human gut microbiomes, including abundant populations of Bifidobacterium species. Our studies show that several species of Bifidobacterium are dominant members of the captive marmoset microbiome throughout their life history. Metabolic capacities in genomes of the marmoset Bifidobacterium species suggest species-specific adaptations to different components of the captive marmoset diet, including the unique capacity in B. aesculapii for degradation of gum arabic, suggesting that regular dietary exposure in captivity may be important for preserving gum-degrading species in the microbiome.

Keywords: Bifidobacterium; common marmoset; diet-driven gut microbiomes; gum arabic; gum-feeding specialists.


Figures

FIG 1
FIG 1
High relative abundances of Bifidobacteriaceae and Bacteroidaceae in adult common marmoset gut microbiomes. (A) Mean relative abundances of common marmoset gut microbiomes at the phylum level (left) and family level (right). Mean relative abundances of dominant species shared across gut microbiomes of 26 primate species at the phylum (B) and family (C) levels. The sample origins are indicated at the bottom of panel C, with numbers of samples indicated immediately above the name and the sources of the samples indicated above each bar for samples from humans, captive primates, wild primates, and a combination of captive and wild primates (H, C, W, and C/W, respectively). Only dominant taxa shared across most samples are indicated, and nonshared or nondominant taxa account for the remaining relative abundances that total 100%.
FIG 2
FIG 2
Circular phylogram of the cgMLST-based neighbor-joining phylogenies of common marmoset Bifidobacterium isolates. Whole-genome sequencing data were used to define a set of 318 core genes shared by 18 different isolates of Bifidobacterium from the common marmosets, along with genomes from 64 other strains representing 48 different species of Bifidobacterium from humans, primates, and other host species. The core shared genome from this data set was developed from alignments with MUSCLE (120) (bootstrap, 500), and cgMLST analysis was performed on the concatenated core gene sets by neighbor-joining analysis using FastTree (115). The phylogeny was visualized in iTree of Life; red squares on branches indicate >90% bootstrap values. Isolates from the common marmosets that were assigned to known taxa are color-coded in blue (BR, B. reuteri), green (BM, B. myosotis), purple (BA, B. aesculapii), and red (BH, B. hapali), and those assigned as putative new species are in orange (new species MARM_A1, MARM_A2, and MARM_A3).
FIG 3
FIG 3
Relative abundances of the dominant genera from 16S rRNA sequencing of the fecal microbiotas of maturing infant marmosets. Area plots are shown for three infants originating from three independent families of common marmosets from the CRC. Sampling time points are indicated in days on the x axis, and the relative times that each animal spent exclusively on breastmilk (B, blue bar), mixed breastmilk plus solid food (M, red bar), and solid food (S, gray bar) are indicated by the corresponding lengths of the bars.
FIG 4
FIG 4
qPCR analysis of Bifidobacterium species and subtypes during maturation of a cohort of infant marmosets. A cohort including seven newborn infants was developed from three pairs of twins originating from different dams and from a seventh newborn animal from a fourth dam. (A to G) Data from individual animals. In each panel, the top graph depicts quantification of the total Bifidobacterium population, and the lower panel shows quantifications of the individual Bifidobacterium species/phylotypes. In each panel, shading is used to show the developmental phase of the individual samples (light blue, the breastfeeding phase; light yellow, weaning; light green, solid diet). Numbers of days after birth are indicated on the x axis. Animals from the same dams are shown in panels A and B (dam = Artemis), panels C and D (dam = Harlow), and panels E and F (dam = Velcro), and an individual animal is shown in panel G from dam Izla. The qPCR assays were performed with genus-specific primers for total Bifidobacterium spp. and with primers specific for individual species/phylotypes (B. reuteri phylotype 1, B. reuteri phylotype 2, B. myosotis, B. aesculapii, B. hapali, MARM_A1, MARM_A2, and MARM_A3). Trend lines for data from each species and subtype are color-coded according to the key. The values for total Bifidobacterium spp. are reported as log10 numbers of CFU per nanogram of total DNA, while the log-transformed relative frequencies are reported for each species and phylotype by dividing the log10 number of CFU per nanogram of DNA for each species/phylotype by the sum of log10 number of CFU per nanogram of total DNA from all detectible species/phylotypes from the same sample. Trendlines of the relative frequencies were generated by LOWESS, with variance depicted by shading of the trendlines.
FIG 5
FIG 5
qPCR-based relative proportions of Bifidobacterium species and phylotypes from twin pairs converge after adaptation to a complex diet. Bar charts show the percent abundance of each Bifidobacterium species and phylotype in twin pairs from the earliest time point after birth (left panel, outlined in red) and the latest time points after dietary adaptation (right panel, outlined in blue). The percent abundances were calculated from the qPCR-based relative frequencies shown in Fig. 4 and standardized to a total combined abundance of 100% for all eight taxa (B. reuteri phylotype 1 [PT1], B. reuteri phylotype 2 [PT2], B. myosotis, B. aesculapii, B. hapali, MARM_A1, MARM_A2, and MARM_A3). Twin pairs from the same dam are indicated by numbers on the x axis, while the alphabetic letters identify individual animals on the birth and dietary adaptation panels.
FIG 6
FIG 6
Comparative genomic analysis of candidate genes for degradation of marmoset breastmilk oligosaccharides. Putative orthologues for lacto-N-biose phosphorylase (LNBP) and N-acetylglucosamine utilization were identified from the genomes of marmoset-derived Bifidobacterium species and are depicted in their genomic contexts for each of the species. Curved lines denote linked sets of genes. The relevant gene content for each species is separated by dotted lines. The LNBP gene (maroon) and adjacent genes encoding α-mannosidases (green), α-glucosidases (blue), transporters (orange), N-acetyl hexosaminidase (purple), N-acetylglucosamine utilization (light purple), α-fucosidases (pink), and galactose utilization (yellow) are shown with gene ID numbers for orthologous genes corresponding to the MARM_A1 annotation. HTH TX, helix-turn-helix transcription factor.
FIG 7
FIG 7
Gene islands for pectin utilization in MARM_A1. The two islands, termed pectin island 1 (PI-1) and pectin island 2 (PI-2) are shown with the relevant functional contents of the genes in each island color-coded according to the key in the upper right corner. The MARM_A1 gene IDs are indicated for each gene, and the curved line in PI-1 denotes contiguous genes. The 01241 α-rhamnosidase gene is positioned at a site distal from PI-1 and PI-2.
FIG 8
FIG 8
Growth of Bifidobacterium isolates on gum arabic and arabinogalactan. (A and B) Liquid cultures of the isolates were grown on 1% glucose, 1% gum arabic, or bMRS. The graph in panel A is from the three isolates of B. aesculapii (8B6, 8M5, 10M9), while panel B shows data from isolates of B. reuteri, B. myosotis, B. hapali, MARM_A1, MARM_A2, and MARM_A3. OD600 readings were taken at 0, 4, 8, 12, and 24 h of anaerobic culture at 37°C. (C) The B. aesculapii isolates were grown in liquid cultures of bMRS containing 1% glucose, 1% arabinose, 1% galactose, 1% larch wood arabinogalactan, or bMRS.
FIG 9
FIG 9
Candidate genomic loci for tree gum degradation in B. aesculapii. (A) Sets of genes encoding galactanases and arabinases at four different genomic positions in B. aesculapii. Genes are colored according to their predicted activities (green = galactanases, blue = arabinases, red = transcription regulators, yellow = transport). (B) The domain structures of the GH127 HypBA2 β-arabinose from B. longum is shown along with the putative GH127 HypBA2-like proteins from B. aesculapii. Domain colors are defined at the bottom of the panel. (C) Backbone structures of gum arabic, larch wood arabinogalactan, and the ArabinoGalacto protein b extensin. Individual carbohydrate monomers are colored according to the key in the lower left of the panel, and sites for cleavage by different galactanases and arabinases are indicated by the colored arrows.
FIG 10
FIG 10
Network representation of metabolic interactions between marmoset Bifidobacterium species and major dietary substrates. The network was developed in SocNetV using genomic data from the individual marmoset Bifidobacterium species to infer capacity to serve as a primary degrader (full pathway present) or secondary cross-feeder (enzymatic capacity to degrade subcomponents) of major dietary components. Nodes representing the individual Bifidobacterium species and phylotypes are shown in yellow, while nodes representing major substrates are colored red (pectins), brown (xyloglucans), green (arabinogalactans), light blue (xylans), and royal blue (breastmilk oligosaccharides). Edges that are colored black indicate primary degraders and their substrates, while edges colored gray depict secondary cross-feeders. The graph was developed using a random prominence index with edges for primary degraders weighted arbitrarily at 10 and secondary degraders weighted by the number of relevant enzymes in the genome of each organism.

Similar articles

Cited by

References

    1. Dethlefsen L, McFall-Ngai M, Relman DA. 2007. An ecological and evolutionary perspective on human-microbe mutualism and disease. Nature 449:811–818. doi:10.1038/nature06245. - DOI - PMC - PubMed
    1. Ley RE. 2010. Obesity and the human microbiome. Curr Opin Gastroenterol 26:5–11. doi:10.1097/MOG.0b013e328333d751. - DOI - PubMed
    1. Tremaroli V, Bäckhed F. 2012. Functional interactions between the gut microbiota and host metabolism. Nature 489:242–249. doi:10.1038/nature11552. - DOI - PubMed
    1. Diaz Heijtz R, Wang S, Anuar F, Qian Y, Björkholm B, Samuelsson A, Hibberd ML, Forssberg H, Pettersson S. 2011. Normal gut microbiota modulates brain development and behavior. Proc Natl Acad Sci U S A 108:3047–3052. doi:10.1073/pnas.1010529108. - DOI - PMC - PubMed
    1. Qin J, Li R, Raes J, Arumugam M, Burgdorf KS, Manichanh C, Nielsen T, Pons N, Levenez F, Yamada T, Mende DR, Li J, Xu J, Li S, Li D, Cao J, Wang B, Liang H, Zheng H, Xie Y, Tap J, Lepage P, Bertalan M, Batto J-M, Hansen T, Le Paslier D, Linneberg A, Nielsen HB, Pelletier E, Renault P, Sicheritz-Ponten T, Turner K, Zhu H, Yu C, Li S, Jian M, Zhou Y, Li Y, Zhang X, Li S, Qin N, Yang H, Wang J, Brunak S, Doré J, Guarner F, Kristiansen K, Pedersen O, Parkhill J, Weissenbach J, MetaHIT Consortium , et al.. 2010. A human gut microbial gene catalogue established by metagenomic sequencing. Nature 464:59–65. doi:10.1038/nature08821. - DOI - PMC - PubMed

Publication types

LinkOut - more resources