. 2021 Aug 2;22(1):585.
doi: 10.1186/s12864-021-07812-x.

Stage-specific transcriptomic changes in pancreatic α-cells after massive β-cell loss

Affiliations

Stage-specific transcriptomic changes in pancreatic α-cells after massive β-cell loss

Daniel Oropeza et al. BMC Genomics. .

Abstract

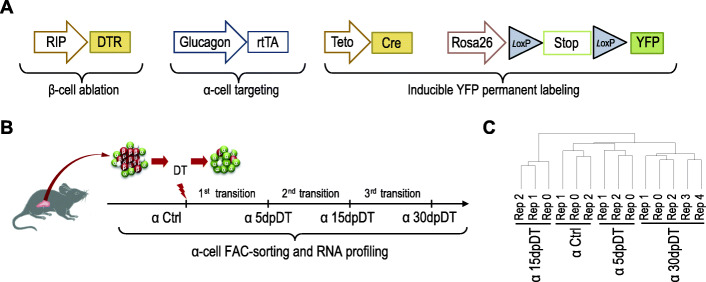
Background: Loss of pancreatic insulin-secreting β-cells due to metabolic or autoimmune damage leads to the development of diabetes. The discovery that α-cells can be efficiently reprogrammed into insulin-secreting cells in mice and humans has opened promising avenues for innovative diabetes therapies. β-cell loss triggers spontaneous reprogramming of only 1-2% of α-cells, limiting the extent of regeneration. Most α-cells are refractory to conversion and their global transcriptomic response to severe β-cell loss as well as the mechanisms opposing their reprogramming into insulin producers are largely unknown. Here, we performed RNA-seq on FAC-sorted α-cells to characterize their global transcriptional responses at different time points after massive β-cell ablation.

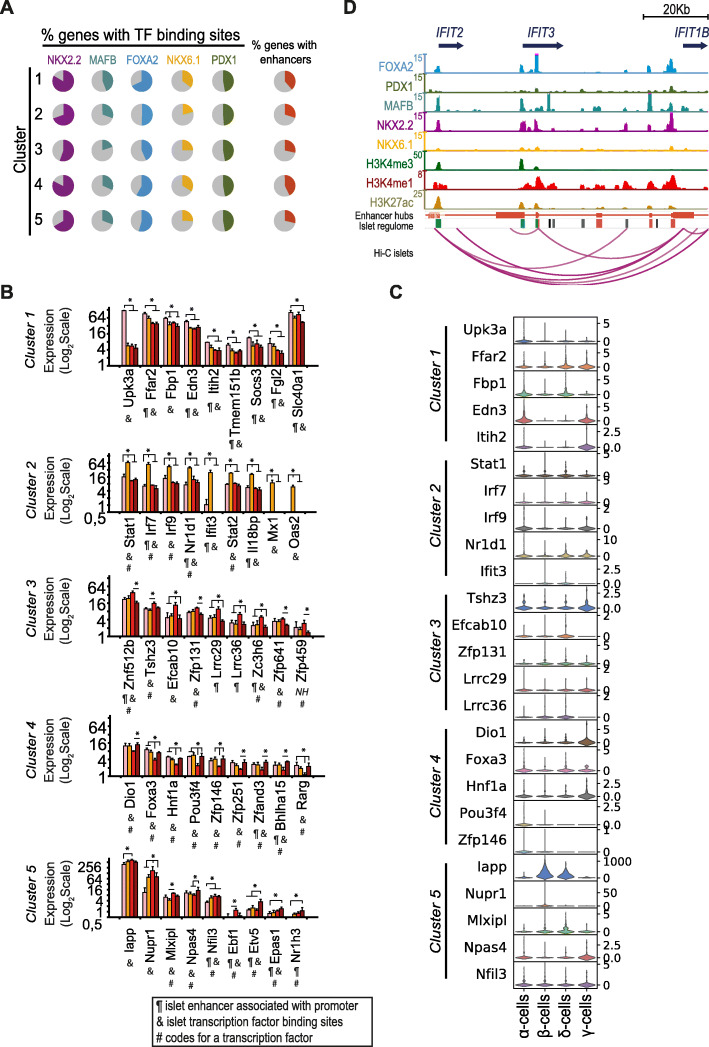
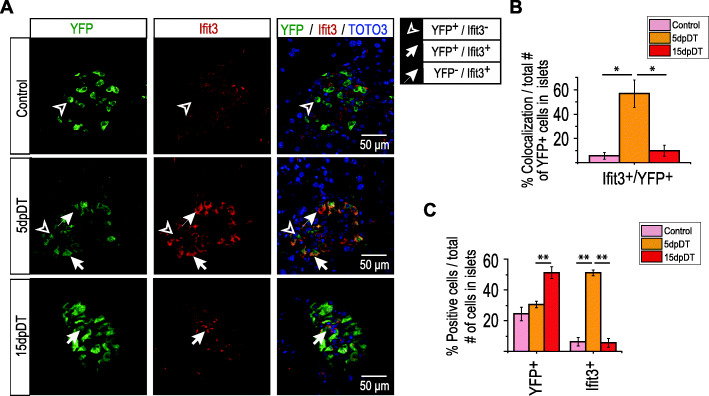
Results: Our results show that α-cells undergo stage-specific transcriptional changes 5- and 15-days post-diphtheria toxin (DT)-mediated β-cell ablation. At 5 days, α-cells transiently upregulate various genes associated with interferon signaling and proliferation, including Interferon Induced Protein with Tetratricopeptide Repeats 3 (Ifit3). Subsequently, at 15 days post β-cell ablation, α-cells undergo a transient downregulation of genes from several pathways including Insulin receptor, mTOR and MET signaling.

Conclusions: The results presented here pinpoint novel markers discriminating α-cells at different stages after acute β-cell loss, and highlight additional signaling pathways that are modulated in α-cells in this context.

Keywords: Alpha cell; Beta cell; Conversion; Ifit3; Pancreas; Pancreatic islet; Plasticity; RNA-seq; Regeneration; Transcriptome.


Conflict of interest statement

The authors declare that they have no competing interests.

Figures

Fig. 1
Fig. 1
α-cells undergo stage-selective global transcriptional changes after diphtheria toxin (DT)-induced β-cell loss. A Schematic of the transgenic mice used in this work. B Experimental design. α-cell lineage tracing was performed administering doxycycline for 2 weeks in the drinking water. After 2 additional weeks of DOX clearance, β-cells were ablated by intraperitoneal diphtheria toxin injections on days 1, 3 and 5. α-cells were purified at 5, 15 and 30 days post-DT injection (dpDT). C Hierarchical clustering analysis shows that the transcriptomes from stage-specific α-cell samples present higher correlation with biological replicates than with samples from other stages
Fig. 2
Fig. 2
Analysis of the α-cell dynamic transcriptional response to β-cell loss reveals signaling pathways potentially modulating α-cell conversion towards insulin production. Selected Gene Set Enrichment Analysis (GSEA) results are presented (see also Figure S2). Genes with higher expression in 5dpDT α-cells, relative to its timely connected stages (Ctrl and 15dpDT α-cells) are associated with interferon signaling and control of the mitotic process. Genes downregulated in 15dpDT α-cells, relative to its timely connected stages (5dpDT and 30dpDT α-cells) are associated with inhibition of signaling from InsR, mTOR and MET pathways. All results presented are significant, considering a P-value < 0.05 and FDR < 0.25
Fig. 3
Fig. 3
Key α-cell transitional gene expression signatures define α-cell stages after acute β-cell loss. A PCA shows that 1522 differentially expressed genes are enough to distinguish between α-cells from different stages after β-cell loss. The bar plot on the left depicts the percent of variance explained by each of the principal components (PC). PC1, accounting itself for 40% of the variance among samples, clearly separates α-cell 15dpDT replicates from the rest of the samples, suggesting that these cells present the most different transcriptomic signature. B Hierarchical clustering of 1522 differentially expressed genes identifies 5 gene clusters associated with specific α-cell signatures that are characteristic of each stage. C Clustered genes’ distribution across the PCA1, PCA2 and PCA3 dimensions. D The gene expression pattern characteristic of each cluster is associated with enrichment at specific α-cell stages. The boxes show the IQR of RNA levels, whiskers extend to 1.5 times the IQR or extreme values and notches indicate 95% confidence intervals of the median. The P-value was calculated with the Wilcoxon rank-sum test. NS: Not significant
Fig. 4
Fig. 4
Epigenomic analyses reveal stage-specific marker genes potentially driving the α-cell response to β-cell loss. A Proportion of genes from each cluster associated with transcription factor binding sites, and proportion of cluster genes with their promoter interacting with at least 1 islet enhancer. B Expression profiles for selected cluster 1–5 markers. Codes below each gene name indicate association with at least one transcription factor binding site in human islets (&), promoter physical interaction (pcHi-C) with at least one human islet enhancer (¶) and whether the gene encodes for a transcription factor (#). NH: No human homolog found. * P < 0.05. C Violin plots showing the single-cell expression profiles for selected cluster marker genes in mouse pancreatic islet endocrine cell types (data from [28]). D Integrative map of the IFIT3 locus showing human islet ChIP-seq signal for 5 key pancreatic islet transcription factors, histone modification enrichment profiles associated with active (H3K27ac) promoter (H3K4me3) and enhancer (H3K4me1) regions, islet enhancer hubs, islet regulome regions and arcs representing high-confidence pcHi-C interactions in human islets (data from [18, 26])
Fig. 5
Fig. 5
Ifit3 expression is strongly induced in α-cells after acute β-cell loss. A Representative immunofluorescence staining of pancreas sections obtained from Ctrl, 5dpDT and 15dpDT treated mice. B Percentage of cells co-expressing Ifit3 and YFP, expressed relative to the total number of total YFP+ cells in the islets. * P < 0.05. Total number of YFP+ cells (expressed as mean ± SEM) counted per replicate: Control (615 ± 268), 5dpDT (341 ± 184), 15dpDT (206 ± 48) from 3 biological replicates. C Percentage of cells expressing YFP, Ifit3, and co-expressing both markers, expressed relative to the total number of islet cells. Note that YFP+ cells represent the main cell type in 15dpDT islets given that by this timepoint β-cell ablation is almost complete. ** P < 0.01. Total number of islet cells (expressed as mean ± SEM) counted per replicate: Control (2291 ± 613), 5dpDT (1110 ± 455), 15dpDT (404 ± 96) from 3 biological replicates

References

    1. Holmberg J, Perlmann T. Maintaining differentiated cellular identity. Nat Rev Genet. 2012;13(6):429–439. doi: 10.1038/nrg3209. - DOI - PubMed
    1. Thowfeequ S, Myatt EJ, Tosh D. Transdifferentiation in developmental biology, disease, and in therapy. Dev Dyn. 2007;236(12):3208–3217. doi: 10.1002/dvdy.21336. - DOI - PubMed
    1. Thorel F, Nepote V, Avril I, Kohno K, Desgraz R, Chera S, Herrera PL. Conversion of adult pancreatic alpha-cells to beta-cells after extreme beta-cell loss. Nature. 2010;464(7292):1149–1154. doi: 10.1038/nature08894. - DOI - PMC - PubMed
    1. Chera S, Baronnier D, Ghila L, Cigliola V, Jensen JN, Gu G, Furuyama K, Thorel F, Gribble FM, Reimann F, Herrera PL. Diabetes recovery by age-dependent conversion of pancreatic delta-cells into insulin producers. Nature. 2014;514(7523):503–507. doi: 10.1038/nature13633. - DOI - PMC - PubMed
    1. Cigliola V, Ghila L, Thorel F, van Gurp L, Baronnier D, Oropeza D, Gupta S, Miyatsuka T, Kaneto H, Magnuson MA, Osipovich AB, Sander M, Wright CEV, Thomas MK, Furuyama K, Chera S, Herrera PL. Pancreatic islet-autonomous insulin and smoothened-mediated signalling modulate identity changes of glucagon(+) alpha-cells. Nat Cell Biol. 2018;20(11):1267–1277. doi: 10.1038/s41556-018-0216-y. - DOI - PMC - PubMed