. 2022 Jun;71(6):1161-1175.
doi: 10.1136/gutjnl-2021-325288. Epub 2021 Aug 2.

The tumour microenvironment shapes innate lymphoid cells in patients with hepatocellular carcinoma

Affiliations

The tumour microenvironment shapes innate lymphoid cells in patients with hepatocellular carcinoma

Bernd Heinrich et al. Gut. 2022 Jun.

Abstract

Objective: Hepatocellular carcinoma (HCC) represents a typical inflammation-associated cancer. Tissue resident innate lymphoid cells (ILCs) have been suggested to control tumour surveillance. Here, we studied how the local cytokine milieu controls ILCs in HCC.

Design: We performed bulk RNA sequencing of HCC tissue as well as flow cytometry and single-cell RNA sequencing of enriched ILCs from non-tumour liver, margin and tumour core derived from 48 patients with HCC. Simultaneous measurement of protein and RNA expression at the single-cell level (AbSeq) identified precise signatures of ILC subgroups. In vitro culturing of ILCs was used to validate findings from in silico analysis. Analysis of RNA-sequencing data from large HCC cohorts allowed stratification and survival analysis based on transcriptomic signatures.

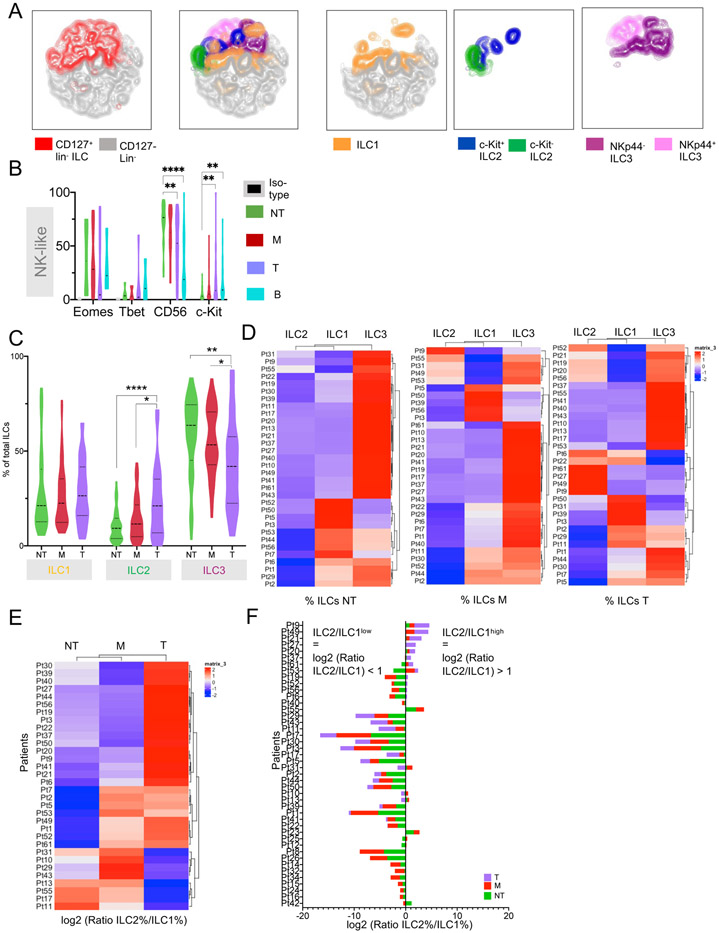
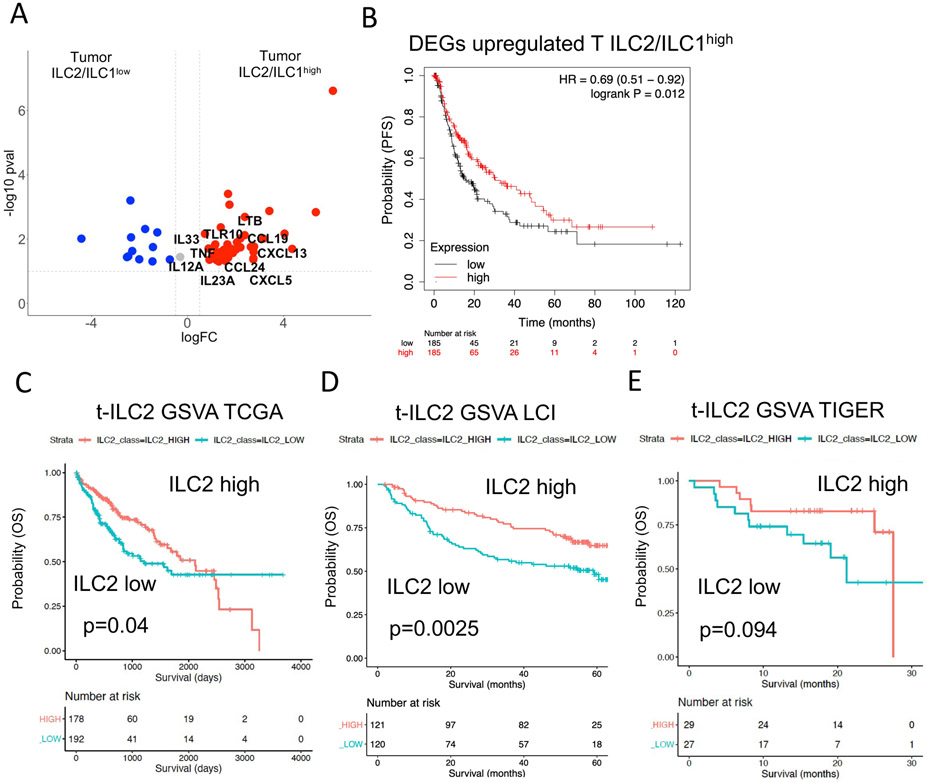
Results: RNA sequencing of tumour, non-tumour and margin identified tumour-dependent gradients, which were associated with poor survival and control of ILC plasticity. Single-cell RNA sequencing and flow cytometry of ILCs from HCC livers identified natural killer (NK)-like cells in the non-tumour tissue, losing their cytotoxic profile as they transitioned into tumour ILC1 and NK-like-ILC3 cells. Tumour ILC composition was mediated by cytokine gradients that directed ILC plasticity towards activated tumour ILC2s. This was liver-specific and not seen in ILCs from peripheral blood mononuclear cells. Patients with high ILC2/ILC1 ratio expressed interleukin-33 in the tumour that promoted ILC2 generation, which was associated with better survival.

Conclusion: Our results suggest that the tumour cytokine milieu controls ILC composition and HCC outcome. Specific changes of cytokines modify ILC composition in the tumour by inducing plasticity and alter ILC function.

Keywords: hepatocellular carcinoma; immune response; immunology; immunoregulation; liver immunology.


Conflict of interest statement

Competing interests: None declared.

Figures

Figure 1:
Figure 1:. Cytokines in the tumor environment of patients with HCC
A. Heatmap showing expression of cytokines, cytokine receptors and growth factors by individual region analyzed by bulk tissue RNA sequencing from liver and tumor tissue of patients with HCC. Cytokine expression data is derived from 59 samples from a total of 25 patients. Matched non-tumor (NT), margin (M) and tumor (T) samples were available from 11 patients, matched NT and M from 11 patients and NT only from 3 patients. B. Multiplex cytokine analysis of supernatants derived from NT (black) or T tissue (red). Cytokine concentration in supernatants harvested from culturing of minced non-tumor or tumor tissue, incubated for 6h and cleared from residual cells. Adjusted for weight of tissue piece. 6 matched NT and T samples with two additional T samples. Bar graphs presenting median with 95% confidence interval. C. Expression of TGFB2 comparing NT, M and T in the HCC cohort. D. Expression of IL33 comparing NT, M and T in the HCC cohort. E. Expression of IL1B comparing NT, M and T in the HCC cohort. F. Survival prediction analysis of TCGA liver cancer cohort using expression of IL33. Patients were split at median.
Figure 2.
Figure 2.. Distribution of ILCs in liver tumor, margin and non-tumor liver tissue in patients with HCC.
A. t-SNE plot of FCM analysis of lin cells merged from NT, M and T of 48 HCC patients. Left: Distribution of CD127+ total ILCs and CD127 cells within all lin cells. Middle: t-SNE plot showing distribution of helper ILC subgroups within total ILCs. Right: Distribution of ILCs split by subgroup. Flow cytometry data is derived from 48 patients. Matched NT, M, T were available from 32 patients, matched NT, M were available from 12 patients, only NT samples were available from 4 patients. B. FCM showing expression of EOMES, Tbet, CD56 and c-Kit (CD117) on CD127 ILCs across all liver regions and PBMCs. C. FCM analysis of ILC groups. Violin plots with frequencies of ILCs by region. N=48 patients. 4 patients only NT and 12 patients with no tumor sample available resulting in NT=48, M=44, T=32 samples. Distribution of matched samples see also Figure 2A. D. Heatmap showing clustering by ILC1, ILC2 and ILC3 frequencies by individual patient and region. E Heatmap showing clustering by log2 (ILC2 frequency (%) / ILC1 frequency (%)) ratio by individual region from individual patients. F. Stacked bar plots showing log2 (ILC2% / ILC1%) ratio in NT, M and T region within individual patients ranked from high to low tumor log2 (ILC2 / ILC1) ratio. All graphs. Where indicated: *p<0.05, **p<0.01, ****p<0.0001. Dotted line = median.
Figure 3.
Figure 3.. Transcriptional signature of ILCs in HCC liver
A. Heatmap showing clustering of ILC2/ILC1 ratio from 6 patients with matched NT, M and T samples used for scRNA-seq. B. Frequency of ILC subgroups within individual patients used for scRNA-seq along different regions of NT, M or T. All samples matched. C. Frequency of Lin, NK-like and total ILCs of live lymphocytes or ILC1, ILC2 and ILC3 within total ILCs of 6 patients used for scRNA-seq. D. Unsupervised clustering and t-SNE analysis of scRNA-seq of lin cells from HCC liver including NT, M and T. t-SNE showing ILC1 (IL7R+, CD6+/−, PTGDR2, KIT) ILC2 (IL7R+, CD6, PTGDR2+, KIT+/−), ILC3 (IL7R+, CD6, PTGDR2, KIT+) and ILCs with multiple marker expression ILC1/2 (IL7R+, CD6+, PTGDR2+, KIT) or ILC1/3 (IL7R+, CD6+, PTGDR2, KIT+). NK-like cells defined as IL7R. Total number of cells=16,515; Il7R+=4,680; IL7R=11,835 E: Violin plots showing expression of main ILC transcripts by clusters. Y-axis = molecules (mols) per cell. F: t-SNE as in 3A showing ILC 12 clusters after unbiased clustering. (defined in Figure 3D). G.-I. Violin plots showing expression of selected transcripts of clusters in 3F. Cutoffs: p<0.05, log2FC>0.58 (=FC>1.5). Y-axis in all violin plots = molecules (mols) per cell G. ILC1-specific transcripts. H. ILC2-specific transcripts. I. ILC3-specific transcripts. J. Selected NK-like-specific transcripts. K. Selected markers of cytotoxicity. L. Bar graphs comparing mean mols per cell of selected transcripts defining NK-like cells between all clusters ranked from high to low expression. M. Violin plot showing DEGs comparing NK-like cells from T vs NT.
Figure 4.
Figure 4.. Transcriptional signature of ILCs in ILC2/ILC1 high and ILC2/ ILC1 low patients
A. t-SNE plot of IL7R+ ILCs from patients 6, 19, 20 and 21, previously identified to have a high ratio of ILC2/ILC1. Unbiased clustering reveals 13 clusters from 2,744 cells. B. Same t-SNE plot of IL7R+ ILCs from patients 6, 19, 20 and 21 colored by ILC subgroups C. Volcano plot showing pairwise comparison of ILC1s (CD6+/−) from ILC2/ILC1 high patients comparing tumor and non-tumor. D. Volcano plot showing pairwise comparison of ILC2s (KIT−/+) from ILC2/ILC1 high patients comparing tumor and non-tumor. E. Volcano plot showing pairwise comparison of ILC3s from ILC2/ILC1 high patients comparing tumor and non-tumor. F. t-SNE plot of IL7R+ ILCs from patients 7 and 10 previously identified to have a low ratio of ILC2/ILC1. Unbiased clustering reveals 11 clusters from 1,936 cells. G. Same t-SNE plot of IL7R+ ILCs from patients 7 and 10 colored by ILC subgroups H. Volcano plot showing pairwise comparison of ILC1s (CD6+/−) from ILC2/ILC1 low patients comparing tumor and non-tumor. I. Volcano plot showing pairwise comparison of ILC2s (KIT−/+) from ILC2/ILC1 low patients comparing tumor and non-tumor. J. Volcano plot showing pairwise comparison of ILC3s from ILC2/ILC1 low patients comparing tumor and non-tumor. Volcano plots in C., D., E., H., I., J. red = number of genes significantly upregulated in T; blue = number of genes significantly upregulated in NT; grey = genes not being significantly different between regions.
Figure 5.
Figure 5.. Trajectory analysis of ILCs reveals ILC2-directed plasticity mediated by tumor cytokines as confirmed by ex-vivo study
A. Trajectory analysis of all lin cells showing distribution of main ILC subgroups along trajectory (subgroups defined in Figure 3D). B. Same trajectory as in 4A now showing distribution of the 12 clusters of ILCs as identified by unbiased clustering in Figure 3F. C-E. Trajectory analysis of lin ILCs from individual regions. Distribution of main ILC groups (defined in Figure 3D) along the trajectory. C. Trajectory of lin cells from NT. D. Trajectory of lin cells from M. E. Trajectory of lin cells from T. F. Trajectory analysis of lin cells from ILC2/ILC1high patients 6, 19, 20 and 21. Distribution of main ILC subgroups along trajectory (subgroups defined in figure 3D). G. Trajectory analysis of lin cells from ILC2/ILC1low patients 10 and 17. Distribution of main ILC subgroups along trajectory (subgroups defined in figure 3D). H. Trajectory analysis of IL7R+ cells from ILC2/ILC1high patients. Distribution of main ILC subgroups along trajectory. I. Trajectory analysis of IL7R+ cells from ILC2/ILC1high patients. Distribution of clusters along trajectory. J. Trajectory analysis of IL7R+ cells from ILC2/ILC1low patients. Distribution of main ILC subgroups along trajectory. K. Trajectory analysis of IL7R+ cells from ILC2/ILC1low patients. Distribution of clusters along trajectory. L. Scheme of ex vivo analysis of influence of supernatant (SN) derived from T or NT tissue on MNCs isolated from matched NT. Same supernatant was initially analyzed for cytokine concentrations as shown in Figure 1B. Representative plot from FCM analysis of ILC subgroups in MNCs after incubation with NT- or T-derived SN (NT-SN or T-SN, respectively) overnight from an ILC2/ILC1 high patient compared to MNCs incubated with media only. M. Ex vivo analysis of ILCs upon incubation with supernatant. ILCs were isolated from NT and incubated overnight with non-tumor supernatant (NT-SN), tumor supernatant (T-SN) or media only. FCM analysis of incubated cells. Bar graphs showing frequency of ILC subgroups. Ex vivo experiments repeated from liver samples of selected HCC patients with increase in tumor ILC2s. (#Media only= 8, #NT-SN=6 due to limited tissue availability, #T-SN=8).
Figure 6.
Figure 6.. Survival analysis using large HCC cohorts reveals better survival in patients with high tumor ILC2 signature mediated by IL-33
A. Volcano plot showing DEGs from comparison of bulk RNA sequencing data from tumors of ILC2/ILC1high vs tumors of ILC2/ILC1low patients filtered for cytokines, cytokine receptors and growth factors. B. Survival risk prediction using significantly upregulated DEGs (p<0.05, logFC>0.58) in tumors of ILC2/ILC1high patients. Progression-free survival (PFS) risk probability based on high or low expression in TCGA liver cancer cohort split by median. C. Geneset variance analysis (GSVA) using a signature of tumor c-Kit ILC2s derived from single-cell sequencing analysis (Table S6). Analysis of survival prediction within TCGA liver cancer cohort. D. Same analysis as in Figure 6C, now analyzing patients of the LCI liver cancer cohort. E. Same analysis as in Figure 6C, now analyzing patients of the TIGER liver cancer cohort.

Comment in

References

    1. Budhu A, Wang XW. The role of cytokines in hepatocellular carcinoma. Journal of leukocyte biology 2006;80:1197–213. - PubMed
    1. Hou J, Zhang H, Sun B, Karin M. The immunobiology of hepatocellular carcinoma in humans and mice: Basic concepts and therapeutic implications. Journal of hepatology 2020;72:167–82. - PubMed
    1. Vivier E, Artis D, Colonna M, Diefenbach A, Di Santo JP, Eberl G, et al. Innate lymphoid cells: 10 years on. Cell 2018;174:1054–66. - PubMed
    1. Liu M, Zhang C. The role of innate lymphoid cells in immune-mediated liver diseases. Front Immunol 2017;8:695. - PMC - PubMed
    1. Forkel M, Berglin L, Kekalainen E, Carlsson A, Svedin E, Michaelsson J, et al. Composition and functionality of the intrahepatic innate lymphoid cell-compartment in human nonfibrotic and fibrotic livers. European journal of immunology 2017;47:1280–94. - PubMed