. 2021 Aug 10;118(32):e2102813118.
doi: 10.1073/pnas.2102813118.

Molecular basis for lipid recognition by the prostaglandin D2 receptor CRTH2

Affiliations

Molecular basis for lipid recognition by the prostaglandin D2 receptor CRTH2

Heng Liu et al. Proc Natl Acad Sci U S A. .

Abstract

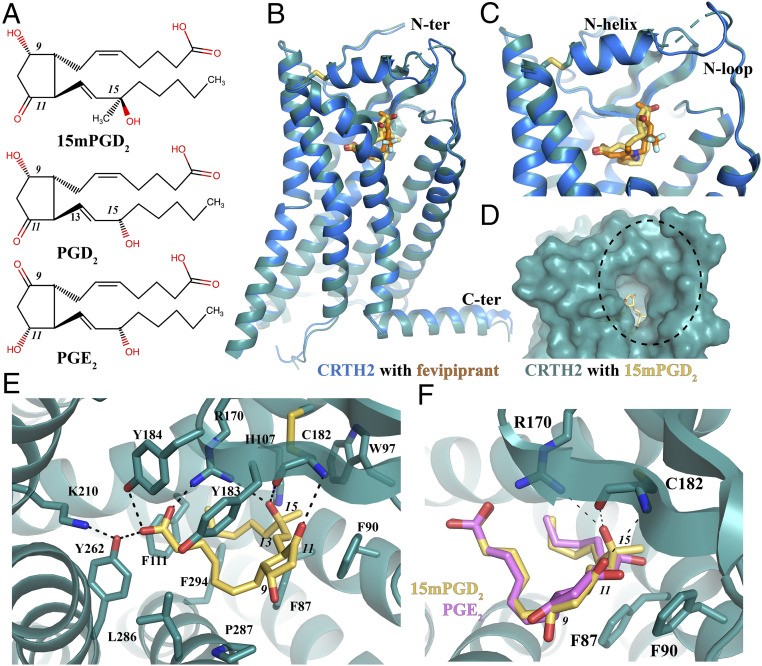
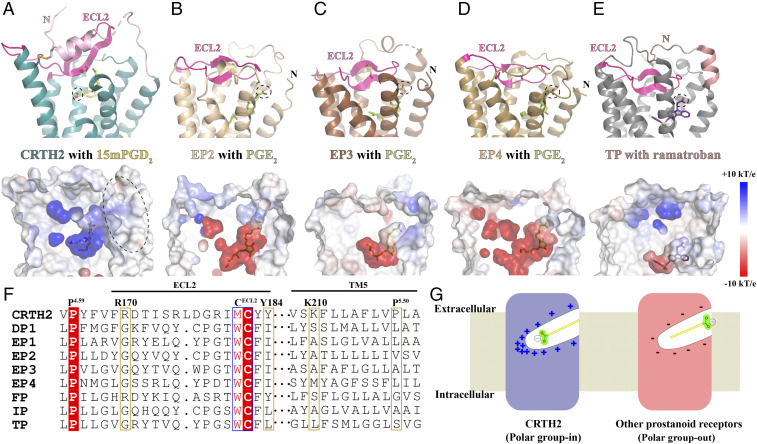
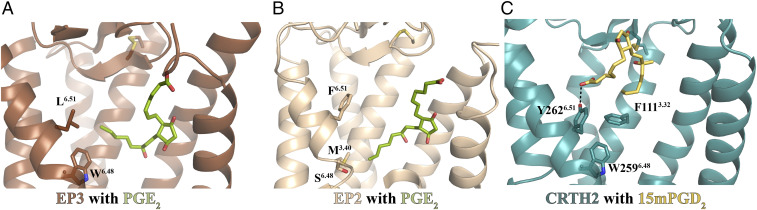
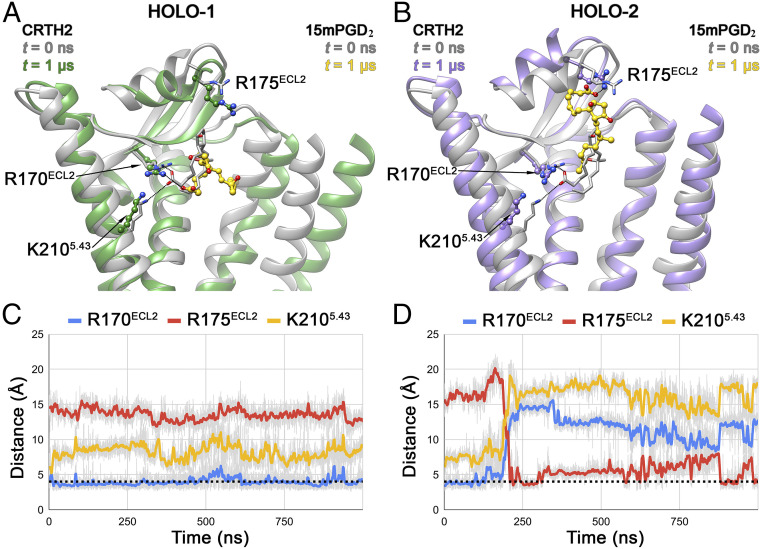
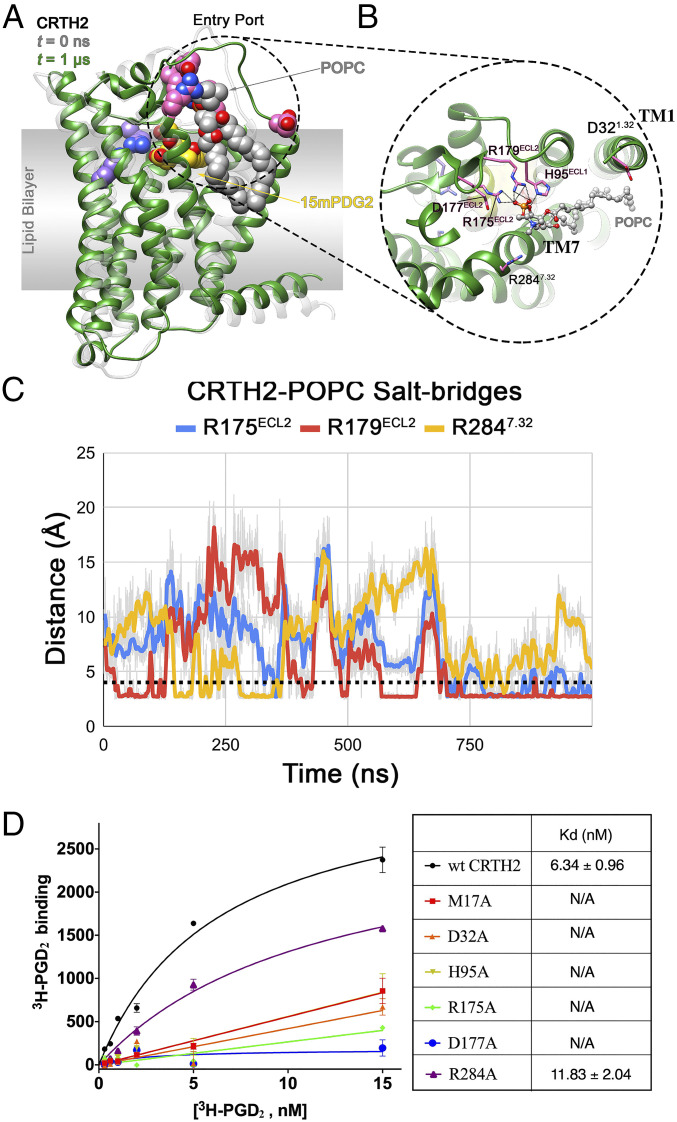
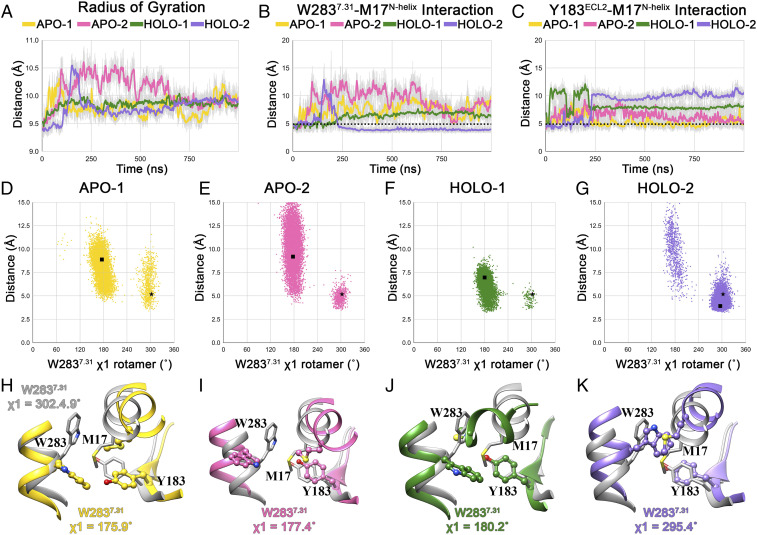
Prostaglandin D2 (PGD2) signals through the G protein-coupled receptor (GPCR) CRTH2 to mediate various inflammatory responses. CRTH2 is the only member of the prostanoid receptor family that is phylogenetically distant from others, implying a nonconserved mechanism of lipid action on CRTH2. Here, we report a crystal structure of human CRTH2 bound to a PGD2 derivative, 15R-methyl-PGD2 (15mPGD2), by serial femtosecond crystallography. The structure revealed a "polar group in"-binding mode of 15mPGD2 contrasting the "polar group out"-binding mode of PGE2 in its receptor EP3. Structural comparison analysis suggested that these two lipid-binding modes, associated with distinct charge distributions of ligand-binding pockets, may apply to other lipid GPCRs. Molecular dynamics simulations together with mutagenesis studies also identified charged residues at the ligand entry port that function to capture lipid ligands of CRTH2 from the lipid bilayer. Together, our studies suggest critical roles of charge environment in lipid recognition by GPCRs.

Keywords: CRTH2 (DP2); MD simulations; crystal structure; lipid binding; prostaglandin D2.


Conflict of interest statement

The authors declare no competing interest.

Figures

Fig. 1.
Fig. 1.
Overall structure of CRTH2 bound to 15mPGD2 and its ligand-binding pocket. (A) Chemical structures of 15mPGD2, PGD2, and PGE2. C-9, C-11, and C-15 positions are indicated with italic numbers. (B) Overall structure of CRTH2 bound to 15mPGD2 and structure alignment with CRTH2 bound to fevipiprant. (C) Overlapping, binding positions of 15mPGD2 and fevipiprant. (D) Potential lipid entry port. (E) Binding pocket of 15mPGD2. (F) Docking of PGE2 (pink) into the 15mPGD2- (yellow) binding pocket. Hydrogen bonds are shown as dashed lines.
Fig. 2.
Fig. 2.
Structural comparison analysis. (A) CRTH2 with 15mPGD2. The N-terminal region preceding TM1 is colored in light pink. (BD) EP2, EP3, and EP4 with PGE2 (Protein Data Bank [PDB] IDs: 7CX2, 6AK3, and 7D7M, respectively). (E) TP with ramatroban (PDB ID: 6IIU). The N-terminal region preceding TM1 is colored in salmon. ECL2 in each receptor is colored in magenta. 15mPGD2, PGE2, and ramatroban are colored in yellow, green, and purple, respectively. The carboxyl group in each ligand is circled. The charge distributions of ligand-binding pockets of these prostanoid receptors are shown in the lower panels. (F) Sequence alignment of all prostanoid receptors. The alignment of ECL2 sequences was based on the alignments of two highly conserved residues, P4.50 and the cysteine residue, in ECL2, forming the conserved extracellular disulfide bond. The alignment of TM5 sequences was based on the alignment of 5.50 residues in the receptors. (G) Two lipid-binding modes.
Fig. 3.
Fig. 3.
PGE2 and PGD2 interact with different sets of residues to activate their receptors. (A) EP3 (brown) with PGE2 (green) (PDB ID: 6AK3). (B) EP2 (light brown) with PGE2 (green) (PDB ID: 7CX2). The ω-chain of PGE2 extends below the 6.51 residue to interact with W2956.48 in EP3 or M1243.40 in EP2. (C) CRTH2 (cyan) with 15mPGD2 (yellow). PGD2 binds to a superficial binding pocket in CRTH2 so that the ω-chain of PGD2 is above the residue Y6.51. The hydrogen bond is shown as a black dashed line.
Fig. 4.
Fig. 4.
Conformational dynamics of 15mPGD2 in CRTH2 holo-1 and holo-2 systems. The CRTH2 structures at t = 0 ns (translucent gray ribbon) are superposed with structures at t = 1 µs in holo-1 (A) (translucent green ribbon) and t = 1 µs in holo-2 (B) (translucent purple ribbon). In both panels, conformations of bound 15mPGD2 at t = 0 ns (translucent gray) and t = 1 µs (gold) are shown in stick and ball-and-stick representation, respectively. Salt–bridge interactions formed by the carboxyl group of 15mPGD2 with R170ECL2, R175ECL2, and K2105.42 are shown as black dotted lines in A and B. Evolution of the salt bridges during the 1-µs simulation in holo-1 (C) and holo-2 (D) systems are presented as blue, red, and yellow lines (50-point moving average) corresponding to 15mPGD2-R170ECL2, 15mPGD2-R175ECL2, and 15mPGD2-K2105.42 interactions, respectively, with the dotted black line indicating the cutoff distance of 4.0 Å.
Fig. 5.
Fig. 5.
CRTH2–POPC interaction in holo-1 simulation and mutagenesis data. (A) Interaction of a bilayer POPC molecule, with the residues lining the entry port in holo-1 simulation. The structures of the receptor at t = 0 ns (translucent gray) and t = 1 μs (green) are shown in ribbon representation. The entry port residues (pink), bound 15mPGD2 (yellow), POPC (gray), and binding site residues R170ECL2 and K2105.42 (purple) are shown in sphere representation. (B) Close up of the CRTH2 entry port–POPC interaction, with the bound POPC (gray) and entry port residues (pink) shown in ball-and-stick and stick representation, respectively. The interactions between the POPC and the protein residues are shown as black dotted lines. (C) Evolution of CRTH2–POPC intermolecular salt bridges during the 1-µs holo-1 simulation, with the dotted black line indicating the cutoff distance of 4.0 Å. (D) Saturation-binding assays on different CRTH2 constructs using 3H-PGD2. All CRTH2 constructs were transiently expressed in human embryonic kidney 293 cells, and cell membranes were prepared and used in the ligand-binding assays. Expression of each construct was confirmed by cell surface staining. Nonspecific binding measured in the presence of access amount of PGD2 was subtracted. The dissociation equilibrium constants (Kds) of PGD2 for the wtCRTH2 and the R284A mutant are listed in the table shown on the right of panel D. For other CRTH2 mutants, no saturable 3H-PGD2 binding was observed, indicating mostly nonspecific binding. Each data point in the left panel is shown as mean ± SEM and n = 3.
Fig. 6.
Fig. 6.
Conformational dynamics of the ligand-binding pocket in MD simulations. (A) Evolution of radius of gyration (50-point moving average) of the binding site residues in 1-µs trajectories. Evolution of S-π–type W2837.31–M17N-helix (B) and Y183ECL2–M17N-helix (C) interactions in 1-µs trajectories. Scatter plot showing distribution of W2837.31 (ring centroid)–M17N-helix (S-atom) distances and W2837.31 χ1 rotamer angles in W2837.31 apo-1 (D), apo-2 (E), holo-1 (F), and holo-2 (G) trajectories. Structures with W2837.31 χ1 rotamer angle equal to the average W2837.31 χ1 rotamer angle in the last 500 ns of the simulation are selected as representatives from each trajectory. The distance and χ1 rotamer angle corresponding to the crystal structure and representative structure from each simulation are shown using a black star and square in the scatter plots. Organization of the W2837.31–M17N-helix–Y183ECL2 bridge motif in representative structures, along with their W2837.31 χ1 rotamer angle, from apo-1 (H) (yellow), apo-2 (I) (pink), holo-1 (J) (green), and holo-2 (K) (purple) trajectories. The bridge motif from the crystal structure (gray) is also shown superposed to the representative structure.

Similar articles

Cited by

References

    1. Boyce J. A., Eicosanoids in asthma, allergic inflammation, and host defense. Curr. Mol. Med. 8, 335–349 (2008). - PubMed
    1. Harizi H., Corcuff J.-B., Gualde N., Arachidonic-acid-derived eicosanoids: Roles in biology and immunopathology. Trends Mol. Med. 14, 461–469 (2008). - PubMed
    1. Funk C. D., Prostaglandins and leukotrienes: Advances in eicosanoid biology. Science 294, 1871–1875 (2001). - PubMed
    1. Bäck M., et al. ., International Union of Basic and Clinical Pharmacology. LXXXIV: Leukotriene receptor nomenclature, distribution, and pathophysiological functions. Pharmacol. Rev. 63, 539–584 (2011). - PubMed
    1. Woodward D. F., Jones R. L., Narumiya S., International Union of Basic and Clinical Pharmacology. LXXXIII: Classification of prostanoid receptors, updating 15 years of progress. Pharmacol. Rev. 63, 471–538 (2011). - PubMed

Publication types

MeSH terms