. 2021 Aug 10;118(32):e2107588118.
doi: 10.1073/pnas.2107588118.

Microscopic origins of the crystallographically preferred growth in evaporation-induced colloidal crystals

Affiliations

Microscopic origins of the crystallographically preferred growth in evaporation-induced colloidal crystals

Ling Li et al. Proc Natl Acad Sci U S A. .

Abstract

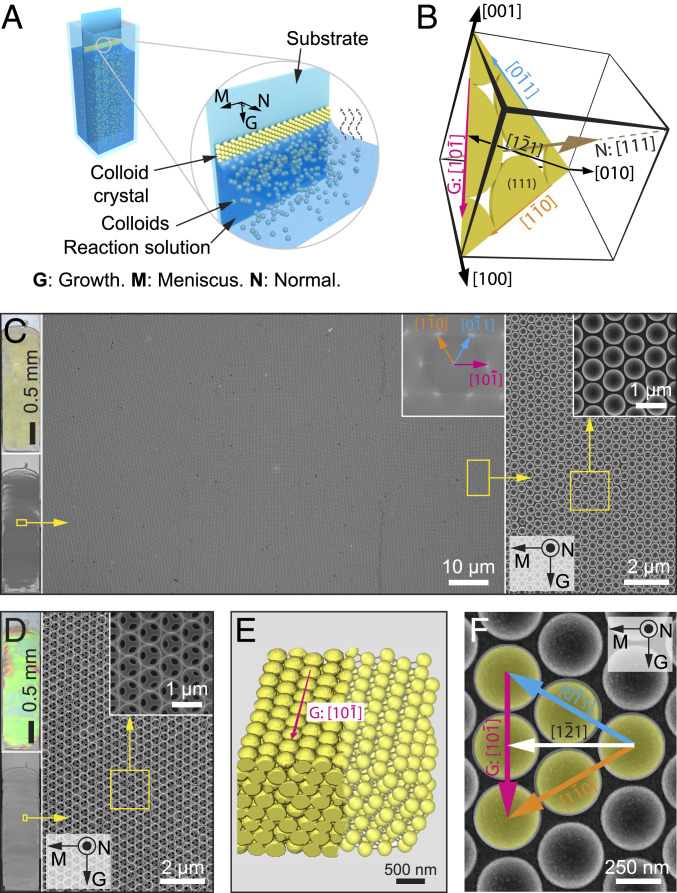
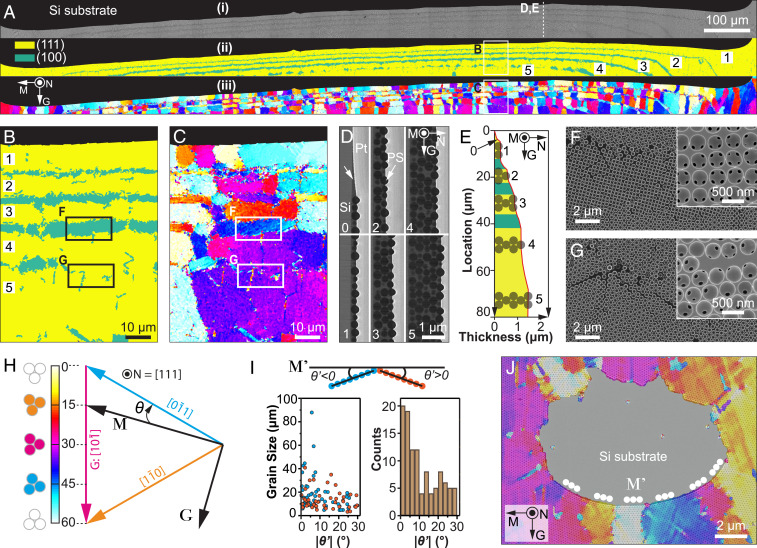
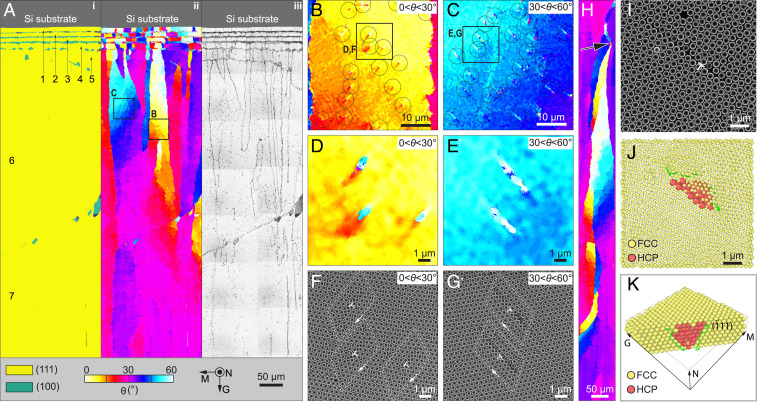
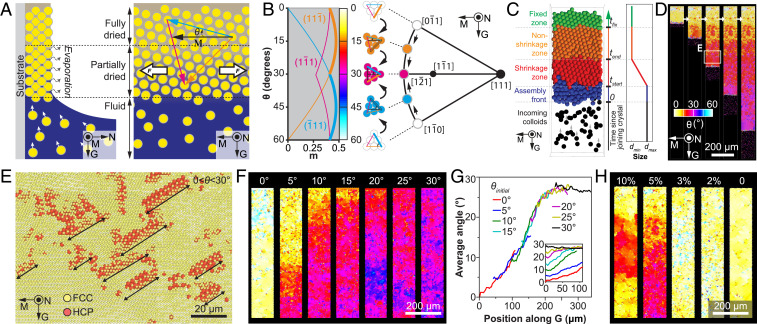
Unlike crystalline atomic and ionic solids, texture development due to crystallographically preferred growth in colloidal crystals is less studied. Here we investigate the underlying mechanisms of the texture evolution in an evaporation-induced colloidal assembly process through experiments, modeling, and theoretical analysis. In this widely used approach to obtain large-area colloidal crystals, the colloidal particles are driven to the meniscus via the evaporation of a solvent or matrix precursor solution where they close-pack to form a face-centered cubic colloidal assembly. Via two-dimensional large-area crystallographic mapping, we show that the initial crystal orientation is dominated by the interaction of particles with the meniscus, resulting in the expected coalignment of the close-packed direction with the local meniscus geometry. By combining with crystal structure analysis at a single-particle level, we further reveal that, at the later stage of self-assembly, however, the colloidal crystal undergoes a gradual rotation facilitated by geometrically necessary dislocations (GNDs) and achieves a large-area uniform crystallographic orientation with the close-packed direction perpendicular to the meniscus and parallel to the growth direction. Classical slip analysis, finite element-based mechanical simulation, computational colloidal assembly modeling, and continuum theory unequivocally show that these GNDs result from the tensile stress field along the meniscus direction due to the constrained shrinkage of the colloidal crystal during drying. The generation of GNDs with specific slip systems within individual grains leads to crystallographic rotation to accommodate the mechanical stress. The mechanistic understanding reported here can be utilized to control crystallographic features of colloidal assemblies, and may provide further insights into crystallographically preferred growth in synthetic, biological, and geological crystals.

Keywords: colloids; crystallographic texture; geometrically necessary dislocations; residual stress; self-assembly.


Conflict of interest statement

The authors declare no competing interest.

Figures

Fig. 1.
Fig. 1.
Evaporation-induced coassembly of colloidal crystals. (A) Schematic diagram of the evaporation-induced colloidal coassembly process. “G”, “M”, and “N” refer to “growth,” “meniscus,” and “normal” directions, respectively. The reaction solution contains silica matrix precursor (tetraethyl orthosilicate, TEOS) in addition to colloids. (B) Schematic diagram of the crystallographic system and orientations used in this work. (C and D) Optical image (Top Left) and scanning electron micrograph (SEM) (Bottom Left) of a typical large-area colloidal crystal film before (C) and after (D) calcination. (Right) SEM images of select areas (yellow rectangles) at different magnifications. Corresponding fast-Fourier transform (see Inset in Middle in C) shows the single-crystalline nature of the assembled structure. (E) The 3D reconstruction of the colloidal crystal (left) based on FIB tomography data and (right) after particle detection. (F) Top-view SEM image of the colloidal crystal with crystallographic orientations indicated.
Fig. 2.
Fig. 2.
Morphological and crystallographic analysis of the initiation region. (A) (i) Original SEM image, (ii) corresponding lattice type map, and (iii) orientation map of a typical initiation region. The number of layers in the colloidal crystal gradually increases from one to five, as indicated in ii. (B and C) High-magnification maps of (B) lattice type and (C) orientation for a representative region indicated in A. (D) SEM images of FIB-milled cross-sections, demonstrating regions with a different number of layers: 0, submonolayer; 1, one layer; 2, two layers; etc. (E) The thickness profile of the colloidal crystal at the initiation region. (F) Transition zone from three-layer to four-layer region, demonstrating that the lattice type changes from a hexagonal to square to hexagonal packing. (G) Transition zone from four-layer to five-layer region, demonstrating that the crystal orientation is maintained. Insets in F and G show the corresponding structure after calcination. The regions of F and G were taken from B and C as indicated. (H) The color scheme used in orientation maps. The crystal angle, θ, is defined as the angle between the top left−bottom right−oriented [110] direction (i.e., [01¯1] direction) and the global meniscus direction (M). (I) (Top) The local crystal misorientation angle, θ′, is defined as the angle between the local meniscus orientation (M′) and the nearest close-packed orientation, and the positive and negative signs are assigned according to the schematic diagram. (Bottom) The distribution of grain sizes and local crystal misorientation (θ′) based on statistical analysis of the orientation map shown in A. (J) An overlay of an original SEM image and orientation map shows an extreme example of a defect region with highly curved meniscus orientations, which are always aligned with the close-packed orientations locally (i.e., θ′ ≈ 0°). All orientation maps are based on the same color scheme, shown in H. All images except D and E were in the same sample orientation as in A.
Fig. 3.
Fig. 3.
Evolution of crystallographic orientation during growth. (A) Large-area maps of (i) lattice type, (ii) corresponding orientation, and (iii) defects, demonstrating gradual rotation of crystallographic orientation along the growth direction. The number of layers is indicated, and a maximum of seven layers is observed at the lower portion of this region. (B and C) Enlarged orientation maps with local crystal orientation in the range of (B) 0° < θ < 30° and (C) 30° < θ < 60°, which are acquired in the regions as indicated in A. The circles highlight individual defects. (D and E) High-magnification of orientation map and (F and G) corresponding original SEM images showing the individual defects, which are acquired in the regions as indicated in B and C. In F and G, the dislocation cores are indicated by ; the white loops indicate Burgers circuits. (H) Orientation map acquired in a region where the preferred <110> growth has been achieved, showing a self-correction behavior. The crystallographic orientation rotates back to θ = 30° after a defect causes crystallographic misorientations (arrow). (I) Top-view SEM image of a region with a dislocation (indicated by ) selected for tomography analysis. (J) Top-view reconstruction of the same region. The red particles represent a stacking fault within the fcc lattice, which is represented with a smaller particle radius for ease of viewing. (K) Crystal reconstruction in a perspective view with front particles removed. All the orientation, phase, defect map, and SEM images are in the same orientation and color scheme as in A.
Fig. 4.
Fig. 4.
Mechanism of crystallographically preferred growth. (A) Schematic diagram of the evaporation and associated self-assembly process. A horizontal (i.e., along meniscus direction) tensile stress is generated during the drying process of the colloidal assemblies. (B) (Left) Determination of Schmid factor, m, as a function of colloidal crystal orientation, θ. Here only the three slip directions with the highest m values for the three close-packed planes ((111¯), (11¯1), and (1¯11)) are displayed. (Right) A (111) stereographic projection showing the gradual crystal rotation toward the [101¯] growth. (CH) Results of the colloidal self-assembly modeling approach: (C) (Left) Schematic diagram of the evaporation-induced colloidal assembly modeling. (Right) The particle size profile used in the simulations; tstart and tend specify the time range over which the particle size reduces from dmax to dmin; tfix is the time when the particle becomes fixed. (D) A representative simulation result showing the gradual crystallographic rotation. (E) Detection of stacking faults due to the generation of dislocations at the growth front. The location of this volume is highlighted in D. (F) Effects of initial crystal orientation, θinitial = 0°, 5°, 10°, 15°, 20°, 25°, and 30°. (G) Profile of average crystal angles along the growth direction, G. (H) Effects of particle shrinkage, s = 1 – dmin/dmax = 10%, 5%, 3%, 2%, and 0%.

References

    1. Manoharan V. N., COLLOIDS. Colloidal matter: Packing, geometry, and entropy. Science 349, 1253751 (2015). - PubMed
    1. Vlasov Y. A., Bo X.-Z., Sturm J. C., Norris D. J., On-chip natural assembly of silicon photonic bandgap crystals. Nature 414, 289–293 (2001). - PubMed
    1. Hatton B., Mishchenko L., Davis S., Sandhage K. H., Aizenberg J., Assembly of large-area, highly ordered, crack-free inverse opal films. Proc. Natl. Acad. Sci. U.S.A. 107, 10354–10359 (2010). - PMC - PubMed
    1. Vogel N., Retsch M., Fustin C.-A., Del Campo A., Jonas U., Advances in colloidal assembly: The design of structure and hierarchy in two and three dimensions. Chem. Rev. 115, 6265–6311 (2015). - PubMed
    1. Phillips K. R., et al. ., A colloidoscope of colloid-based porous materials and their uses. Chem. Soc. Rev. 45, 281–322 (2016). - PubMed

Publication types

LinkOut - more resources