. 2021 Aug 10;118(32):e2100970118.
doi: 10.1073/pnas.2100970118.

Pairing facts with imagined consequences improves pandemic-related risk perception

Affiliations

Pairing facts with imagined consequences improves pandemic-related risk perception

Alyssa H Sinclair et al. Proc Natl Acad Sci U S A. .

Abstract

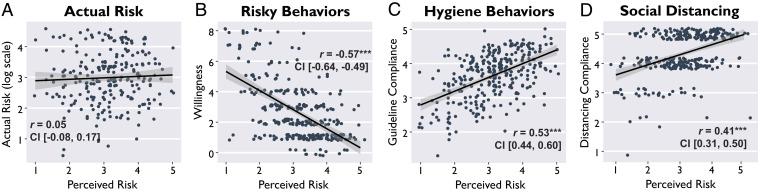
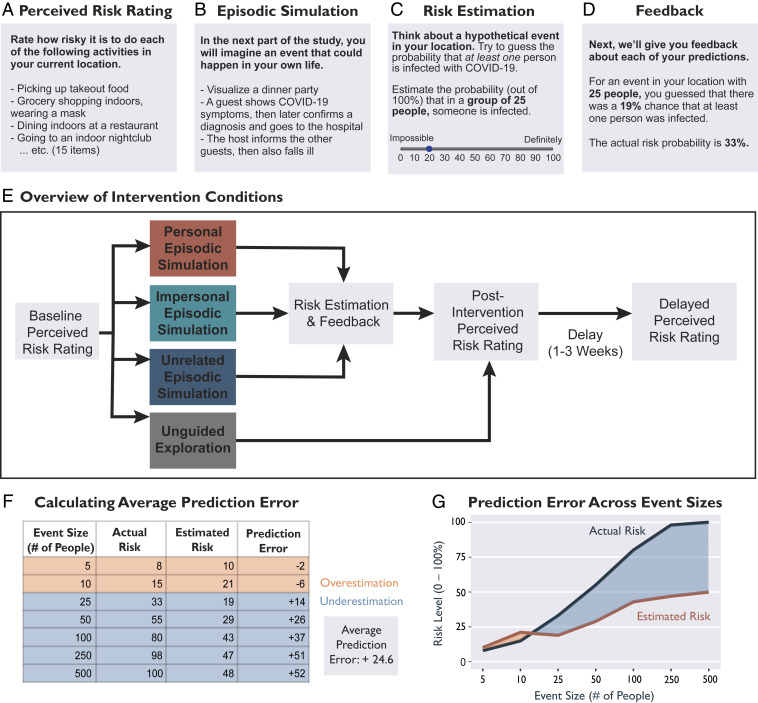
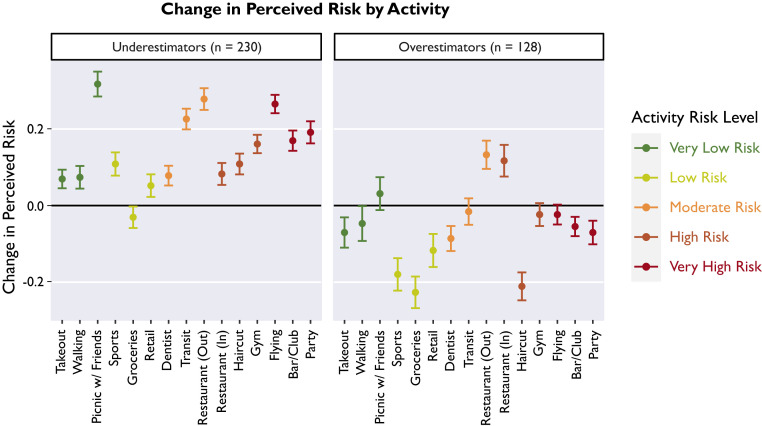
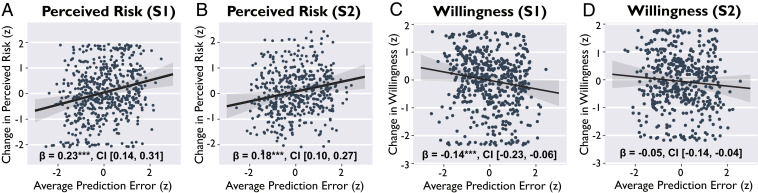
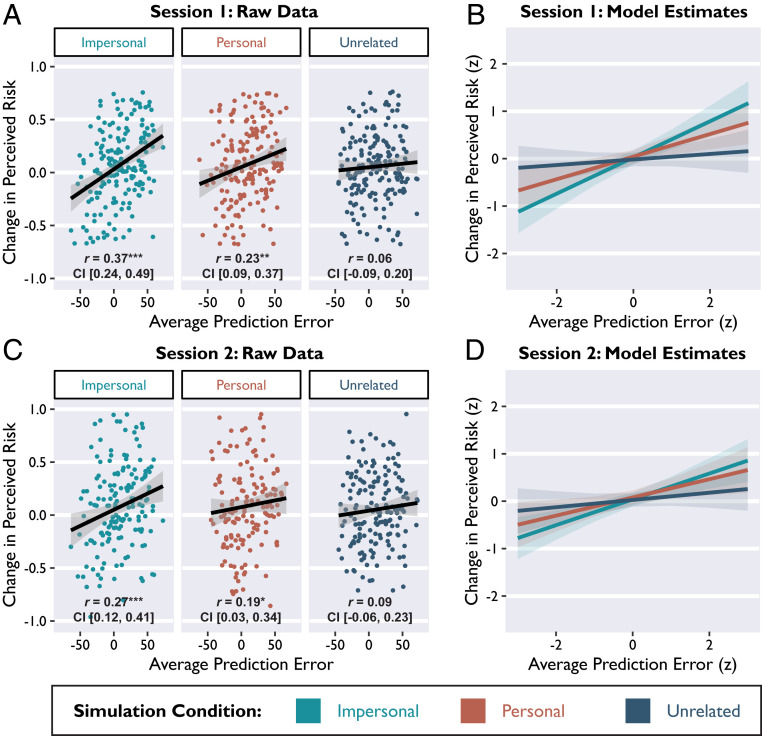
The COVID-19 pandemic reached staggering new peaks during a global resurgence more than a year after the crisis began. Although public health guidelines initially helped to slow the spread of disease, widespread pandemic fatigue and prolonged harm to financial stability and mental well-being contributed to this resurgence. In the late stage of the pandemic, it became clear that new interventions were needed to support long-term behavior change. Here, we examined subjective perceived risk about COVID-19 and the relationship between perceived risk and engagement in risky behaviors. In study 1 (n = 303), we found that subjective perceived risk was likely inaccurate but predicted compliance with public health guidelines. In study 2 (n = 735), we developed a multifaceted intervention designed to realign perceived risk with actual risk. Participants completed an episodic simulation task; we expected that imagining a COVID-related scenario would increase the salience of risk information and enhance behavior change. Immediately following the episodic simulation, participants completed a risk estimation task with individualized feedback about local viral prevalence. We found that information prediction error, a measure of surprise, drove beneficial change in perceived risk and willingness to engage in risky activities. Imagining a COVID-related scenario beforehand enhanced the effect of prediction error on learning. Importantly, our intervention produced lasting effects that persisted after a 1- to 3-wk delay. Overall, we describe a fast and feasible online intervention that effectively changed beliefs and intentions about risky behaviors.

Keywords: COVID-19; cognition; intervention; psychology; risk.


Conflict of interest statement

The authors declare no competing interest.

Figures

Fig. 1.
Fig. 1.
Perceived risk was not aligned with actual risk, but perceived risk predicted compliance with public health guidelines. In study 1, we found the following: (A) Perceived risk of engaging in various everyday activities was not correlated with actual risk based on COVID-19 prevalence. (B) Perceived risk was negatively associated with willingness to engage in risky activities and was positively associated with (C) compliance with hygiene guidelines and (D) compliance with social/physical distancing guidelines. Points are minimally jittered for visualization, in order to display all data without overlapping points. Shaded bands indicate 95% confidence intervals around the regression line. ***P < 0.001.
Fig. 2.
Fig. 2.
Overview of the intervention approach used in study 2. (A) The perceived risk rating was an assessment of subjective perceived risk of 15 activities and willingness to engage in those activities. Participants completed the perceived risk rating preintervention, immediately postintervention, and 1 to 3 wk postintervention. (B) During the episodic simulation task, participants were guided through an imagination exercise and typed responses. (C) During the risk estimation task, participants estimated exposure risk probabilities (based on the prevalence of COVID-19 cases) for seven hypothetical event sizes (ranging from 5 to 500 people) in their location. (D) After estimating the risk for each event size, participants received feedback about the actual exposure risk probabilities. (E) Overview of the four intervention conditions and the order in which participants completed tasks. (F) Table demonstrating the calculation of average prediction error, using responses from the risk estimation task for one example participant. (G) Visualization of the values provided in F.
Fig. 3.
Fig. 3.
Change in perceived risk by activity. Points depict the average within-subjects change in perceived risk for each of the 15 everyday activities assessed. Activities are color coded according to approximate risk level (89). Participants who had been underestimating risk (average prediction error ≥15) reported increases in perceived risk (Left), whereas participants who had been overestimating risk (average prediction error ≤ −15) reported decreases in perceived risk (Right). Error bars indicate 95% confidence intervals around the mean. Black line indicates zero, no change from the preintervention baseline.
Fig. 4.
Fig. 4.
Prediction error influenced perceived risk and willingness to engage in potentially risky everyday activities. Prediction error was positively associated with change in perceived risk both immediately postintervention (A) and after a delay (B). Prediction error was negatively associated with change in willingness to engage in risky activities immediately postintervention (C), but not after a delay (D). Points depict average scores from individual subjects (standardized units). Lines depict slope estimates for the main effect of prediction error, derived from multiple regression models that also account for variance that can be attributed to the intervention condition and delay between sessions. S1 = session 1; S2 = session 2. Shaded bands indicate 95% confidence intervals around the regression line. ***P < 0.001.
Fig. 5.
Fig. 5.
Relevant episodic simulations enhance the effect of prediction error on perceived risk. Prediction error from the risk estimation task was significantly positively associated with change in perceived risk in the impersonal and personal conditions (imagining a COVID-related scenario), but not the unrelated condition. (A and B) Session 1 results and (C and D) session 2 results. (A and C depict all raw data points with original units, subset by simulation condition. (B and D) Slope estimates derived from multiple regression models (standardized units), overlaid for comparison. Shaded bands indicate 95% confidence intervals around the regression lines. *P < 0.05, **P < 0.01, ***P < 0.001.

References

    1. Choi K. R., Heilemann M. V., Fauer A., Mead M., A second pandemic: Mental health spillover from the novel coronavirus (COVID-19). J. Am. Psychiatr. Nurses Assoc. 26, 340–343 (2020). - PubMed
    1. Fitzpatrick K. M., Drawve G., Harris C., Facing new fears during the COVID-19 pandemic: The State of America’s mental health. J. Anxiety Disord. 75, 102291 (2020). - PMC - PubMed
    1. Fofana N. K., et al. ., Fear and agony of the pandemic leading to stress and mental illness: An emerging crisis in the novel coronavirus (COVID-19) outbreak. Psychiatry Res. 291, 113230 (2020). - PMC - PubMed
    1. Lenzen M., et al. ., Global socio-economic losses and environmental gains from the Coronavirus pandemic. PLoS One 15, e0235654 (2020). - PMC - PubMed
    1. Nicola M., et al. ., The socio-economic implications of the coronavirus pandemic (COVID-19): A review. Int. J. Surg. 78, 185–193 (2020). - PMC - PubMed

Publication types