. 2021 Aug;9(8):e002332.
doi: 10.1136/jitc-2021-002332.

Anticoagulation therapy promotes the tumor immune-microenvironment and potentiates the efficacy of immunotherapy by alleviating hypoxia

Affiliations

Anticoagulation therapy promotes the tumor immune-microenvironment and potentiates the efficacy of immunotherapy by alleviating hypoxia

Jeong Uk Choi et al. J Immunother Cancer. 2021 Aug.

Abstract

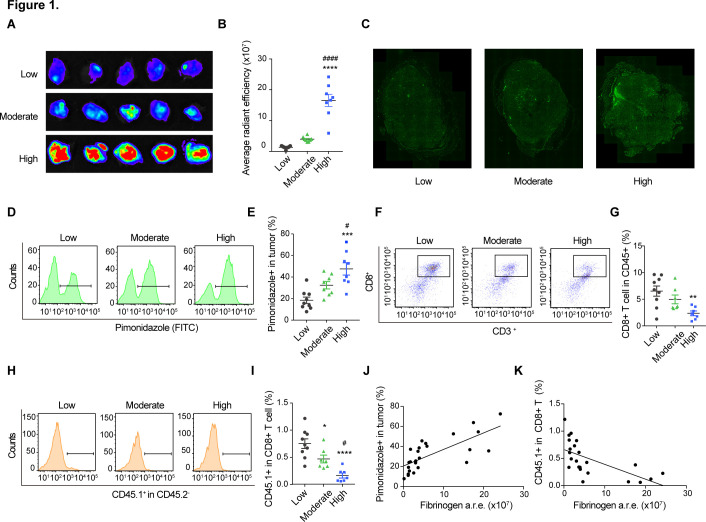
Purpose: Here, this study verifies that cancer-associated thrombosis (CAT) accelerates hypoxia, which is detrimental to the tumor immune microenvironment by limiting tumor perfusion. Therefore, we designed an oral anticoagulant therapy to improve the immunosuppressive tumor microenvironment and potentiate the efficacy of immunotherapy by alleviating tumor hypoxia.

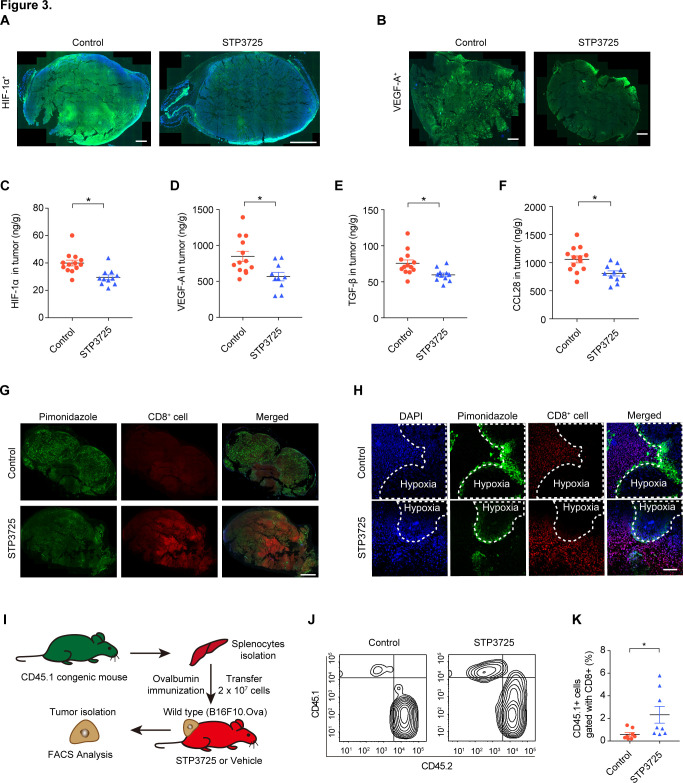
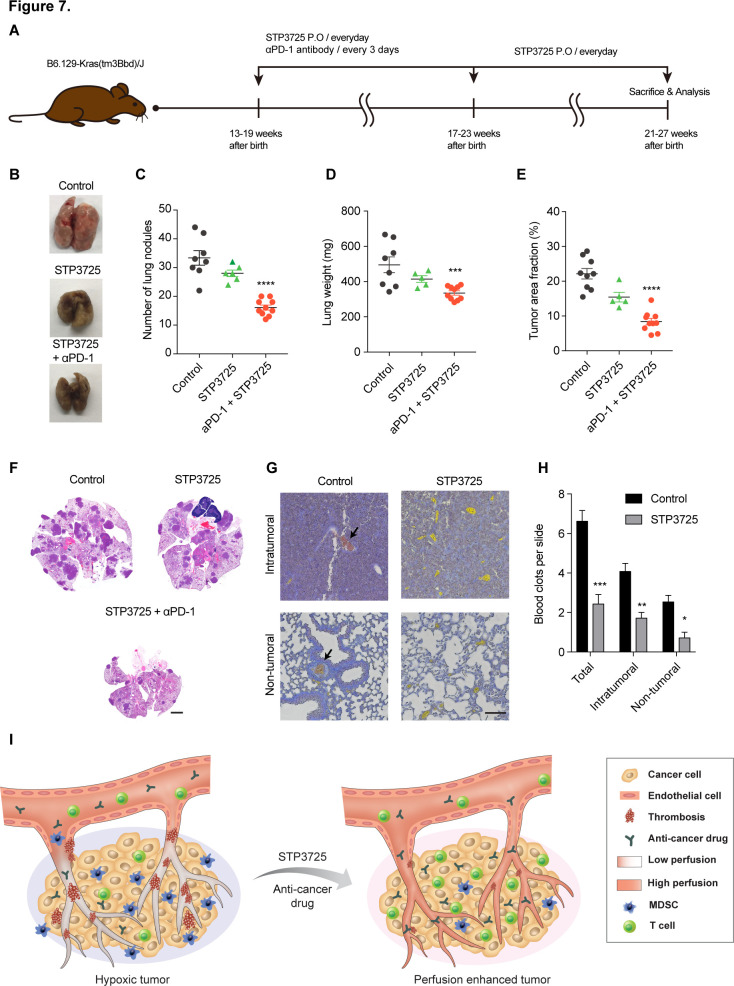
Experimental design: A novel oral anticoagulant (STP3725) was developed to consistently prevent CAT formation. Tumor perfusion and hypoxia were analyzed with or without treating STP3725 in wild-type and P selectin knockout mice. Immunosuppressive cytokines and cells were analyzed to evaluate the alteration of the tumor microenvironment. Effector lymphocyte infiltration in tumor tissue was assessed by congenic CD45.1 mouse lymphocyte transfer model with or without anticoagulant therapy. Finally, various tumor models including K-Ras mutant spontaneous cancer model were employed to validate the role of the anticoagulation therapy in enhancing the efficacy of immunotherapy.

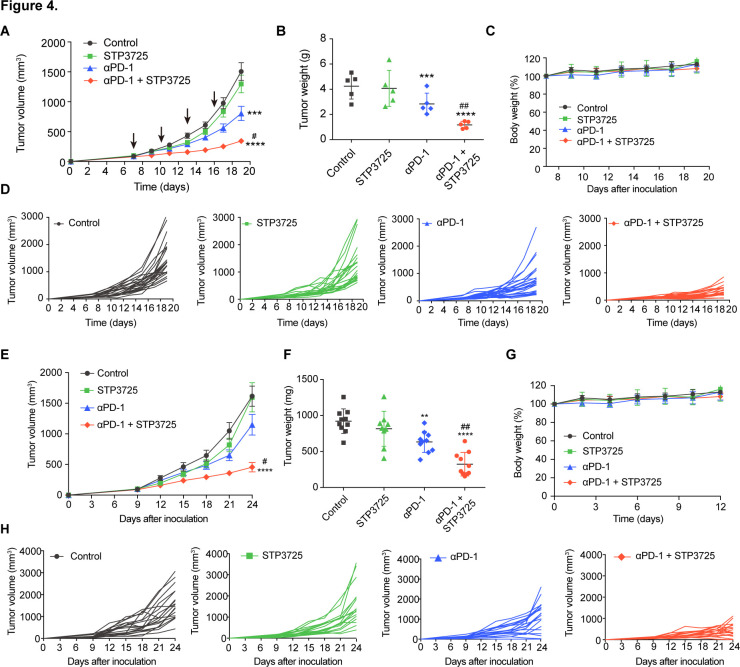
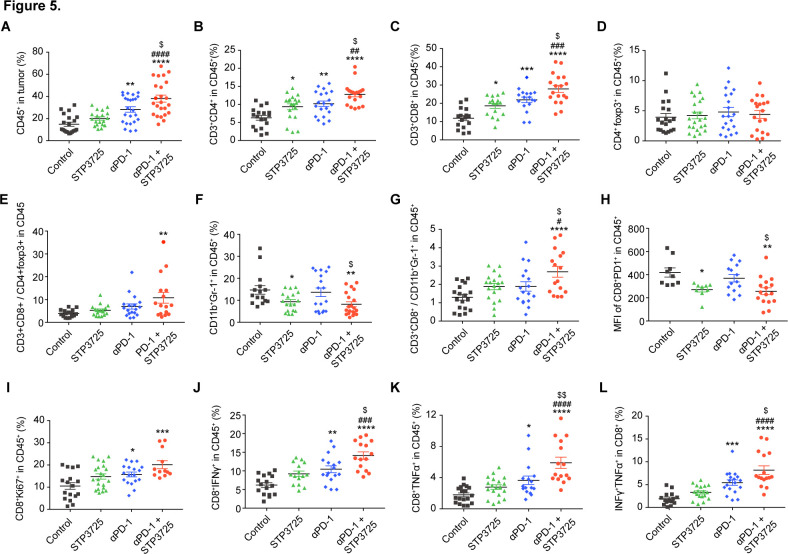
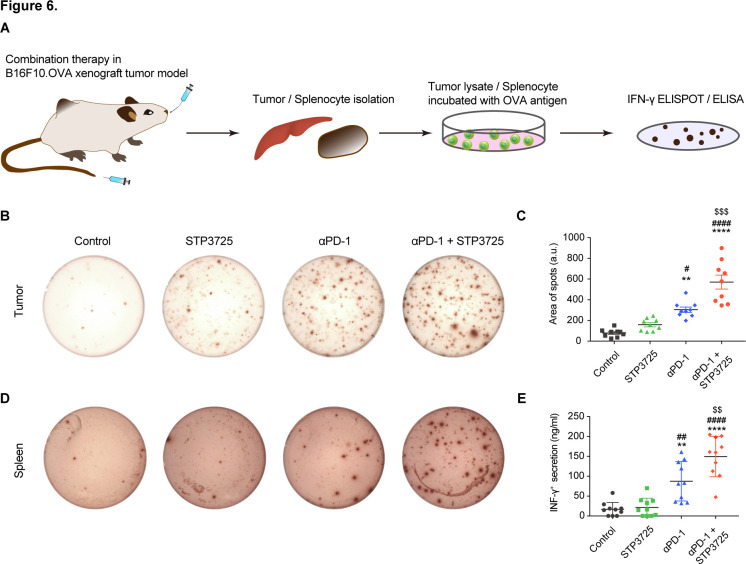
Results: CAT was demonstrated to be one of the perfusion barriers, which fosters immunosuppressive microenvironment by accelerating tumor hypoxia. Consistent treatment of oral anticoagulation therapy was proved to promote tumor immunity by alleviating hypoxia. Furthermore, this resulted in decrease of both hypoxia-related immunosuppressive cytokines and myeloid-derived suppressor cells while improving the spatial distribution of effector lymphocytes and their activity. The anticancer efficacy of αPD-1 antibody was potentiated by co-treatment with STP3725, also confirmed in various tumor models including the K-Ras mutant mouse model, which is highly thrombotic.

Conclusions: Collectively, these findings establish a rationale for a new and translational combination strategy of oral anticoagulation therapy with immunotherapy, especially for treating highly thrombotic cancers. The combination therapy of anticoagulants with immunotherapies can lead to substantial improvements of current approaches in the clinic.

Keywords: adjuvants; immunologic; immunomodulation; tumor microenvironment.


Conflict of interest statement

Competing interests: No, there are no competing interests.

Figures

Figure 1
Figure 1
Cancer-associated thrombosis (CAT) aggravates hypoxia while reducing immune cell infiltration. (A, B) Induced thrombosis model of melanoma tumors was observed by varying dosage of fibrinogen-Cy5.5 and tumors imaged ex vivo by IVIS imaging (A) and fluorescence quantified (B). (C–E) Tumor hypoxia was observed by tissue staining for pimonidazole (C), and flow cytometry analysis (D, E). (F, G) Infiltration of CD8 T cells in tumors were analyzed and quantified by flow cytometry. (H, I) Exogenosuly injected CD45.1 congenic lymphocytes were detected (H) and quantified by flow cytometry (I). (J, K) Linear regression analysis showing the relationship between injected fibrinogen and tumor hypoxia (pimonidazole) (J) and the relationship between injected fibrinogen and infiltration of CD45.1 congenic lymphocytes (K). All data represent mean±SEM. *P<0.05, **p<0.01, ***p<0.001, ****p<0.0001 compared with low group and #p<0.05, ####p<0.0001 compared with the moderate group by one-way ANOVA with Turkey’s post-test. ANOVA, analysis of variance. FITC, fluorescein isothiocyanate.
Figure 2
Figure 2
Anticoagulation therapy enhances tumor perfusion and reduces hypoxia. (A, B) B16F10 tumors were sectioned and stained with H&E to show blood clots. Representative slides of fully (left) and partially (right) occluded vessel (A). Scale bar 50 µm. tumors from control, P selectin knock out, enoxaparin-treated and STP3725-treated mice were compared (B). (C) B16F10-bearing mice treated with either the vehicle or STP3725, were imaged with 3D Doppler and (D) in vivo intratumoral blood volumes were measured. (E) Comparison of pimonidazole+ (green) hypoxic areas in tumor tissue treated with the vehicle or STP3725, analyzed by flow cytometry and (F) quantified. (G) GLUT-1+(red) hypoxic areas in tumor tissue was shown with confocal microscopy and (H) quantified. Scale bar 2 mm. (I) PET/MR images for detection of FMISO. (J) SUVR (18FMISO intensity in tumor/18FMISO intensity in muscle) values quantified in B16F10 bearing mice treated with the vehicle or STP3725. All data represent mean±SEM. *P<0.05, **p<0.01, ****p<0.0001 compared with the control group, #p<0.05, ##p<0.01, ####p<0.0001 compared with the Psel-/- group, $p<0.05 compared with the enoxaparin group by one-way ANOVA in (B) with Tukey’s post-test and Students’ t-test in (D, F, H, J). See also online supplemental figures 1 and 2 and online supplemental video 1 and online supplemental video 2. ANOVA, analysis of variance.
Figure 3
Figure 3
Anticoagulation therapy modulates the tumor immune microenvironment and promotes infiltration of lymphocytes. (A, B) Staining of HIF1α+ (green) (A) and VEGF-A+ (green) (B) in B16F10 tumor tissue slide from vehicle or STP3725-treated mice. Scale bar 2 mm. (C–F) hypoxia-related cytokines HIF1α (C) VEGF-A (D), TGF-β (E) and CCL28 (F) were quantified in whole tumor lysate using ELISA. (G) Costaining of pimonidazole+(green) hypoxic region and CD8+ (red) cells in whole tumor slide (H) and magnified images from vehicle (above) or STP3725-treated (below) mice to identify the spatial distribution of CD8+ cells in hypoxic region. Scale bar 3 mm in (G), 100 µm in (H). (I) Diagram depicting lymphocyte transfer model using congenic (CD45.1+) and wild-type (CD45.2+) C57BL/6 mice with B16F10.OVA tumor. (J) Representative flow cytometric plots showing wild-type CD45.2+ and exogenously injected congenic CD45.1+ lymphocytes, (K) quantified. All data represent mean±SEM. *P<0.05 compared with the control group, by Student’s t-test. See also online supplemental figure 3. CCL28, chemokine ligand 28; HIF1α, hypoxia-inducing factor-1α; VEGF, vascular endothelial growth factor; TGF-β, transforming growth factor β; FACS, fluorescence-activated cell sorting analysis.
Figure 4
Figure 4
Anticoagulant therapy potentiates the anticancer efficacy of αPD-1 antibody. (A–D) (A) Comparison of B16F10.OVA tumor growth inhibition in control, STP3725, αPD-1 and combination groups. (B) Tumors harvested on day 19 were weighed. (C) Body weight changes and (D) individual tumor growth. (E–H) similarly, tumor growth inhibition in the same groups were measured using CT26.CL25 tumor model. (F) Tumors harvested on day 24 were weighed. (G) Body weight changes and (H) individual tumor growth. All data represent mean±SEM. **p<0.01, ***p<0.001, ****p<0.0001 compared with the control group, #p<0.05, ##p<0.01 compared with the STP3725 group by one-way ANOVA with Tukey’s post-test. See also online supplemental figures 4 and 5. ANOVA, analysis of variance.
Figure 5
Figure 5
Combination of anticoagulant and αPD-1 antibody promotes the infiltration of effector lymphocytes. (A) Flow cytometry analysis of CD45+ cell fraction in whole B16F10.OVA tumor and CD45+-gated cells for (B) CD3+CD4+ T cells, (C) CD3+CD8+ T cells, (D) regulatory T cells, (E) ratio of CD8+ cells/regulatory T cells, (F) MDSCs, (G) ratio of CD8+ cells/MDSCs, (H) PD-1-CD8+ T cells, and (I) proliferating CD8+ T cells in each group. Cytokine-secreting CD8+ cells such as (J) IFNγ-secreting CD8+ T cells, (K) TNFα-secreting CD8+ T cells, (L) IFNγ+TNFα+CD8+ T cells (poly functional T cell) were also analyzed. All data represent mean±SEM. *P<0.05, **p<0.01, ***p<0.001, ****p<0.0001 compared with the control group, #p<0.05, ##p<0.01, ###p<0.001, ####p<0.0001 compared with the STP3725 group, $p<0.05, $$p<0.01 compared with the αPD-1 group, by one-way ANOVA with Tukey’s post-test. See also online supplemental figures 6 and 7. ANOVA, analysis of variance; IFNγ, interferon-γ; MDSC, myeloid-derived suppressor cell; TNFα, tumor necrosis factor-α.
Figure 6
Figure 6
Combination therapy promotes tumor-specific memory responses. (A) Diagram depicting the tumor antigen specific T cell response ex vivo model using IFNγ ELISPOT and ELISA. (B) IFNγ ELISpot images were acquired after stimulating splenocytes with OVA from the tumor tissues in each group and (C) area of dot was quantified in each group. (D) Similarly, IFNγ ELISpot images were acquired after stimulating splenocytes with OVA from the splenocytes in each group and (E) the amount of IFNγ in splenocytes cultured media after OVA stimulation was measured using ELISA. IFNγ, interferon γ. All data represent mean±SEM. **p<0.01, ****p<0.0001 compared with the control group, #p<0.05, ##p<0.01, ####p<0.0001 compared with the STP3725 group, $$p<0.01, $$$p<0.001 compared with the αPD-1 group, by one-way ANOVA with Tukey’s post-test.
Figure 7
Figure 7
Combination therapy attenuates tumor development in a in K-ras mutant mouse model. (A) Schematic figure depicting the dosing schedule in K-ras mutant model. (B) Representative images of lung tissues harvested from vehicle, STP3725, and STP3725+αPD-1 antibody-treated mice. (C) Quantification of lung nodules, (D) lung weight, (E) and total tumor area fraction of lung tissues. (F) Representative whole tissue image was shown. Scale bar 2 mm. (G) Fibrin clots in lung tissue slides were distinguished both in tumor and non-tumoral areas using MSB (Lendrum) staining method (H) and quantified. (I) Schematic diagram depicting changes in the tumor immune microenvironment following anticoagulant treatment. STP3725 treatment enhances the blood flow into the tumor tissue while alleviates tumor hypoxia, which leads to changes in the composition and population of immune cells (MDSCs and T cells). Scale bar 100 µm. All data represent mean±SEM. *P<0.05, **p<0.01, ***p<0.001, ****p<0.0001 compared with control group and one-way ANOVA in (C–E) and two-way ANOVA in (H) with Turkey’s post-test. ANOVA, analysis of variance; MDSCs, myeloid-derived suppressor cell.

Similar articles

Cited by

References

    1. Park J-S, Kim I-K, Han S, et al. . Normalization of tumor vessels by Tie2 activation and Ang2 inhibition enhances drug delivery and produces a favorable tumor microenvironment. Cancer Cell 2016;30:953–67. 10.1016/j.ccell.2016.10.018 - DOI - PubMed
    1. Jain RK. Antiangiogenesis strategies revisited: from starving tumors to alleviating hypoxia. Cancer Cell 2014;26:605–22. 10.1016/j.ccell.2014.10.006 - DOI - PMC - PubMed
    1. Stylianopoulos T, Jain RK. Combining two strategies to improve perfusion and drug delivery in solid tumors. Proc Natl Acad Sci U S A 2013;110:18632–7. 10.1073/pnas.1318415110 - DOI - PMC - PubMed
    1. Chauhan VP, Stylianopoulos T, Martin JD, et al. . Normalization of tumour blood vessels improves the delivery of nanomedicines in a size-dependent manner. Nat Nanotechnol 2012;7:383–8. 10.1038/nnano.2012.45 - DOI - PMC - PubMed
    1. Mukai M, Oka T. Mechanism and management of cancer-associated thrombosis. J Cardiol 2018;72:89–93. 10.1016/j.jjcc.2018.02.011 - DOI - PubMed

Publication types