. 2021 Aug 3;11(1):412.
doi: 10.1038/s41398-021-01496-3.

A machine learning case-control classifier for schizophrenia based on DNA methylation in blood

Affiliations

A machine learning case-control classifier for schizophrenia based on DNA methylation in blood

Chathura J Gunasekara et al. Transl Psychiatry. .

Abstract

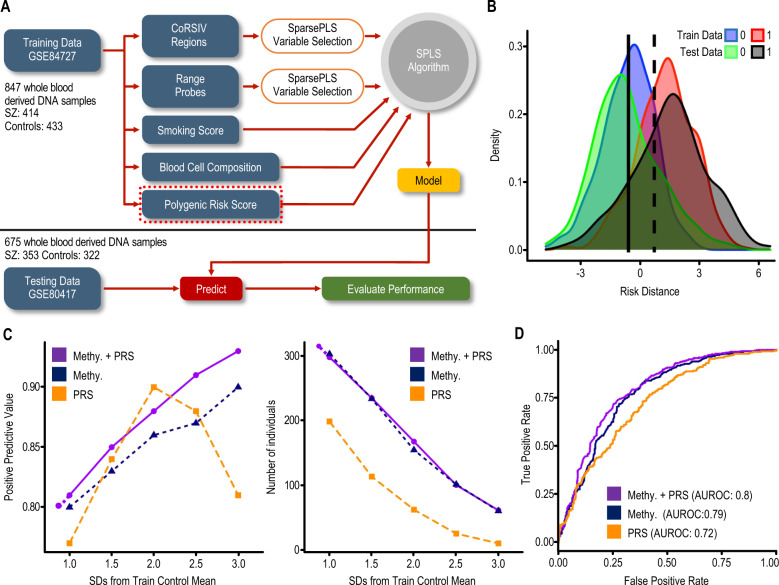
Epigenetic dysregulation is thought to contribute to the etiology of schizophrenia (SZ), but the cell type-specificity of DNA methylation makes population-based epigenetic studies of SZ challenging. To train an SZ case-control classifier based on DNA methylation in blood, therefore, we focused on human genomic regions of systemic interindividual epigenetic variation (CoRSIVs), a subset of which are represented on the Illumina Human Methylation 450K (HM450) array. HM450 DNA methylation data on whole blood of 414 SZ cases and 433 non-psychiatric controls were used as training data for a classification algorithm with built-in feature selection, sparse partial least squares discriminate analysis (SPLS-DA); application of SPLS-DA to HM450 data has not been previously reported. Using the first two SPLS-DA dimensions we calculated a "risk distance" to identify individuals with the highest probability of SZ. The model was then evaluated on an independent HM450 data set on 353 SZ cases and 322 non-psychiatric controls. Our CoRSIV-based model classified 303 individuals as cases with a positive predictive value (PPV) of 80%, far surpassing the performance of a model based on polygenic risk score (PRS). Importantly, risk distance (based on CoRSIV methylation) was not associated with medication use, arguing against reverse causality. Risk distance and PRS were positively correlated (Pearson r = 0.28, P = 1.28 × 10⁻¹²), and mediational analysis suggested that genetic effects on SZ are partially mediated by altered methylation at CoRSIVs. Our results indicate two innate dimensions of SZ risk: one based on genetic, and the other on systemic epigenetic variants.


Conflict of interest statement

The authors declare no competing interests.

Figures

Fig. 1
Fig. 1. Classification of SZ cases and controls using CoRSIV methylation in blood DNA.
A Only a small fraction of HM450 probes show a positive correlation of methylation across blood and four brain regions (left). CoRSIVs, however, (right) generally show positive correlations between methylation in blood and these same brain regions. B Applying SPLS-DA to CoRSIV data achieved partial separation of cases (1) and controls (0). Euclidean distance (risk distance) from (0,0) to each sample in the 2D plot is calculated along the vector vardim1i+vardim2j. C The risk distance distributions for cases and controls in the training data (top). Those for an independent set of cases and controls (testing data, bottom) show similar separation. D Evaluation of classifier performance using positive predictive value (PPV). Individuals with risk distance more than (1, 1.5, 2, 2.5, 3) standard deviations (SD) above the mean control risk distance of the training data were considered as positive. The number of individuals at each SD increment classified as cases is shown in green, and PPV is shown in red. By interpolation, a cutoff of 1.7 SD achieves 80% PPV in classifying test cases. By comparison, only 43 out of 307 test controls (14%) pass this threshold.
Fig. 2
Fig. 2. Evidence against reverse causality due to medication use.
A (Left) Applying a model built on Hannon et al. 2016 probes (SZ case–control DMPs) from blood-based training data to case–control methylation data on the prefrontal cortex (PFC) yields very high-risk distances for cases and controls. By comparison, applying our CoRSIV model trained on blood-based data to the same PFC data set (right) yielded risk distances close to zero and greater separation of cases and controls. B For cases in the training data set (Aberdeen cohort; 232 cases with complete drug usage information) risk distances determined by our model are not correlated with chlorpromazine equivalent dose of antipsychotic medication (P = 0.45). C For this same data set, two classes of cases based on chlorpromazine equivalent dose > 0 (i.e., currently taking medication, n = 242) and = 0 (not currently taking medication, n = 46) show no difference in mean risk distance determined by our model (P > 0.9). D In the testing data set (UCL cohort), cases with some use of clozapine (n = 60) or other antipsychotics (n = 92) were compared with those who have no record of antipsychotic use (n = 202). The proportion of individuals correctly classified as cases, based on risk distance, did not differ between groups (P > 0.77, P > 0.49, odds ratio).
Fig. 3
Fig. 3. A new metric to assess interindividual variation in DNA methylation.
A Range2–98% vs. variance for each HM450 probe, across 847 samples in the training data set. Many probes (highlighted region) are in the top 2500 for range2–98%, but not for variance. B Distributions of individual-level beta values (proportional methylation) for four representative probes from the highlighted area in A. All show bimodal or trimodal distributions. Variance values for each of these four probes are 0.009, 0.008, 0.008, and 0.009, and range2–98% values are 0.72, 0.56, 0.53, and 0.52, respectively. C Even after excluding those within CoRSIVs, the top 2500 probes by range2–98% generally show positive correlations between methylation in blood and the four brain regions, suggesting their utility for SZ case–control classification.
Fig. 4
Fig. 4. Final classification model incorporating DNA methylation at CoRSIVs and top range2–98% probes, as well as blood cell composition, smoking score, and PRS.
A Schematic diagram of the overall analytical approach. The feature selection and model building was done using SZ case–control HM450 data on 847 whole-blood DNA samples (GSE84727). Then, using the model, risk distances were calculated for an independent case–control set of 675 whole-blood DNA samples (GSE80417). B Risk-distance distribution in training and testing data. The solid vertical line shows the mean risk distance in training control samples, and the dashed line indicates 1SD above the mean of the training controls (0 = control, 1 = case). C Separate plots of PPV (left) and the number of individuals classified as cases (right) to evaluate classifier performance (as in Fig. 1D) for the final model including methylation and PRS, vs. models including either methylation or PRS. D AUROC curves of the models.
Fig. 5
Fig. 5. Evaluation of genetic influence on risk distance.
A Plot of risk distances calculated from the final model (excluding PRS) vs. PRS for all individuals in the test set shows a weak positive correlation (Pearson r = 0.28, P = 1.28 × 1012). The dashed horizontal and vertical lines show median risk distance and PRS, respectively (0 = control, 1 = case). B Mediational analysis indicates that 27% of the effect of PRS on disease status is mediated by CoRSIV methylation (i.e., risk distance). C Enrichment of GWAS SNPs identified for several conditions in the vicinity of CoRSIV probes in the classification model (SZ schizophrenia, BP bipolar disorder, ASD autism spectrum disorder, BC breast cancer, RA rheumatoid arthritis, CAD coronary artery disease, smoking). SNPs associated with SZ and ASD show stronger enrichment than those for non-neurological diseases.

References

    1. Insel TR. Rethinking schizophrenia. Nature. 2010;468:187–93. doi: 10.1038/nature09552. - DOI - PubMed
    1. Owen MJ, Sawa A, Mortensen PB. Schizophrenia. Lancet. 2016;388:86–97. doi: 10.1016/S0140-6736(15)01121-6. - DOI - PMC - PubMed
    1. Petronis A. The origin of schizophrenia: genetic thesis, epigenetic antithesis, and resolving synthesis. Biol Psychiatry. 2004;55:965–70. doi: 10.1016/j.biopsych.2004.02.005. - DOI - PubMed
    1. McGuffin P, Asherson P, Owen M, Farmer A. The strength of the genetic effect. Is there room for an environmental influence in the aetiology of schizophrenia? Br J Psychiatry. 1994;164:593–9. doi: 10.1192/bjp.164.5.593. - DOI - PubMed
    1. Schizophrenia Working Group of the Psychiatric Genomics, Consortium. Biological insights from 108 schizophrenia-associated genetic loci. Nature. 2014;511:421–7. doi: 10.1038/nature13595. - DOI - PMC - PubMed

Publication types