. 2022 Feb;36(2):348-360.
doi: 10.1038/s41375-021-01361-8. Epub 2021 Aug 2.

Targeting serine hydroxymethyltransferases 1 and 2 for T-cell acute lymphoblastic leukemia therapy

Affiliations

Targeting serine hydroxymethyltransferases 1 and 2 for T-cell acute lymphoblastic leukemia therapy

Yana Pikman et al. Leukemia. 2022 Feb.

Abstract

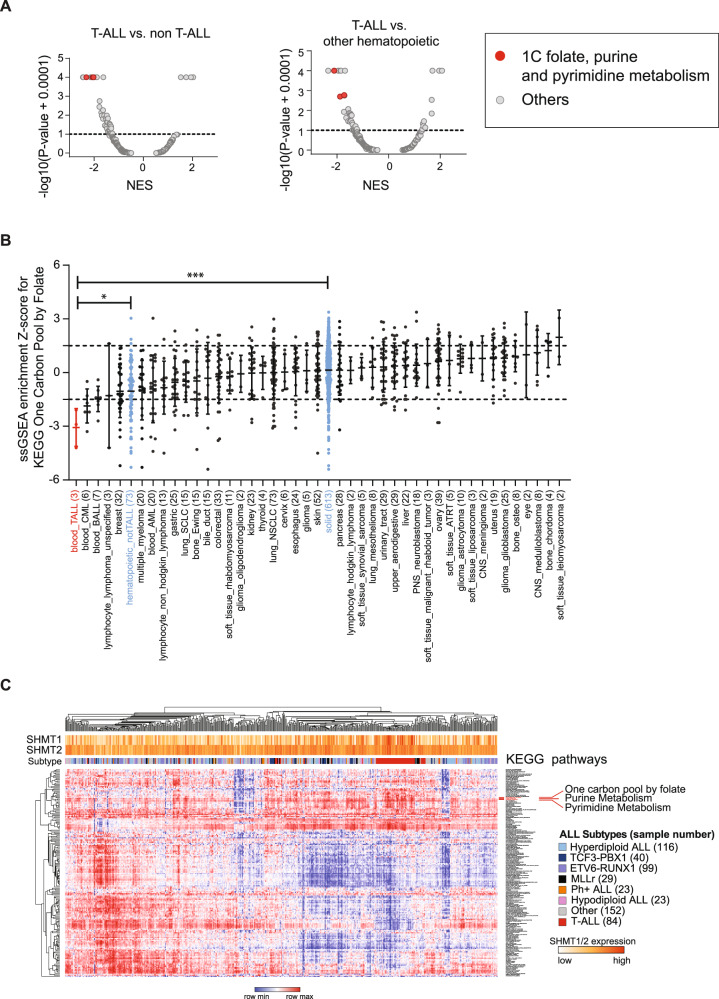
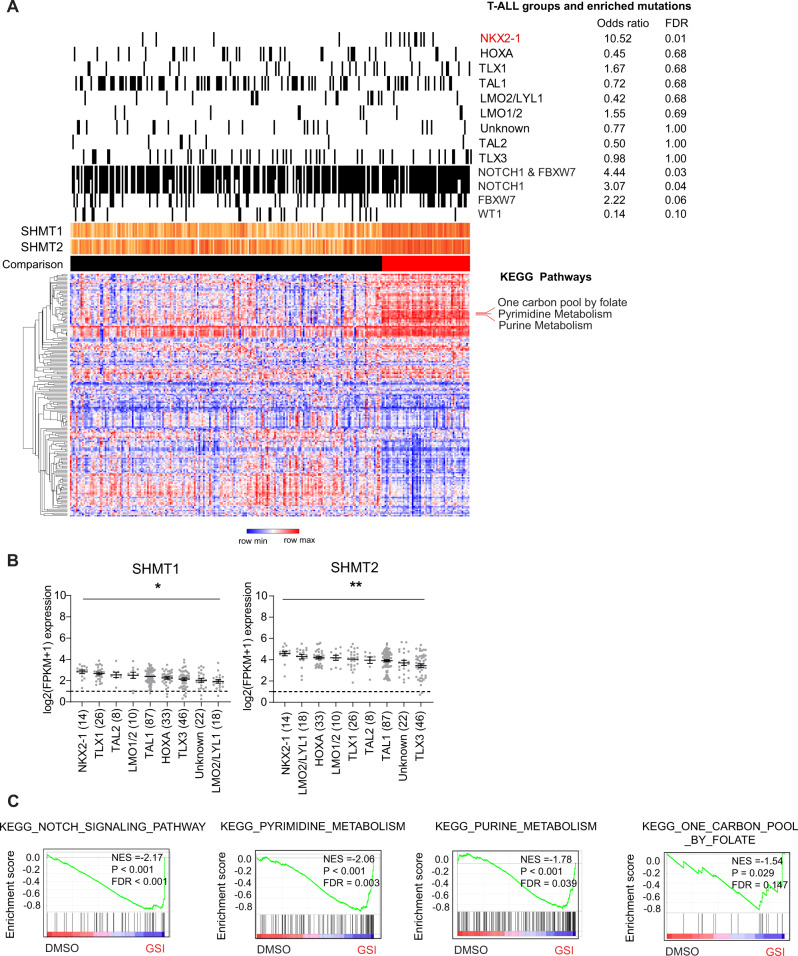
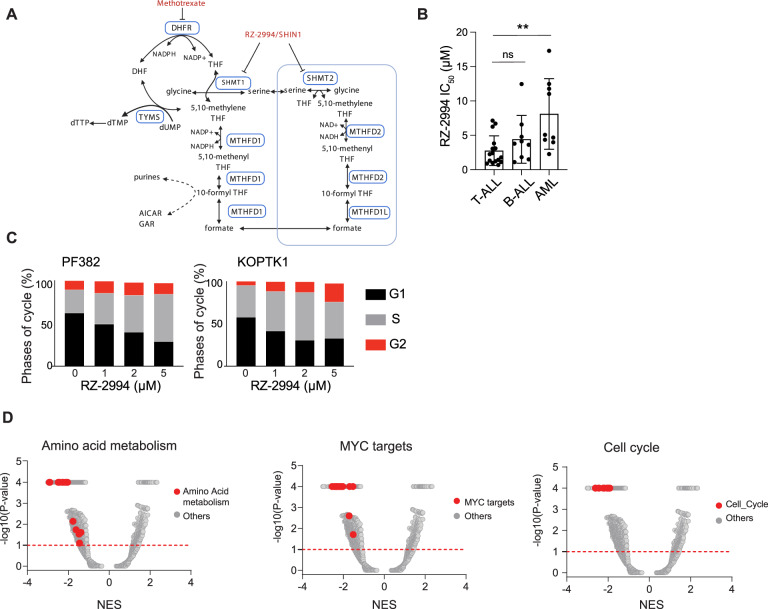
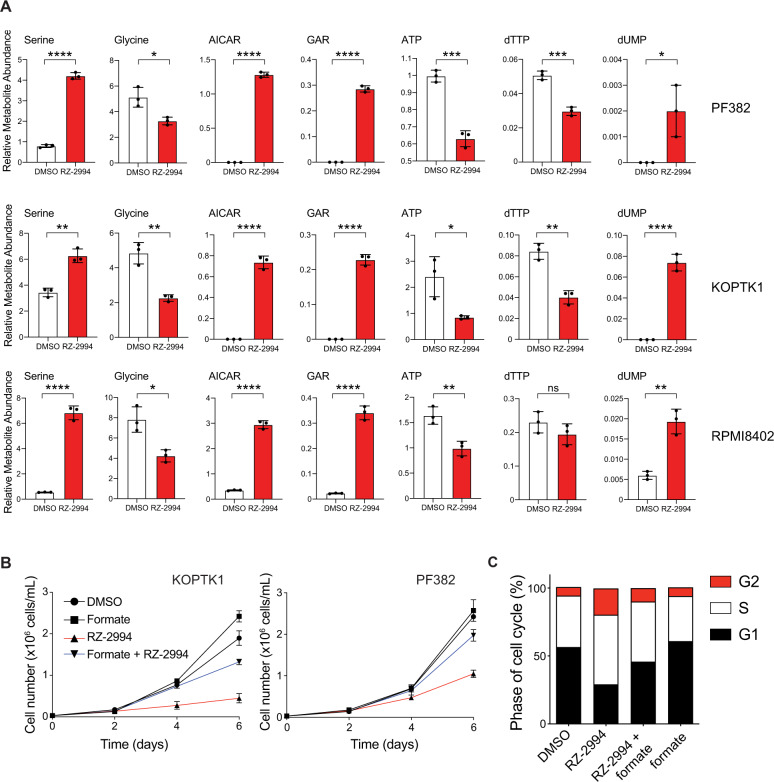
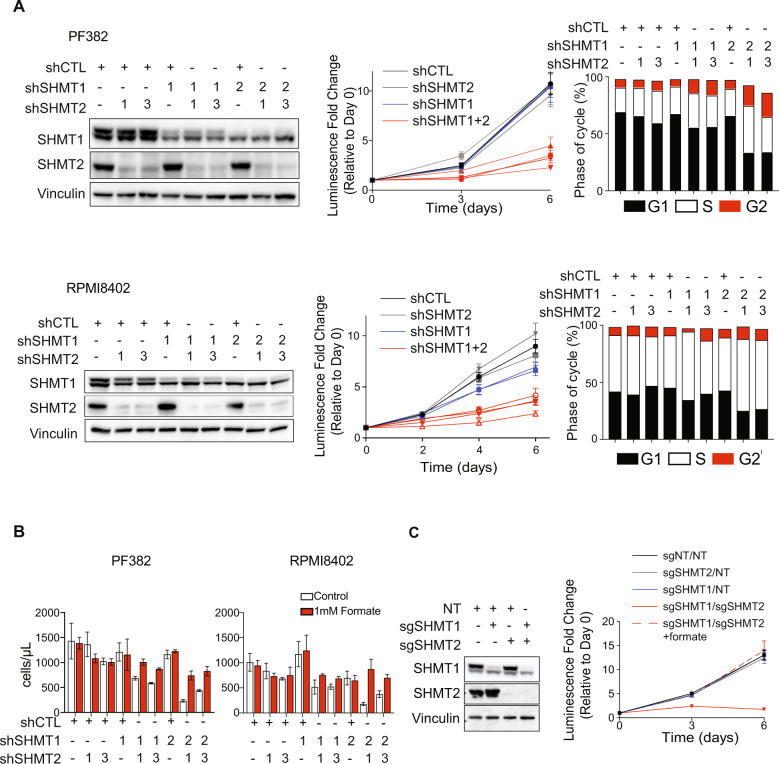
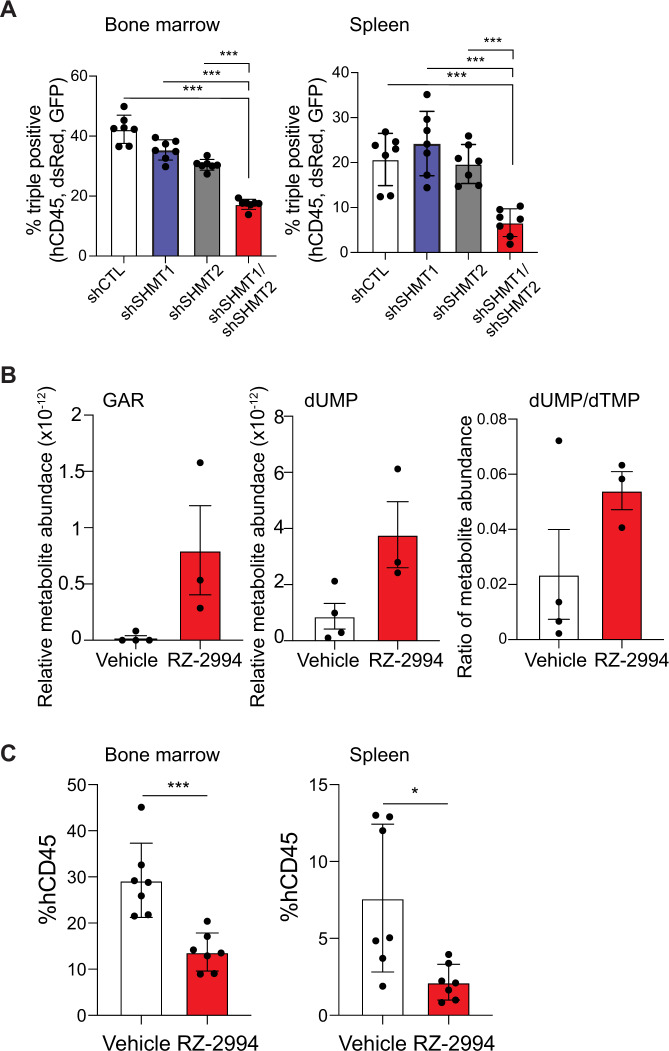
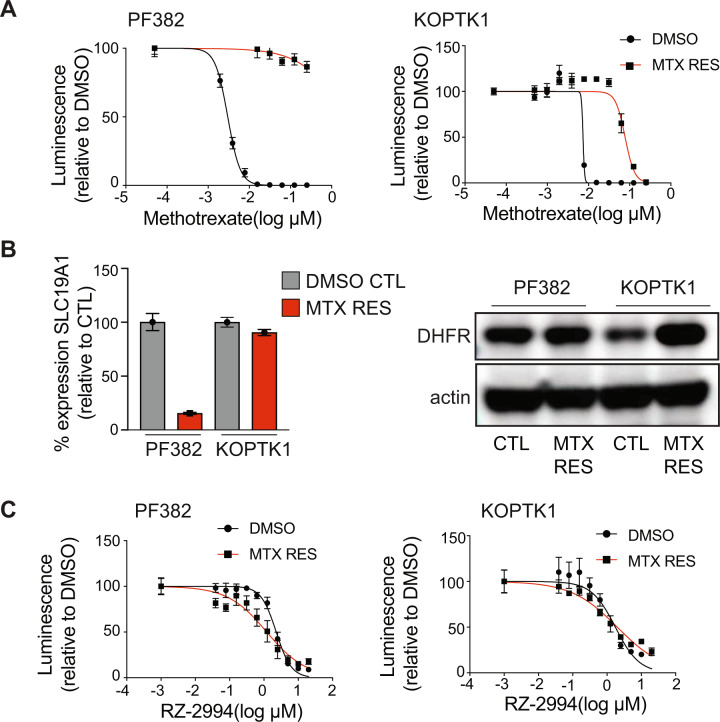
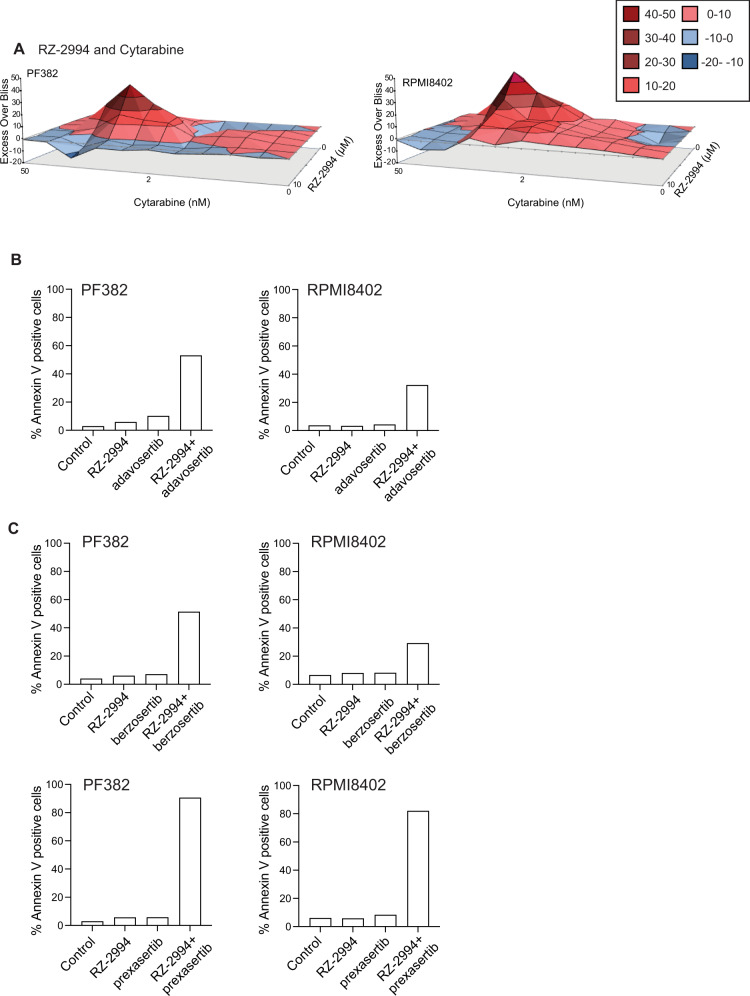
Despite progress in the treatment of acute lymphoblastic leukemia (ALL), T-cell ALL (T-ALL) has limited treatment options, particularly in the setting of relapsed/refractory disease. Using an unbiased genome-scale CRISPR-Cas9 screen we sought to identify pathway dependencies for T-ALL which could be harnessed for therapy development. Disruption of the one-carbon folate, purine and pyrimidine pathways scored as the top metabolic pathways required for T-ALL proliferation. We used a recently developed inhibitor of SHMT1 and SHMT2, RZ-2994, to characterize the effect of inhibiting these enzymes of the one-carbon folate pathway in T-ALL and found that T-ALL cell lines were differentially sensitive to RZ-2994, with the drug inducing a S/G2 cell cycle arrest. The effects of SHMT1/2 inhibition were rescued by formate supplementation. Loss of both SHMT1 and SHMT2 was necessary for impaired growth and cell cycle arrest, with suppression of both SHMT1 and SHMT2 inhibiting leukemia progression in vivo. RZ-2994 also decreased leukemia burden in vivo and remained effective in the setting of methotrexate resistance in vitro. This study highlights the significance of the one-carbon folate pathway in T-ALL and supports further development of SHMT inhibitors for treatment of T-ALL and other cancers.


Conflict of interest statement

KS has previously consulted for Novartis, Rigel Pharmaceuticals, AstraZeneca, and Kronos Bio. She consults and has stock options with Auron Therapeutics and received grant funding from Novartis on topics unrelated to this manuscript. MGVH discloses that he is a consultant and advisory board member for Agios Pharmaceuticals, Aeglea Biotherapeutics, iTEOS Therapeutics, Faeth Therapeutics, and Auron Therapeutics.

Figures

Fig. 1
Fig. 1. One-carbon folate metabolism is a dependency in T-ALL.
A Volcano plots showing enrichment of KEGG pathways for 689 cell lines in the Avana 19Q4 data set. The KEGG one-carbon pool by folate, purine and pyrimidine metabolism pathways scored as most depleted in the T-ALL lineage (n = 3) compared to all other cell lines (n = 686) (left) (P = 0.0003, Mann–Whitney test) and to other hematopoietic cell lines (n = 73) (right) (P = 0.025, Mann–Whitney test). Normalized enrichment score (NES) shown on X-axis. B Graph showing the distribution of the ssGSEA Z-scores for the one-carbon pool by folate pathway across cancer cell lineages represented in the Avana 19Q4 data set. The one-carbon pool by folate pathway is significantly enriched in T-ALL vs. non-T-ALL hematopoietic (*P ≤ 0.05, Mann–Whitney test) and T-ALL vs. solid tumor (***P ≤ 0.001, Mann–Whitney test) cell lines. C Heatmap of ssGSEA projections for the primary ALL sample data set GSE33315 on the collection of KEGG canonical pathways. T-ALL samples are highlighted in red.
Fig. 2
Fig. 2. One-carbon folate metabolism in T-ALL is associated with NOTCH1 pathway mutations and the NKX2-1 group.
A Heatmap of ssGSEA projection for the primary TARGET T-ALL sample data set on the collection of KEGG canonical pathways. T-ALL samples highlighted in red enriched for expression of the one-carbon folate, purine, and pyrimidine KEGG pathways (ssGSEA z-score > 1.5). B Graphs showing SHMT1 and SHMT2 expression across T-ALL genomic subgroups [7]. C Gene expression changes associated with GSI treatment of T-ALL cell lines show enrichment in NOTCH1 signaling, purine, pyrimidine, and one-carbon folate pathways.
Fig. 3
Fig. 3. Enzymatic inhibition of SHMT1 and SHMT2 results in T-ALL arrest and gene expression changes.
A Simplified schematic of the one-carbon folate pathway highlighting the targets for RZ-2994 and methotrexate. B T-ALL (n = 16), B-ALL (n = 9), and AML (n = 9) cell lines were treated with RZ-2994 in a range of concentrations, in quadruplicate for 6 days. Bar graph showing the average IC50 per lineage, with each dot representing the IC50 in a cell line. **P ≤ 0.01 using one-way ANOVA with post hoc multiple comparisons test. C Cell cycle analysis in T-ALL cells treated with increasing concentrations of RZ-2994. D RNAseq was performed for the KOPTK1 cell line treated with RZ-2994. Volcano plots showing quantitative comparison of gene sets from MSigDB v7.0 using ssGSEA. Volcano plots compare DMSO versus RZ-2994 after 3 days of treatment. All data sets above the dashed red line have P value ≤ 0.05.
Fig. 4
Fig. 4. RZ-2994 causes metabolic changes in T-ALL, and its antiproliferative effects can be rescued with formate supplementation.
A Bar graphs showing changes in metabolites associated with one-carbon folate metabolism following treatment with RZ-2994 in 3 cell lines. Cell lines were treated with 2 µM RZ-2994 for 3 days, metabolites extracted and profiled using LC–MS. Raw peak areas were normalized to internal standards. *P ≤ 0.05; **P ≤ 0.01; ***P ≤ 0.001; ****P ≤ 0.0001 using unpaired t test. B RZ-2994 leads to a decreased cell growth in T-ALL cell lines, and this growth defect can be rescued with supplementation of 1 mM formate. Graphs depict cell number as measured by trypan blue exclusion. Shown are the means ± SD of three replicates. C Cell cycle analysis in T-ALL cells treated with DMSO, RZ-2994 (2 µM), formate (1 mM), or the combination of RZ-2994 with formate.
Fig. 5
Fig. 5. Repression of both SHMT1 and SHMT2 is required for T-ALL cell cycle arrest.
A SHMT1 and SHMT2 targeting hairpins were used to knockdown SHMT1, SHMT2, or both in PF382 or RPMI8402 cells. On the left, western blot showing knockdown using shSHMT1-1 or shSHMT1-2 (labeled 1 or 2 in the SHMT1 row), or shSHMT2-1 or shSHMT2-3 (labeled 1 or 3 in the SHMT2 row). Addition of control vectors (shCTL) shown with +. In the middle images, cells were grown for 6 days and viability assessed by an ATP-based assay. Graphs depict luminescence fold change relative to Day 0. shSHMT2-1 and shSHMT2-3 are both labeled “shSHMT2” and colored gray. shSHMT1-1 and shSHMT1-2 are both labeled “shSHMT1” and colored blue. Cells with knockdown of both SHMT1 and SHMT2 are shown in red. Shown are the means ± SD of four replicates. On the right, bar graph showing cell cycle analysis after inducible shRNA knockdown. B PF382 or RPMI8402 cells were transduced with hairpins targeting SHMT1, SHMT2, or the combination and grown in media with or without formate supplementation for 6 days. Bar graphs show the means ± SD of three replicates. C Western blot showing knockout of SHMT1, SHMT2, or both using CRISPR guides in PF382 cells. Cells were grown over the course of 6 days and viability assessed by an ATP-based assay. Graphs depict luminescence fold change per cell line condition relative to Day 0.
Fig. 6
Fig. 6. Knockdown and enzymatic inhibition of SHMT1 and SHMT2 are effective for T-ALL therapy in vivo.
A Bar graph depicting percent of triple positive (hCD45+, GFP+, and dsRed+) cells in bone marrow and spleen. Shown is average with SD, n = 7 per group. *P ≤ 0.05; ***P ≤ 0.001 using Mann–Whitney test. B Polar metabolites were extracted from spleens of mice treated with RZ-2994 for 1 week and targeted profiling done using LC–MS. Bar graph shows relative metabolites compared to internal controls. Shown is average with SD, n = 4 for vehicle samples, and n = 3 for RZ-2994 samples. C Irradiated NSG mice were injected with RPMI8402-lucNeo cells. After disease was established, mice were treated with RZ-2994. Bar graph showing percent of hCD45+ cells in bone marrow and spleen after treatment with RZ-2994 100 mg/kg daily for 2 weeks. *P ≤ 0.05; ***P ≤ 0.001 using Mann–Whitney test.
Fig. 7
Fig. 7. RZ-2994 is effective in the setting of methotrexate resistance.
A PF382 and KOPTK1 cells were grown to methotrexate resistance. Parental and methotrexate resistant cells were tested with a range of methotrexate concentrations and viability evaluated at day 6 by an ATP-based assay as the percentage of viable cells relative to a DMSO control. Shown are the mean ± SD of four replicates. B On the left, bar graph showing SLC19A1 expression in methotrexate resistant PF382 and KOPTK1 cells compared to controls as mean expressions ± SD of four replicates. On the right, western blot showing level of expression of DHFR in methotrexate resistant cells compared to parental cell lines. C Methotrexate resistant PF382 and KOPTK1 cells were tested for sensitivity to RZ-2994 with a range of concentrations and viability evaluated at day 6 by an ATP-based assay as the percentage of viable cells relative to a DMSO control. Shown are the mean ± SD of four replicates.
Fig. 8
Fig. 8. RZ-2994 is synergistic with cytarabine and inhibitors of the G2/M checkpoint.
A Excess over Bliss analysis for the combination of RZ-2994 with cytarabine in PF382 and RPMI8402 cell lines. PF382 and RPMI8402 cells were treated with RZ-2994 (2 µM), adavosertib (125 nM), berzosertib (50 nM), prexasertib (5 nM), or the indicated combinations for 6 days and analyzed for apoptosis by flow cytometry. Bar graphs showing percent Annexin V positive cells for the combination of RZ-2994 with adavosertib (B), RZ-2994 with berzosertib or RZ-2994 with prexasertib (C). Shown is data from a representative experiment.

References

    1. Warburg O, Wind F, Negelein E. The metabolism of tumors in the body. J Gen Physiol. 1927;8:519–30. - PMC - PubMed
    1. Farber S, Diamond LK, Mercer RD, Sylvester RF, Wolff JA. Temporary remissions in acute leukemia in children produced by folic acid antagonist, 4-aminopteroyl-glutamic acid (aminopterin) N Engl J Med. 1948;238:787–93. - PubMed
    1. Radtke F, Wilson A, Stark G, Bauer M, van Meerwijk J, MacDonald HR, et al. Deficient T cell fate specification in mice with an induced inactivation of Notch1. Immunity. 1999;10:547–58. - PubMed
    1. Koch U, Fiorini E, Benedito R, Besseyrias V, Schuster-Gossler K, Pierres M, et al. Delta-like 4 is the essential, nonredundant ligand for Notch1 during thymic T cell lineage commitment. J Exp Med. 2008;205:2515–23. - PMC - PubMed
    1. Ron-Harel N, Santos D, Ghergurovich JM, Sage PT, Reddy A, Lovitch SB, et al. Mitochondrial biogenesis and proteome remodeling promote one-carbon metabolism for T cell activation. Cell Metab. 2016;24:104–17. - PMC - PubMed

Publication types

MeSH terms