. 2022 Jan;47(2):553-563.
doi: 10.1038/s41386-021-01116-0. Epub 2021 Aug 2.

BDNF controls GABAAR trafficking and related cognitive processes via autophagic regulation of p62

Affiliations

BDNF controls GABAAR trafficking and related cognitive processes via autophagic regulation of p62

Toshifumi Tomoda et al. Neuropsychopharmacology. 2022 Jan.

Abstract

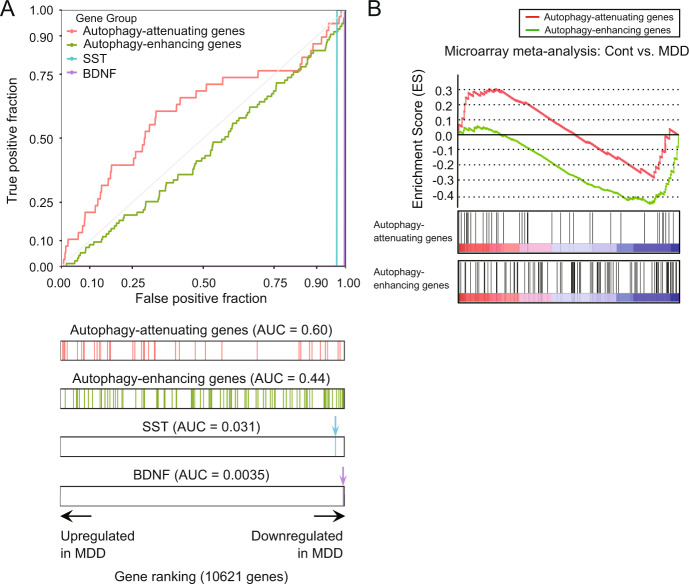
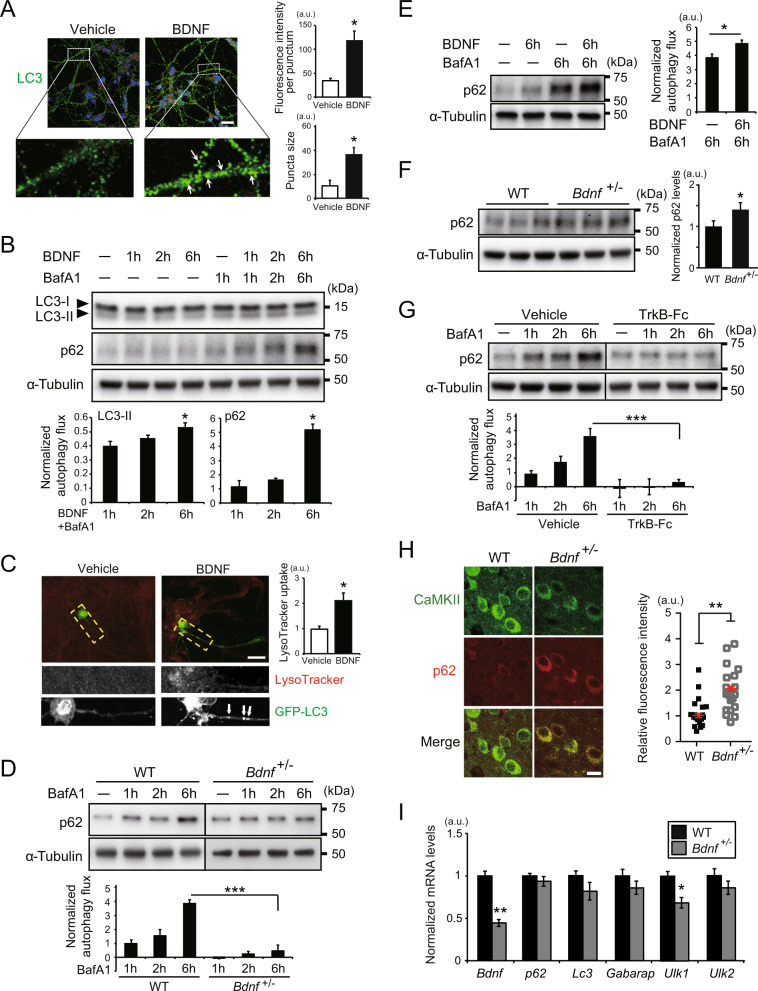
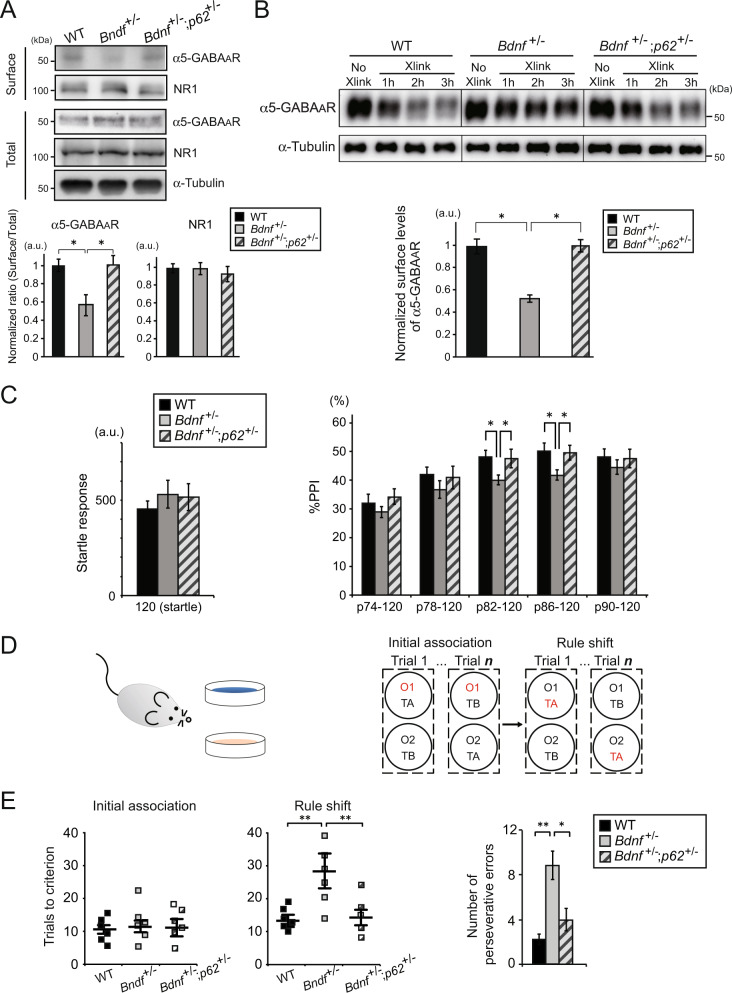
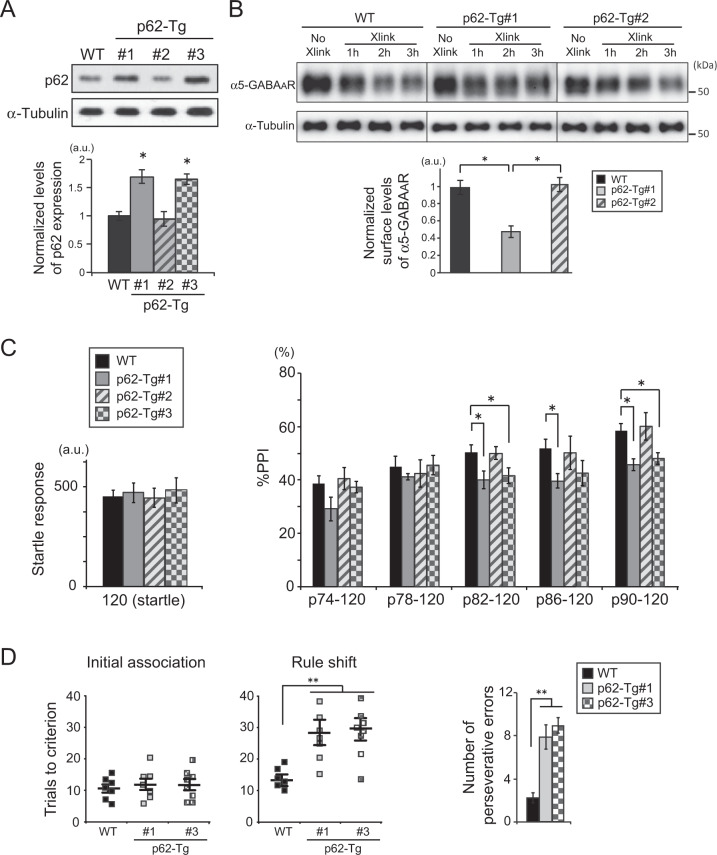
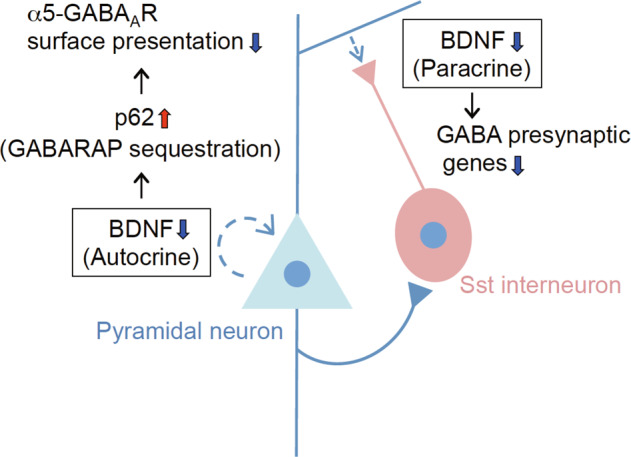
Reduced brain-derived neurotrophic factor (BDNF) and gamma-aminobutyric acid (GABA) neurotransmission co-occur in brain conditions (depression, schizophrenia and age-related disorders) and are associated with symptomatology. Rodent studies show they are causally linked, suggesting the presence of biological pathways mediating this link. Here we first show that reduced BDNF and GABA also co-occur with attenuated autophagy in human depression. Using mice, we then show that reducing Bdnf levels (Bdnf+/-) leads to upregulated sequestosome-1/p62, a key autophagy-associated adaptor protein, whose levels are inversely correlated with autophagic activity. Reduced Bdnf levels also caused reduced surface presentation of α5 subunit-containing GABAA receptor (α5-GABAAR) in prefrontal cortex (PFC) pyramidal neurons. Reducing p62 gene dosage restored α5-GABAAR surface expression and rescued PFC-relevant behavioral deficits of Bdnf+/- mice, including cognitive inflexibility and reduced sensorimotor gating. Increasing p62 levels was sufficient to recreate the molecular and behavioral profiles of Bdnf+/- mice. Collectively, the data reveal a novel mechanism by which deficient BDNF leads to targeted reduced GABAergic signaling through autophagic dysregulation of p62, potentially underlying cognitive impairment across brain conditions.


Conflict of interest statement

The authors declare no competing interests.

Figures

Fig. 1
Fig. 1. Gene expression profiles in human postmortem brains suggest reduced autophagy in depression.
A Upper panel: Expression levels of the autophagy-enhancing (95 genes, table S1) versus the autophagy-attenuating (38 genes, table S2) gene sets in corticolimbic areas from postmortem brains of depression were compared with those of the control cohorts. Overall expression levels of the autophagy-attenuating genes in depression, as represented by the area under the curve (AUC = 0.60), were significantly different from those of the autophagy-enhancing genes (AUC = 0.44) (p < 0.01). Lower panel: The autophagy-attenuating genes in depression clustered toward upregulated, whereas the autophagy-enhancing genes in depression clustered toward downregulated expression. As internal reference, the ranking of the BDNF and Somatostatin (SST) genes were plotted, both of which have been reported to be significantly downregulated in corticolimbic areas of depression subjects [40], as represented by the AUC values of 0.0035 and 0.031, respectively. B GSEA on gene expression profiles in depression versus control subjects obtained from meta-analysis of microarray datasets shows significant enrichment in downregulation for autophagy-enhancing genes (green line) (p = 0.008) but no significant enrichment for autophagy-attenuating genes (red line).
Fig. 2
Fig. 2. BDNF regulates autophagy and p62 protein levels in cortical pyramidal neurons.
A Primary cortical neurons prepared from GFP-LC3 mice and cultured for 16 days in vitro (DIV) were treated with BDNF (100 ng/ml) or vehicle for 30 min, and the fluorescence intensities of GFP+ autophagosomes and their sizes were scored from >50 GFP+ puncta per condition (a.u., arbitrary unit). Scale bar, 20 μm. *p < 0.05 (Student’s t test). B Autophagy flux assay: wild-type (WT) primary cortical neurons (14–16DIV) were treated with BDNF (100 ng/ml) for the indicated times in the presence or absence of bafilomycin A1 (BafA1, 20 nM), and the cell lysates were analyzed by Western blot using LC3 and p62 antibodies. The autophagy flux (the difference of LC3-II (or p62) in the presence vs. the absence of BafA1 at a given time point) was normalized to the steady-state level of LC3-II (or p62) measured without BDNF and BafA1 (lane 1) to allow cross-experimental comparisons. All autophagy flux assays were done in triplicate. *p < 0.05 (vs. 1h, Kruskal–Wallis test). C WT primary cortical neurons were transfected with GFP-LC3 at 14DIV and treated with BDNF (100 ng/ml) for 30 min at 16DIV. LysoTracker was included in culture media for the last 5 min of culture period immediately before microscopic observation of epifluorescence in culture. LysoTracker fluorescence intensities per some were scored. Scale bar, 20 μm. The dotted line areas were magnified with separate LysoTracker and LC3 signals in the two lower panels. Arrows indicate GFP+ autophagosomes located in the neurite. *p < 0.05 (Student’s t test). D WT or Bdnf+/− primary cortical neurons (16DIV) were incubated in the presence or absence of BafA1 for the indicated times and the autophagy flux was analyzed by Western blot using p62 antibody. ***p < 0.001 (Kruskal–Wallis test). E WT primary cortical neurons (14–16DIV) were treated with or without BDNF (100 ng/ml) or BafA1 for 6h, and the autophagy flux assays were done (N = 6) using p62 antibody. *p < 0.05 (Mann–Whitney U test). F WT or Bdnf+/− primary cortical neurons (16DIV) were analyzed by Western blot using p62 antibody. *p < 0.05 (Student’s t test). G WT primary cortical neurons (16DIV) were treated with TrkB-Fc (1 μg/ml) in the presence or absence of BafA1 for the indicated times and the autophagy flux was analyzed by Western blot using p62 antibody. ***p < 0.001 (Kruskal–Wallis test). H The medial PFC (layer 2/3) of Bdnf+/− mice and their WT littermates (2–2.5 months of age, N = 4 per genotype) were immunostained with p62 and CaMKII antibodies, and p62 fluorescence intensities in CaMKII+ neurons were scored and plotted in the graph. Scale bar, 10 μm. **p < 0.01 (Kruskal–Wallis test). I Quantitative PCR analysis of autophagy-related genes expressed in PFC of WT and Bdnf+/− mice (2 months of age, N = 3 per genotype). *p < 0.05, **p < 0.01 (Student’s t test).
Fig. 3
Fig. 3. Decreased surface presentation of α5-GABAAR and behavioral deficits in Bdnf+/− mice are rescued by reducing p62 gene dosage.
A Surface biotinylation of primary cortical neurons (16DIV) prepared from WT, Bdnf+/− or Bdnf+/−; p62+/− mice, analyzed by Western blot using the indicated antibodies. Surface levels of expression were normalized by the total levels of expression for each genotype. Surface levels of α5-GABAAR were significantly reduced in Bdnf+/− neurons compared to the other genotypes, whereas those of NR1 subunit of glutamate receptors were equivalent across the three genotypes. The assays were performed in triplicate. *p < 0.05 (Kruskal−Wallis test). B BS3 cross-linking assays using the PFC extracts from WT, Bdnf+/− or Bdnf+/−;p62+/− mice (2–2.5 months of age, N = 4 per genotype). The cross-linking reaction reached a plateau in 2–3 h in our assay conditions. Levels of non-crosslinked α5-GABAAR (~50 kDa) were normalized to levels of α-Tubulin at each time point. Differences in the levels of non-crosslinked α5-GABAAR at a given time point versus those of the control sample (No Xlink: no cross-linker added) represent the amount of surface α5-GABAAR that underwent mobility shift toward a higher molecular weight range due to covalent cross-linking with anonymous cell surface proteins. The calculated surface α5-GABAAR levels (= levels at No Xlink – levels at 3 h Xlink) in Bdnf+/− mice were significantly reduced compared to the other genotypes. *p < 0.05 (Kruskal−Wallis test). See Fig. S4 for cross-linking assays for α1- and α2-GABAARs. C The amplitude of startle response and the percentage of PPI were evaluated for WT, Bdnf+/− and Bdnf+/−; p62+/− mice (2 months of age, N = 10 per genotype). No significant difference in startle response (left panel; F2,27 = 0.378, P = 0.9243, one-way ANOVA). PPI was reduced in Bdnf+/− mice compared to WT mice, and rescued to control levels in Bdnf+/−; p62+/− mice for the prepulse–pulse pair of trials (p82–120 and p86–120 dB) (right panel; F2,27 = 9.775, P < 0.001, two-way ANOVA with repeated measures; *p < 0.05, Bonferroni post-hoc test). D Schematic diagram of the rule shift assay: Mice were habituated to food, feeding apparatus, different odor cues (O1, O2, etc.; e.g., coriander vs. garlic powder) and texture cues (TA, TB, etc.; e.g., fine versus coarse digging media) prior to testing, and then food-deprived a day before the assays. Mice were initially trained in a sequence of trials to associate a food reward with a specific stimulus (i.e., either an odor or a digging medium; a stimulus associated with food reward is shown in red). A varying combination of stimulus and food reward was presented to mice per trial. Eight consecutive correct responses to the food reward were considered reaching criterion (i.e., successful establishment of association between the stimulus and the food reward), and the number of trials to reach criterion were scored for each mouse tested, before and after rule shifting (e.g., from an odor cue to a different texture cue to predict reward). E Numbers of trials to criterion were scored for WT, Bdnf+/− and Bdnf+/−; p62+/- mice (2–2.5 months of age, N = 6 per genotype) during the initial association phase, as well as the rule shift phase of the assays. No significant difference during the initial association phase (F2,15 = 1.25, P = 0.934). Statistical significance during the rule shift phase: F2,15 = 9.93, P < 0.001 (one-way ANOVA); **p < 0.01 (Bonferroni post-hoc test). During the rule shift phase, Bdnf+/− mice made a greater number of perseverative errors than the other genotypes. *p < 0.05, **p < 0.01 (Kruskal–Wallis test).
Fig. 4
Fig. 4. Elevated p62 expression is sufficient to cause downregulation of surface α5-GABAAR expression and behavioral deficits.
A Generation of CaMKII-p62-transgenic mouse lines. Among three lines established, two lines (#1, #3) showed ~60% higher levels of p62 protein expression in thePFC when compared with WT, whereas the line #2 showed no apparent increase in p62 expression. *p < 0.05 (Kruskal–Wallis test). B BS3 cross-linking assays using the PFC extracts from WT, p62-Tg#1 and Tg#2 mice (2–2.5 months of age, N = 4 per genotype). Levels of non-crosslinked α5-GABAAR (~50 kDa) were normalized to levels of α-Tubulin at each time point. Calculated surface α5-GABAAR levels (= levels at No Xlink – levels at 3 h Xlink) in p62-Tg#1 mice were significantly reduced compared to the other genotypes. *p < 0.05 (Kruskal–Wallis test). C The amplitude of startle response and the percentage of PPI were evaluated for WT, p62-Tg#1, p62-Tg#2 and p62-Tg#3 mice (2 months of age, N = 10 per genotype). No significant difference in startle response (F3,36 = 0.726, P = 0.7121, one-way ANOVA). Statistical significance for %PPI; F3,36 = 12.474, P < 0.001 (two-way ANOVA with repeated measures); *p < 0.05 (Bonferroni post-hoc test). D Numbers of trials to criterion were scored for WT (N = 7), p62-Tg#1 (N = 7) and p62-Tg#3 (N = 8) mice (2–2.5 months of age) during the initial association phase, as well as the rule shift phase of the assays. No significant difference during the initial association phase (F2,19 = 1.968, P = 0.936). Statistical significance during the rule shift phase: F2,19 = 12.56, P < 0.001 (one-way ANOVA); **p < 0.01 (Bonferroni post-hoc test). During the rule shift phase, mice from p62-Tg lines #1 and 3 made a greater number of perseverative errors than WT. **p < 0.01 (Kruskal–Wallis test).
Fig. 5
Fig. 5. Two modes of mechanisms underlying GABAergic dysfunction following reduced BDNF signaling.
Reduced BDNF expression or signaling in cortical pyramidal neurons, due to chronic stress or other neuropsychiatric insults, leads to GABA dysfunction through transcriptional suppression of GABA synapse genes in neighboring inhibitory neurons (paracrine mode) [11, 34] and also via reduced surface presentation of α5-GABAAR in pyramidal neurons (autocrine mode), as demonstrated in this study, together contributing to cognitive and other behavioral deficits relevant to neuropsychiatric disorders, including depression and schizophrenia.

Similar articles

Cited by

References

    1. Guilloux JP, Douillard-Guilloux G, Kota R, Wang X, Gardier AM, Martinowich K, et al. Molecular evidence for BDNF- and GABA-related dysfunctions in the amygdala of female subjects with major depression. Mol Psychiatry. 2012;17:1130–42. - PMC - PubMed
    1. Tripp A, Oh H, Guilloux JP, Martinowich K, Lewis DA, Sibille E. Brain-derived neurotrophic factor signaling and subgenual anterior cingulate cortex dysfunction in major depressive disorder. Am J Psychiatry. 2012;169:1194–202. - PMC - PubMed
    1. Castrén E, Kojima M. Brain-derived neurotrophic factor in mood disorders and antidepressant treatments. Neurobiol Dis. 2017;97:119–26. - PubMed
    1. Knable MB, Barci BM, Webster MJ, Meador-Woodruff J, Torrey EF, Stanley Neuropathology Consortium Molecular abnormalities of the hippocampus in severe psychiatric illness: postmortem findings from the Stanley Neuropathology Consortium. Mol Psychiatry. 2004;9:609–20. - PubMed
    1. Dunham JS, Deakin JFW, Miyajima F, Payton A, Toro CT. Expression of hippocampal brain-derived neurotrophic factor and its receptors in Stanley consortium brains. J Psychiatr Res. 2009;43:1175–84. - PubMed

Publication types