. 2021 Nov;14(6):1323-1334.
doi: 10.1038/s41385-021-00432-4. Epub 2021 Aug 2.

mTOR signaling mediates ILC3-driven immunopathology

Affiliations

mTOR signaling mediates ILC3-driven immunopathology

Claudia Teufel et al. Mucosal Immunol. 2021 Nov.

Abstract

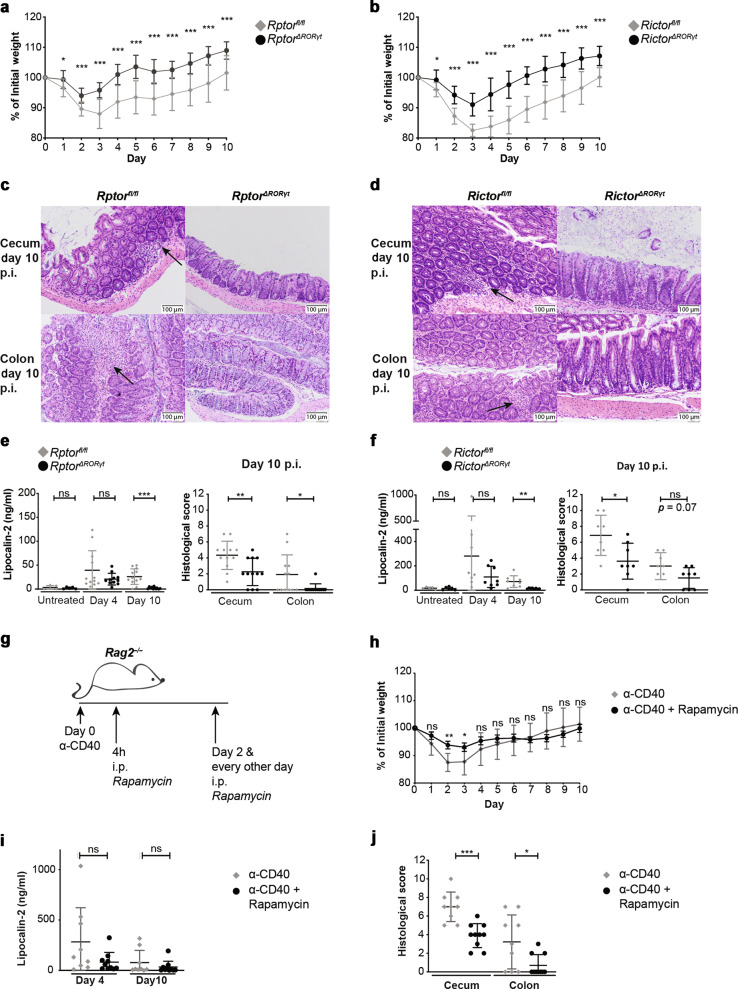
Innate lymphoid cells (ILCs) have a protective immune function at mucosal tissues but can also contribute to immunopathology. Previous work has shown that the serine/threonine kinase mammalian target of rapamycin complex 1 (mTORC1) is involved in generating protective ILC3 cytokine responses during bacterial infection. However, whether mTORC1 also regulates IFN-γ-mediated immunopathology has not been investigated. In addition, the role of mTORC2 in ILC3s is unknown. Using mice specifically defective for either mTORC1 or mTORC2 in ILC3s, we show that both mTOR complexes regulate the maintenance of ILC3s at steady state and pathological immune response during colitis. mTORC1 and to a lesser extend mTORC2 promote the proliferation of ILC3s in the small intestine. Upon activation, intestinal ILC3s produce less IFN-γ in the absence of mTOR signaling. During colitis, loss of both mTOR complexes in colonic ILC3s results in the reduced production of inflammatory mediators, recruitment of neutrophils and immunopathology. Similarly, treatment with rapamycin after colitis induction ameliorates the disease. Collectively, our data show a critical role for both mTOR complexes in controlling ILC3 cell numbers and ILC3-driven inflammation in the intestine.


Conflict of interest statement

The authors declare no competing interests.

Figures

Fig. 1
Fig. 1. ILC3 subsets in Rag2−/− mice depend on mTORC1 and mTORC2 signaling in vivo.
Cells were isolated from SI LP of RptorΔRORγt (b, d) or RictorΔRORγt (c, e) mice and age-matched littermates. a Pre-gating for ILCs. Lin: CD3, CD8, CD11c, CD19, B220, Gr-1, TCRβ, TCRγδ, and Ter-119. b, c Exemplary dot plots of ILC3 subsets in the SI. The ILC3 subset (blue-marked gate, upper panel) was separated into CD4+, NCR, and NCR+ ILC3 subsets (lower panel). d, e Total ILC3 numbers and numbers of CD4+, NCR, and NCR+ ILC3s in the SI. n = 13–18, 6–8 independent experiments. fh Cells were isolated from the tibia and femur of one hind leg of RptorΔRORγt (g) or RictorΔRORγt (h) mice and age-matched littermates and analyzed for the number of common lymphoid progenitors (CLPs), common helper ILC progenitors (CHILPs), and ILC2 progenitors (ILC2ps). n = 7–8, 4 independent experiments. f Gating strategy for hematopoietic progenitors. Lin: CD3, CD8, CD11c, CD19, B220, Gr-1, NK1.1, TCRβ, TCRγδ, and Ter-119. g, h Total numbers of CLPs, CHILPs, and ILC2ps in indicated mouse strains. i, j Total ILC3 numbers and numbers of CD4+, NCR and NCR+ ILC3s in the cLP of RptorΔRORγt (i) or RictorΔRORγt (j) mice and age-matched littermates. n = 8–12, 4 independent experiments. ns not significant; *p ≤ 0.05; **p ≤ 0.01; ***p ≤ 0.001, calculated with two-tailed unpaired Student’s t test or Mann–Whitney U test. Bars represent mean ± SD.
Fig. 2
Fig. 2. Competitive reconstitution of ILC3s in bone marrow chimeras depends on mTOR signaling.
a Bone marrow chimera model: BM from Rag2−/−Ly5.1+ mice was mixed in a 1:1 ratio with BM from either RptorΔRORγt mice (b, e, g, i), RictorΔRORγt (c, f, h, j) mice or littermates, respectively. Five weeks after transplantation, mice were sacrificed. Cell were extracted from the SI LP, the cLP and the tibia and femur of one hind leg (BM). b, c Percentage of Ly5.2+Ly5.1 CLPs, CHILPs, and ILC2ps in the BM was determined by flow cytometry. d, e Exemplary dot plots for Ly5.1 and Ly5.2 within ILC3 population. ILC3s were gated as LinCD90.2+KLRG1RORγt+ (See Fig. 1). f Gating strategy for donor-derived ILCs for gj. Lin: CD3, CD8, CD11c, CD19, B220, Gr-1, TCRβ, TCRγδ, and Ter-119. Percentage of Ly5.2+ cell within donor-derived ILC3s was determined in the SI (g, h) and colon (i, j). n = 7–10 mice from 2 to 3 independent experiments. ns not significant; *p ≤ 0.05; **p ≤ 0.01; ***p ≤ 0.001, calculated with two-tailed unpaired Student’s t test or Mann–Whitney U test. Bars represent mean ± SD.
Fig. 3
Fig. 3. Disruption of mTOR signaling impairs ILC3 proliferation in vivo.
Cells were isolated from the SI LP and cLP of RptorΔRORγt (a) or RictorΔRORγt (b) mice and age-matched littermates. a, b Exemplary dot plots of SI and colonic ILC3s. Percentage of Ki-67+ ILC3s and ILC3s positive for active Caspase-3 was determined by flow cytometry. ILC3s were gated as shown in Fig. 1. n = 10–12, 3–4 independent experiments. RptorΔRORγt (c) or RictorΔRORγt (d) mice and littermates were injected with one single dose of IL-2/α-IL-2 complex. After 1 day, cells from the SI LP and cLP were isolated and the percentage of Ki-67+ ILC3s was analyzed by flow cytometry. Exemplary dot plots from the SI of untreated and treated animals are shown on the left side. ILC3s were gated as shown in Fig. 1. n = 7 mice from 2 to 3 independent experiments. ns not significant; **p ≤ 0.01; ***p ≤ 0.001, calculated with two-tailed unpaired Student’s t test or Mann–Whitney U test. Bars represent mean ± SD.
Fig. 4
Fig. 4. Loss of mTORC1 and mTORC2 signaling impairs activation-induced cytokine secretion.
LinCD90.2+KLRG1 ILC3s were sorted from the SI of RptorΔRORγt (a, c) or RictorΔRORγt (b, d) mice and control littermates and stimulated with 20 ng/ml IL-23 and IL-1β for 17 h (a, b) or for 2 days (c, d). The sorting strategy is depicted in Supplementary Fig. 5a. a, b Phosphorylation of mTOR, mTORC1-target site in S6 protein and mTORC2-target site in Akt was determined by phospho flow analysis. Depicted histograms (modal view) are representative of 4–6 independent experiments. Indicated values represent the geometric mean fluorescence intensity. c, d Intracellular IL-22 and IFN-γ was measured by flow cytometry. For each experiment, cells from 1 to 3 mice per group were pooled. n = 6 independent experiments. e, f LinCD90.2+KLRG1 SI WT ILC3s were sorted and cultured with 20 ng/ml IL-23 and IL-1β or medium. Where indicated, 10 nM rapamycin (e) or 1 μM PP242 (f) was added. After 2 days, cells were stained for IL-22 and IFN-γ. For each experiment, cells from 8 to 10 mice were pooled. n = 4 independent experiments. LinCD90.2+KLRG1 ILC3s were sorted from the SI of RptorΔRORγt (g) or RictorΔRORγt (h) mice and control littermates and cultured with 20 ng/ml IL-23 and IL-1β for 17 h. Phosphorylation of STAT3 and STAT4 was determined by phospho flow analysis. Depicted histograms (modal view) are representative of 3–6 independent experiments. Indicated values represent the geometric mean fluorescence intensity. Lin: CD3, CD8, CD11c, CD19, B220, Gr-1, NK1.1, TCRβ, TCRγδ, and Ter-119. ns not significant; *p ≤ 0.05; **p ≤ 0.01; ***p ≤ 0.001, calculated with two-tailed unpaired Student’s t test or one-way ANOVA with multiple comparison test (Bonferroni). Bars represent mean ± SD.
Fig. 5
Fig. 5. mTOR-deficiency in ILC3s protects from α-CD40-induced colitis.
RptorΔRORγt (a, c, e) or RictorΔRORγt (b, d, f) mice and age-matched littermates were left untreated or were injected with a single dose of 140 μg α-CD40 Ab. n = 8–12 mice from 2 to 3 independent experiments. Weight was monitored daily (a, b). Mice were sacrificed 10 days post injection. The colon and the cecum were sectioned and stained with hematoxylin and eosin. Exemplary histology picture from the cecum and colon are depicted (c, d). Arrows indicate lymphocyte invasions. e, f At days 4 and 10, fecal Lipocalin-2 was determined from feces pellets diluted in PBS using ELISA. Histological colitis score was determined. g Rag2−/− mice were left untreated or were injected with a single dose of 140 μg α-CD40 Ab. 4 h after α-CD40 Ab injection mice received 2.5 mg/kg rapamycin. Rapamycin injections were repeated at day 2 and every other day. h Weight was monitored daily. n = 8–10 mice. i At days 4 and 10, fecal Lipocalin-2 was determined from feces pellets diluted in PBS using ELISA. n = 9–10 mice of three independent experiments. j Mice were sacrificed 10 days post injection. The colon and the cecum were sectioned and stained with hematoxylin and eosin. Histological colitis score was determined. n = 7–10 mice of three independent experiments. ns not significant; *p ≤ 0.05; **p ≤ 0.01; ***p ≤ 0.001, calculated with two-tailed unpaired Student’s t test or Mann–Whitney U test. Bars represent mean ± SD.
Fig. 6
Fig. 6. Impaired cytokine secretion and neutrophil infiltration in colonic tissue by deletion of either Rptor or Rictor in ILC3s.
a, c, e, g, i RptorΔRORγt or b, d, f, h, j RictorΔRORγt mice and age-matched littermates were left untreated or received a single dose of 140 μg α-CD40 Ab. Mice were sacrificed 3 days post injection. a, b cLPs cells were isolated and cultured overnight. Concentrations of IFN-γ, IL-22, TNF, GM-CSF, IL-17A, and IL-17F in the supernatant were measured and normalized to 1 × 106 cLPs cell count. n = 7 mice of 2–3 independent experiments. cf cLP cells were cultured overnight. IFN-γ expression of ILC3s (c, d) and ILC1s (e, f) was analyzed by flow cytometry. ILC1 and ILC3s were gated as depicted in Fig. S5a. n = 6–10 mice from four independent experiments (ILC3) and n = 4 mice from two independent experiments (ILC1). g, h Colonic neutrophils were analyzed by flow cytometry at day 3 after α-CD40 Ab injection. Total neutrophil counts are depicted. Neutrophils were gated as depicted in Fig. S5b. n = 6–11 mice from 2 to 4 independent experiments. i, j cLP cells were cultured overnight and analyzed by flow cytometry. IFN-γ expression of neutrophils was analyzed by flow cytometry. Neutrophils were gated as depicted in Fig. S5a. n = 6–10 mice from four independent experiments ns not significant; *p ≤ 0.05; **p ≤ 0.01; ***p ≤ 0.001, calculated with two-tailed unpaired Student’s t test or Mann–Whitney U test. Bars represent mean ± SD.

References

    1. Spits H, et al. Innate lymphoid cells-a proposal for uniform nomenclature. Nat. Rev. Immunol. 2013;13:145–149. doi: 10.1038/nri3365. - DOI - PubMed
    1. Sun Z, et al. Requirement for RORgamma in thymocyte survival and lymphoid organ development. Science. 2000;288:2369–2373. doi: 10.1126/science.288.5475.2369. - DOI - PubMed
    1. Eberl G, et al. An essential function for the nuclear receptor RORgamma(t) in the generation of fetal lymphoid tissue inducer cells. Nat. Immunol. 2004;5:64–73. doi: 10.1038/ni1022. - DOI - PubMed
    1. Cella M, et al. A human natural killer cell subset provides an innate source of IL-22 for mucosal immunity. Nature. 2009;457:722–725. doi: 10.1038/nature07537. - DOI - PMC - PubMed
    1. Cupedo T, et al. Human fetal lymphoid tissue-inducer cells are interleukin 17-producing precursors to RORC+ CD127+ natural killer-like cells. Nat. Immunol. 2009;10:66–74. doi: 10.1038/ni.1668. - DOI - PubMed

Publication types

MeSH terms