. 2021 Aug;3(8):1071-1090.
doi: 10.1038/s42255-021-00432-5. Epub 2021 Aug 2.

Leptin brain entry via a tanycytic LepR-EGFR shuttle controls lipid metabolism and pancreas function

Affiliations

Leptin brain entry via a tanycytic LepR-EGFR shuttle controls lipid metabolism and pancreas function

Manon Duquenne et al. Nat Metab. 2021 Aug.

Abstract

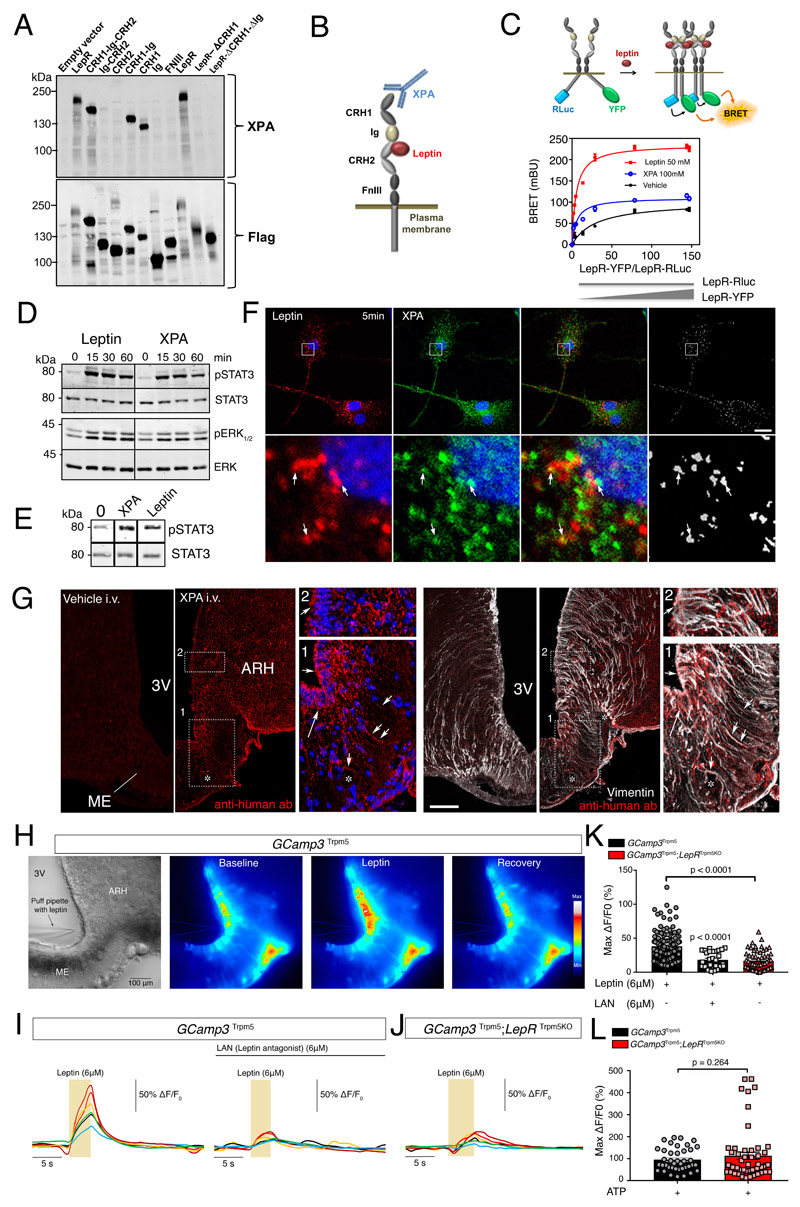
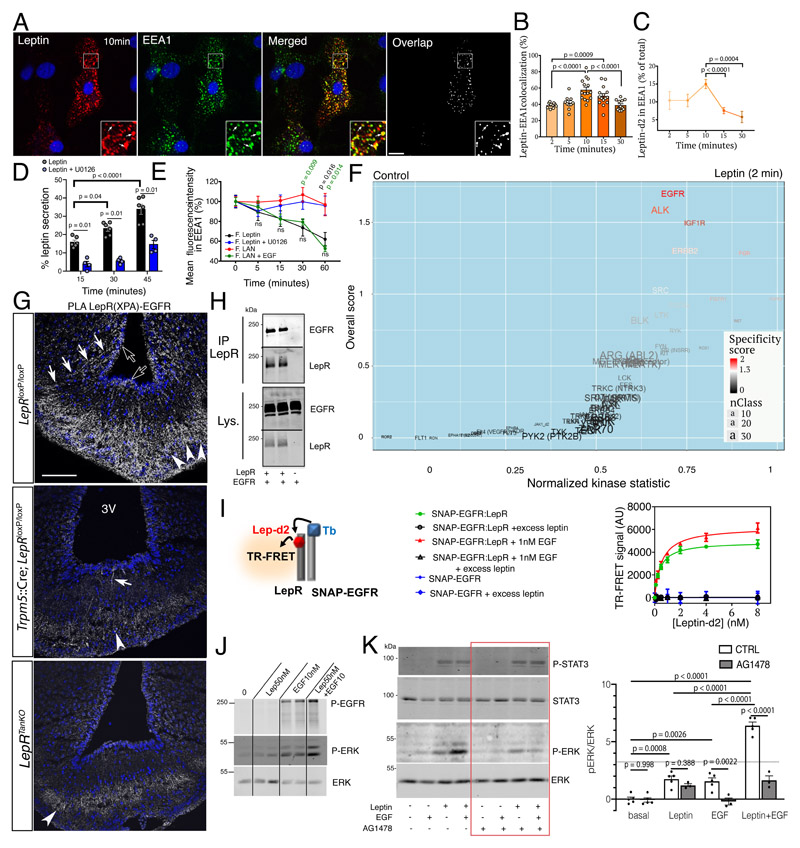
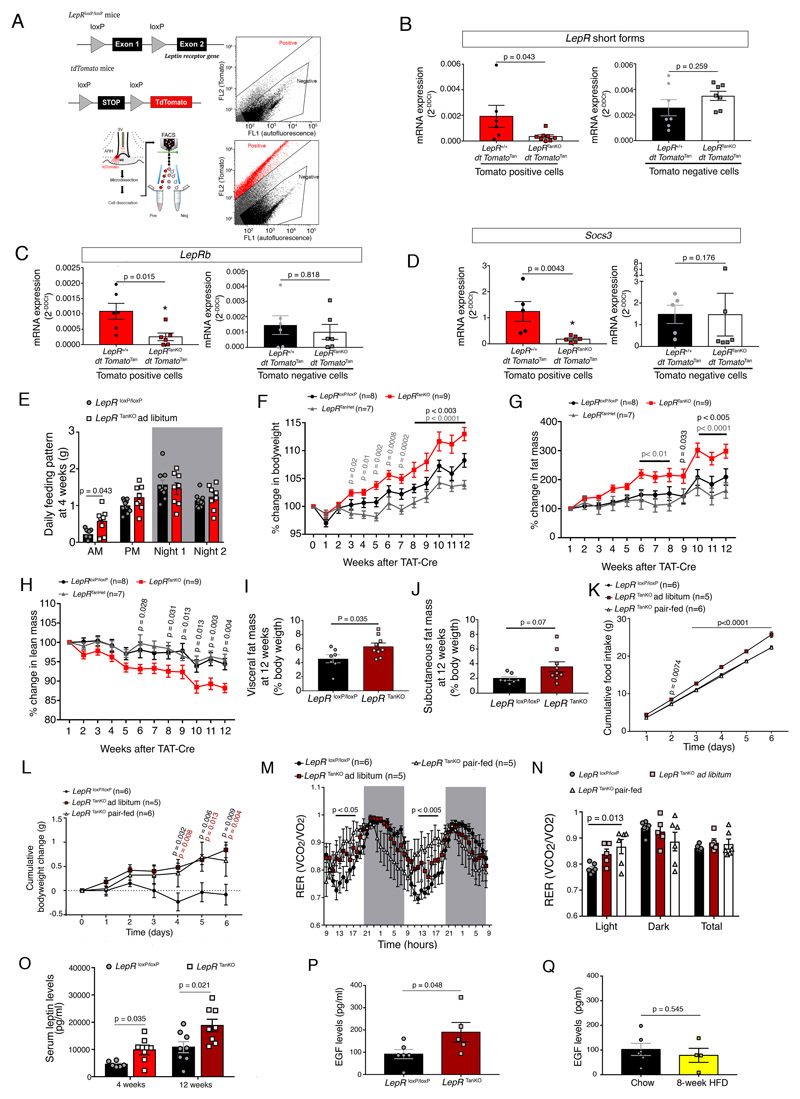
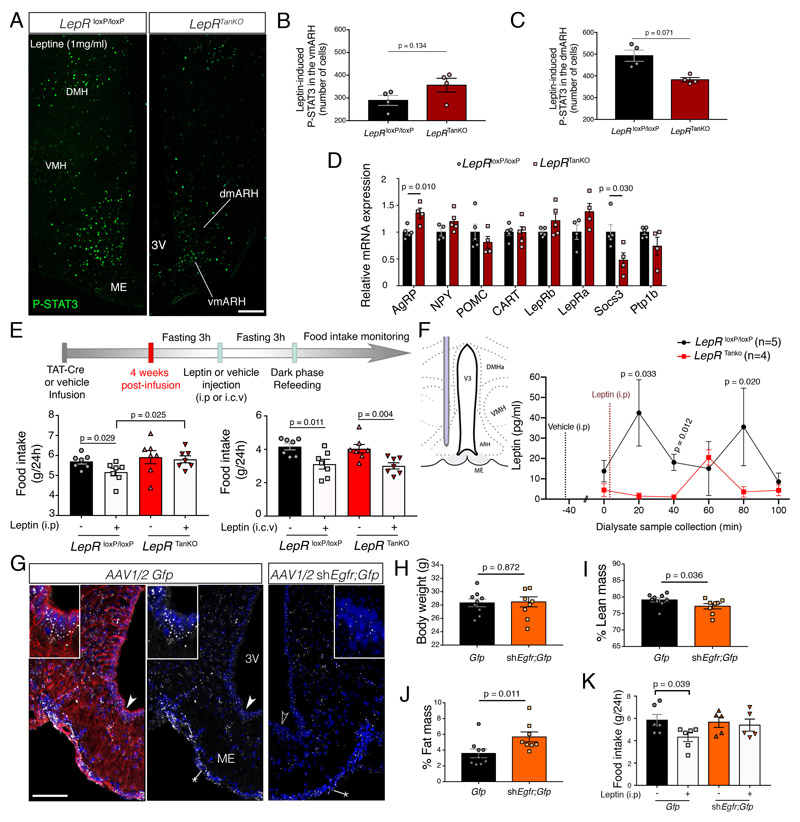
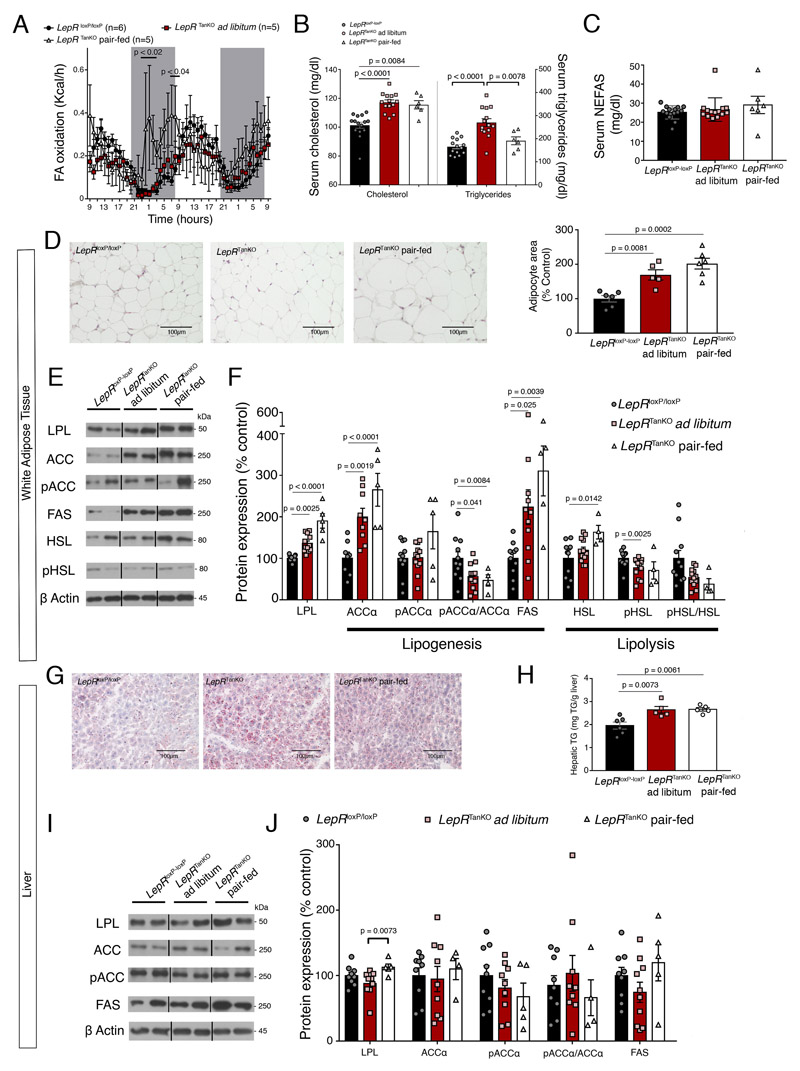
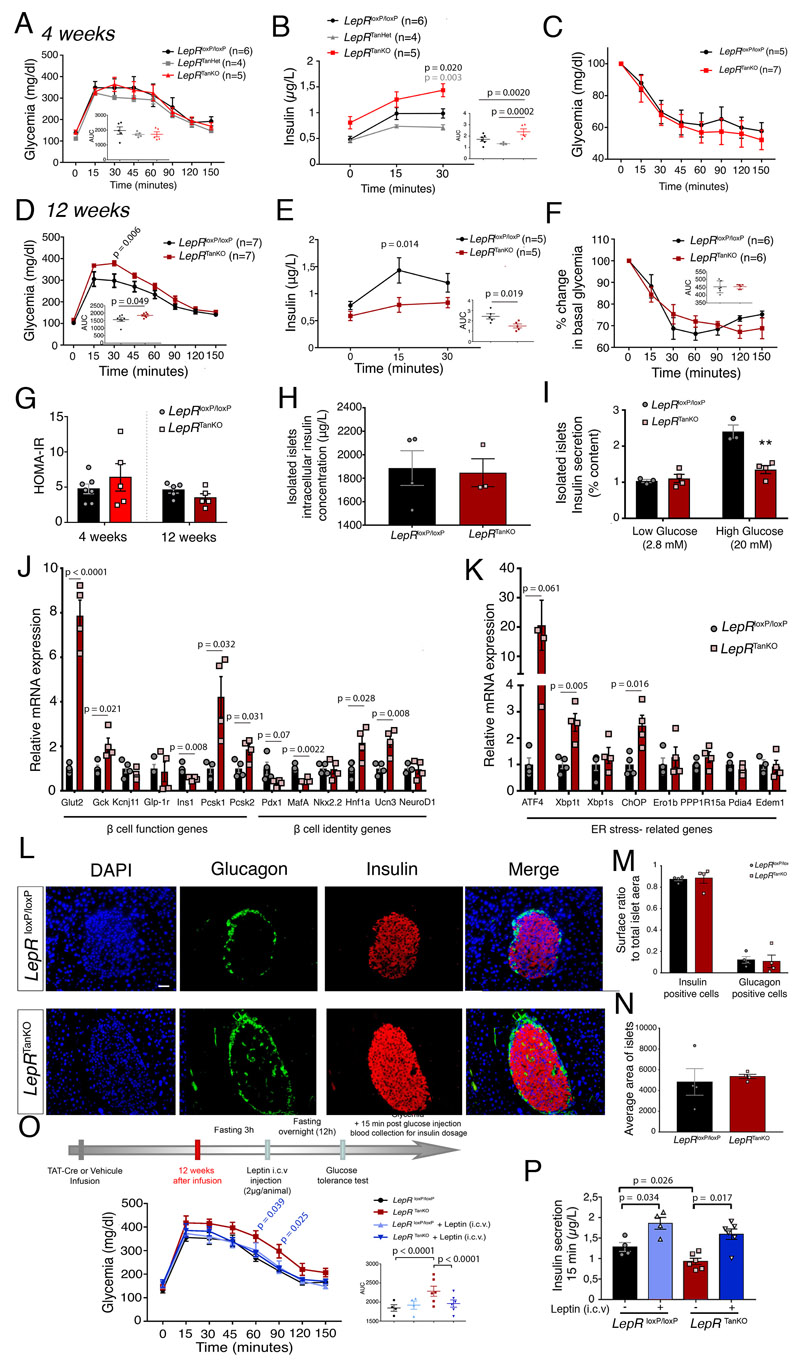
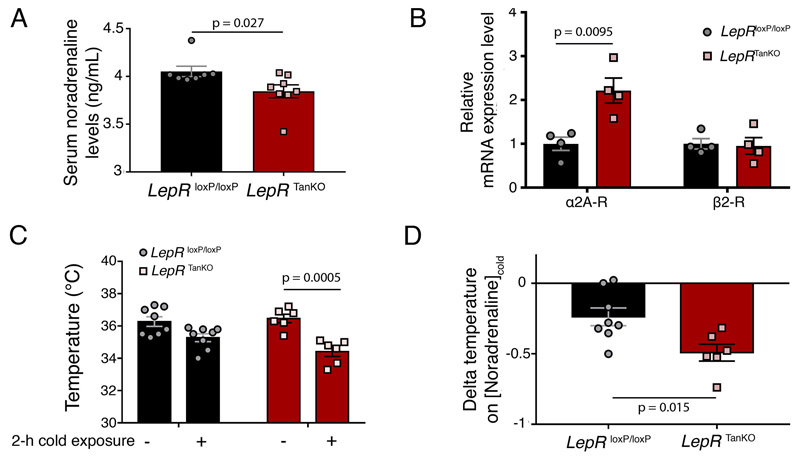
Metabolic health depends on the brain's ability to control food intake and nutrient use versus storage, processes that require peripheral signals such as the adipocyte-derived hormone, leptin, to cross brain barriers and mobilize regulatory circuits. We have previously shown that hypothalamic tanycytes shuttle leptin into the brain to reach target neurons. Here, using multiple complementary models, we show that tanycytes express functional leptin receptor (LepR), respond to leptin by triggering Ca2+ waves and target protein phosphorylation, and that their transcytotic transport of leptin requires the activation of a LepR-EGFR complex by leptin and EGF sequentially. Selective deletion of LepR in tanycytes blocks leptin entry into the brain, inducing not only increased food intake and lipogenesis but also glucose intolerance through attenuated insulin secretion by pancreatic β-cells, possibly via altered sympathetic nervous tone. Tanycytic LepRb-EGFR-mediated transport of leptin could thus be crucial to the pathophysiology of diabetes in addition to obesity, with therapeutic implications.


Conflict of interest statement

Competing Interets

The authors have no competing interests to declare.

Figures

Figure 1
Figure 1. Tanycytes of the median eminence express functional leptin receptors
(A) Representative Western blot detection using the XPA antibody of different exogenously expressed LepR domains in HEK293 cells. Experiments were repeated at least twice. (B) Schematic representation of leptin receptor domains and the XPA binding site. (C) Top: schematic representation of the BRET assay to study the ligand-induced conformational change/interaction between LepR-Rluc and LepR-YFP. Bottom: BRET donor saturation curves in HEK293T cells with a constant expression level of LepR-Rluc and increasing levels of LepR-YFP, upon stimulation with vehicle, leptin (50nM) or XPA (100nM) for 30 min at 37?°C. (D) STAT3 and ERK1/2 phosphorylation in HEK293 cells stably expressing LepR after stimulation with 50 nM leptin or 100 nM XPA for 5, 15, 30 or 60 minutes. Representative Western blot out of at least 2 independent experiments. (E) STAT3 phosphorylation in tanycytes upon 50 nM leptin or 100 nM XPA stimulation for 30 minutes. Representative Western blot out of 2 independent primary cultures of tanycytes. (F) Leptin colocalizes with LepR in primary tanycytes. Representative confocal images of tanycytes treated for 5 min with 125 nM fluorescent leptin (red) together with 33 nM XPA antibodies against LepR labeled with fluorescent secondary antibodies (green). The extent of colocalization is represented by the mask on the right. Arrows point to examples of colocalized pixels. Scale bar: 10 μm. Experiments were repeated in 2 independent primary cultures of tanycytes. (G) Representative photomicrograph revealing sites of XPA fixation in tanycytes of the median eminence (vimentin-positive cells) 2 minutes after intravenous XPA injection (2 nmol/animal) in vivo (n=3 mice per group). White arrows show XPA (red) and vimentin (white) colocalization. 3V: third ventricle; ARH: arcuate nucleus of the hypothalamus; ME: median eminence. Scale bar: 200μm. (H) Representative image of a living brain slice containing the median eminence from a GCamp3 Trpm5 mouse under bright-field and fluorescence microscopy, showing the reversible increase in intracellular calcium levels in tanycytic cell bodies lining the third ventricle (3V) upon the local application of a puff of leptin (6μM) via a glass pipette. The experiment was repeated in 5 mice. ME: median eminence. Scale bar: 100 μm (I) Representative curves of GCamp3 fluorescence (calcium current) over time (Delta T) compared to the baseline in tanycytes in living hypothalamic slices during a puff of leptin (yellow rectangle, 6uM), alone (left curve) or after pre-treatment with leptin antagonist (LAN, 6μM, top black line; right curve), in a GCamp3 Trpm5 mouse. (J) Same measurement as in (I) in a GCamp3 Trpm5; LepR Trpm5 mouse lacking LepR in tanycytes after a puff of leptin (6μM, yellow rectangle). (K) Graph representing maximum difference in calcium concentration from baseline during the treatment of living brain slices in GCamp3 Trpm5 and GCamp3 Trpm5; LepR Trpm5 mice, described in (I) and (J). Krustal Wallis with Dunn’s; N=5 (GCamp3 Trpm5 + leptin), 3 (GCamp3 Trpm5 + LAN and leptin) and 4 (GCamp3 Trpm5; LepR Trpm5) mice; each dot represents one cell (n=146,28,58). Values indicate means ± SEM. (L) Graph representing maximum c difference in calcium concentration from baseline during a puff of ATP (10 mM) in living brain slices from GCamp3 Trpm5 and GCamp3 Trpm5; LepR Trpm5 mice. Mann-Whitney test; N=3 mice per condition; each dot represents one cell (n=40,53). Values indicate means ± SEM. See also Supplementary Figure 1.
Figure 2
Figure 2. Tanycytic EGFR physically interacts with LepR in vivo and plays a role in leptin trancytosis in vitro
(A) Endocytosed leptin colocalizing with early endosomes. Representative confocal images showing primary tanycytes treated for 10 min with 125 nM fluorescent leptin (red) and antibodies to the early endosome marker EEA1 (green). The extent of colocalization is represented by the mask on the right. Arrows in inset point to examples of colocalized pixels. Scale bar: 10μm. (B) Percentage of leptin colocalizing with EEA1 over time following object-based detection of fluorescent leptin and EEA1 vesicles. Mann-Whitney test. n=10,10,15,15,12 cells as shown by individual dots from at least 2 independent primary cultures. Values represent means ± SEM. (C) Percentage of endocytosed leptin found in the EEA1-positive compartment over time. Mann-Whitney test. n=11,11,15,13,9 cells at 2,5,10,15 and 30 min, respectively, from at least 2 independent primary cultures. Values represent means ± SEM. (D) Leptin secreted into the medium by primary cultures of tanycytes as a percentage of total leptin concentration (intracellular and medium) 15, 30 and 45 minutes after fluorescent leptin addition. One-way ANOVA and Tukey’s test. n=4 and 6 wells cells as shown by individual dots from at least 2 independent primary cultures. Values represent means ± SEM. (E) Percentage (as % of 0 min time point) of endocytosed fluorescent leptin or fluorescent LAN found in EEA1 compartments over time in cells treated or not with U0126 (leptin) or EGF (LAN). Mann-Whitney test. n=18,19,17,14,14 (leptin), 30,28,31,22,12 (LAN), 15,8,7,8,9 (Leptin+U0126) 15,13,14,13,10 (LAN+EGF) at 0,5,15,30,60 min, respectively, from at least 2 independent primary cultures. Values represent means ± SEM. (F) Volcano plot showing differences in peptide phosphorylation between primary cultures of tanycytes treated for 2 min with vehicle (PBS pH 8.0) or leptin (1 μg/ml in PBS pH 8.0) (n=4 wells per condition). See also corresponding Source Data Files (Extended data Table 1 and 2). (G) Proximity Ligation Assay (PLA) between LepR and EGFR using XPA and a rabbit anti-EGFR antibody. PLA signal is seen in tanycytic cell bodies (empty arrows), processes (white arrows) and end-feet in the external zone of the median eminence, where they contact the fenestrated endothelium of the pituitary portal circulation (arrowheads). Scale bar: 100 μm. (H) Co‐immunoprecipitation of EGFR along with LepR in HEK293T cells; no co-immunoprecipitation of EGFR is observed when LepR is not expressed. IP, immunoprecipitation; Lys., cell lysate. (I) Schematic representation of the TR-FRET technique (left). Right: specific saturation curves of leptin-d2 binding to its cognate receptor LepR within the LepR:SNAP-EGFR complex at the cell surface are obtained after 3h at 37°C. Data are presented as means ± SD of 3 replicates of 1 representative experiment out of 3 independent experiments. (J) Phosphorylation of EGFR and ERK upon addition of leptin 50nM, EGF 10nM or both for 30min at 37°C in primary tanycytes. (K) Phosphorylation of STAT3 and ERK upon addition of leptin 10nM, EGF 1nM or both for 30min at 37°C in HEK293T cells expressing endogenous EGFR and transfected with LepRb in the presence or absence of the EGFR inhibitor AG1478 (1μM). Two-way ANOVA and Sidak’s multiple comparison. n=5,5,3,5,3,5,3 wells as shown by individual dots from 2 independent experiments.
Figure 3
Figure 3. Selective LepR deletion in tanycytes causes food-intake-independent body weight gain and increased adiposity
(A) Schematic diagram and gating strategy for sorting Tomato positive cells following vehicle (top panel) and TAT-Cre infusion (bottom panel) into the third ventricle (3V) of LepR +/+;tdTomatol oxP-STOP-loxP or LepR loxP/loxP;tdTomato loxP-STOP-loxP littermates. (B-D) mRNA expression levels of short forms (B) and the long form, LepRb (C), of the leptin receptor, and of Socs3 (D) in tdTomato-positive cells (left panels) and tdTomato-negative cells (right panels). A two-sided unpaired Student t-test or Mann-Whitney U test was applied, depending on Shapiro-Wilk normality test results. Values indicate means ± SEM. Each dot represents a mouse (n=6,8,7,7 in B, 6,6,6,6 in C, 5,6,5,6 in D). (E) Food intake pattern (daily average of automatic measurements in metabolic cages over 24h), showing an increase at lights-on in LepR TanKO mice when compared to LepRl oxP/loxP littermates. The night was divided in two 6h time slots (Night 1 and Night 2). Two-sided unpaired t-tests. Values indicate means ± SEM. Each dot represents a mouse (n=10,8). (F-H) Curves representing the kinetics of the % change in body weight (F), % change in fat mass (G) and % change in lean mass (H) between LepR loxP/loxP, LepR TanHet and LepR TanKO through the 12 weeks following the TAT-Cre infusion into the 3V. Two-way ANOVA with Tukey’s correction; Values represent means ± SEM; n indicates the number of mice. (I,J) Visceral fat mass (I) and subcutaneous (J) 12 weeks after TAT-Cre infusion. Mann-Whitney U test. Values indicate means ± SEM. Each dot represents a mouse (n=7,9). (K) Cumulative food intake in LepR TanKO pair-fed mice 12 weeks after TAT-Cre infusion compared to their control littermates. Two-way ANOVA with Tukey’s correction. Values indicate means ± SEM; n indicates the number of mice. (L) Cumulative body weight change. Two-way ANOVA with Tukey’s correction. Values indicate means ± SEM; n indicates the number of mice. (M) Energy ratio (RER) over time. Two-way ANOVA with uncorrelated Fisher’s LSD test. Values indicate means ± SEM; n indicates the number of mice. (N) Mean energy ratio (RER) during light phase, dark phase and total.Two-way ANOVA with Tukey’s correction. Values indicate means ± SEM. Each dot represents a mouse (n=6,5,5). (O) Circulating leptin levels in LepRloxP/loxP and LepRTanKO animals at 4 weeks and 12 weeks after TAT-Cre infusion into the 3V. Mann-Whitney test (4 weeks) and two-sided unpaired t-test (12 weeks). Values represent means ± SEM. Each dot represents a mouse (n=6,7,8,8). (P) Basal serum EGF concentrations in LepR loxP/loxP and LepR TanKO mice, 12 weeks after TAT-Cre infusion. Mann-Whitney U test. Values represent means ± SEM. Each dot represents a mouse (n=6,5). (Q) Basal serum EGF concentrations in C57Bl/6J mice fed normal chow or those fed a high-fat diet for 8 weeks. Mann-Whitney U test. Values represent means ± SEM. Each dot represents a mouse (n=6,5).
Figure 4
Figure 4. Defective LepR and EGFR signaling in tanycytes causes hypothalamic resistance to circulating leptin.
(A-C) Representative photomicrograph (A) and quantification of leptin-induced P-STAT3 immunofluorescence in the ventromedial (vm) (B) and dorsomedial (dm) arcuate nucleus (ARH) (C). Scale bar: 200μm. Two-sided unpaired Student’s t-test. Values indicate means ± SEM. Each dot represents a mouse (n=4,4). (D) Relative mRNA expression levels of several genes known to be involved in the hypothalamic regulation of energy homeostasis and leptin activity in the microdissected mediobasal hypothalamus (MBH) of LepR loxP/loxP and LepR TanKO mice, 12 weeks after TAT-Cre infusion. Student’s t-test or Mann-Whitney U test, depending on Shapiro-Wilk normality test results. Values indicate means ± SEM. Each dot represents a mouse (n=5,4). (E) Schematic diagram showing the design of the experiment investigating the anorectic response to either intraperitoneal (i.p) or intracerebroventricular (i.c.v) leptin administration. Bottom left graph represents food intake in LepR loxP/loxP (black and grey bars) and LepR TanKO mice (red and pink bars) 24h after i.p. leptin (3mg/kg, grey and pink bars) or vehicle (PBS pH 8.0, black and red bars) administration. Bottom right graph represents food intake in LepR loxP/loxP and LepR TanKO mice 24h after i.c.v. leptin (2μg in 2μL) or vehicle (2μL PBS pH 8.0) injection. Mann-Whitney U test; Values indicate means ± SEM. Each dot represents a mouse (n=7 per group). (F) Leptin concentrations in the ARH interstitial liquid collected by microdialysis every 20 minutes following i.p. vehicle (t-40 min) or leptin (t-1 min) injection in LepR loxP/loxP (n= 7) and LepR TanKO mice (n=6). Two-way ANOVA followed by Fisher’s LSD post hoc test analysis was applied; Values indicate means ± SEM; n indicates the number of mice. (G) Representative photomicrograph of in situ hybridation of EGFR in the median eminence using RNAscpe technology from mice injected with AAV1/2 Dio2::gfp or AAV(1+2)-GFP-U6-m-EGFR-shRNA. The experiment was performed in 3 animals per condition. The left panel shows vimentin-immunoreactivity in red. Arrowheads show the cells seen at higher magnification in insets. Scale bar: 100μm (25 μm in inset). (H-J) Curves representing the evolution of body weight (H), % change in fat mass (I) and % change in lean mass (J) between mice injected with AAV1/2 Dio2::gfp (control in black) or AAV(1+2)-GFP-U6-m-EGFR-shRNA (in orange) over 4 weeks following the beginning of the viral activity. Two-way ANOVA with Tukey’s correction. Values indicate means ± SEM; each dot represents a mouse (n=9,8). (K) Graph representing food intake in mice injected with AAV1/2 Dio2::gfp or AAV(1+2)-GFP-U6-m-EGFR-shRNA 24h after i.p. leptin (1mg/kg) or vehicle (PBS pH 8.0) injection. An two-sided unpaired t-test was applied. Values indicate means ± SEM; each dot represents a mouse (n=6 per group).
Figure 5
Figure 5. Selective LepR deletion in tanycytes causes hyperlipidemia and steatosis
(A) Fatty-acid (FA) oxidation over time. 2-way ANOVA with uncorrelated Fisher’s LSD test. Values indicate means ± SEM; n indicates the number of mice. (B) Graphs representing serum cholesterol and triglyceride concentrations in LepR loxP/loxP and LepR TanKO mice fed ad libitum on chow and LepR TanKO mice pair-fed with LepR loxP/loxP mice, 12 weeks after TAT-Cre infusion. One-way ANOVA with Tukey multiple comparison test or Kruskal-Wallis test with Dunn multiple comparison test were applied depending Shapiro-Wilk normality test results. Values indicate means ± SEM; each dot represents a mouse (n=15,14,6,14,14,6). (C) Graph representing serum non-esterified fatty acid (NEFAS) concentrations in LepR loxP/loxP and LepR TanKO mice fed ad libitum on chow and LepR TanKO mice pair-fed with LepR loxP/loxP mice, 12 weeks after TAT-Cre infusion. One-way ANOVA with Tukey multiple comparison test. Values indicate means ± SEM; each dot represents a mouse (n=15,14,6). (D) Representative images of histological hematoxylin-eosin staining of the adipose tissue in LepR loxP/loxP and LepR TanKO mice fed ad libitum on chow and LepR TanKO mice pair-fed with LepR loxP/loxP mice illustrating quantifications in the graph. Graph shows quantification of adipocyte size. One-way ANOVA with Tukey multiple comparison test. Values indicate means ± SEM; each dot represents a mouse (n=6,5,6). (E) Representative western blots of the different proteins mentioned in (F). (F) Graph representing protein expression levels of several proteins implicated in fatty acid synthesis or fatty acid lipolysis in white adipose tissue from LepR loxP/loxP and LepR TanKO mice, 12 weeks after TAT-Cre infusion. Lipoprotein lipase (LPL) is implicated in the lipids uptake from the circulation to the adipose tissue. One-way ANOVA with Tukey multiple comparison test or Kruskal-Wallis test with Dunn multiple comparison test. Values indicate means ± SEM; each dot represents a mouse (n=11,12,5). (G) Representative Oil-Red-stained images from the liver of LepR loxP/loxP and LepR TanKO mice fed ad libitum and LepR TanKO mice pair-fed with LepR loxP/loxP mice illustrating quantifications in H. (H) Quantification of triglycerides in the liver of LepR loxP/loxP and LepR TanKO mice fed ad libitum and LepR TanKO mice paired-fed with LepR loxP/loxP mice. One-way ANOVA with Tukey multiple comparison test. Values indicate means ± SEM; each dot represents a mouse (n=6,5,5). (I) Representative western blots of the different proteins mentioned in (J). (J) Graph representing protein expression levels of several proteins implicated in fatty acid synthesis and lipid uptake from the circulation into the liver in LepR loxP/loxP and LepR TanKO mice fed ad libitum and LepR TanKO mice paired-fed with LepR loxP/loxP mice, 12 weeks after TAT-Cre infusion. One-way ANOVA with Tukey multiple comparison test. Values indicate means ± SEM; each dot represents a mouse (n=9,10,4).
Figure 6
Figure 6. Loss of LepR expression in median eminence tanycytes causes severe pancreatic β cell dysfunction possibly due to defective noradrenaline activity
(A) Curve representing glycemia during a glucose tolerance test in LepR loxP/loxP, LepR TanHet and LepR TanKO mice, 4 weeks after TAT-Cre infusion. Graph represents the area under the curve; two-way ANOVA with Tukey’s correction. Values indicate means ± SEM; n indicates the number of mice. (B) Serum insulin concentrations during the first 30 mins of a glucose tolerance test in LepR loxP/loxP, LepR TanHet and LepR TanKO mice, 4 weeks after TAT-Cre infusion; two-way ANOVA with Tukey’s correction. Values indicate means ± SEM; n indicates the number of mice. (C) Graph representing serum insulin concentrations at T0 of the glucose tolerance test; two-sided t-test. Values indicate means ± SEM; n indicates the number of mice. (D) Curve representing glycemia during a glucose tolerance test in LepR loxP/loxP and LepR TanKO mice, 12 weeks after TAT-Cre infusion; two-way ANOVA with Tukey’s correction. Values indicate means ± SEM; n indicates the number of mice. (E) Serum insulin concentrations during the first 30 mins of a glucose tolerance test in LepR loxP/loxP and LepR TanKO mice, 12 weeks after TAT-Cre infusion; two-way ANOVA with Tukey’s correction. Values indicate means ± SEM; n indicates the number of mice. (F) Percentage change in basal glycemia during an insulin tolerance test in LepR loxP/loxP and LepR TanKO mice, 12 weeks after TAT-Cre infusion. Two-way ANOVA with Sidak’s multiple comparaison (two-sided unpaired t-test for AUC, inset). Values indicate means ± SEM; n indicates the number of mice. (G) HOMA-IR. Two-sided unpaired t-test. Values indicate means ± SEM; each dot represents a mouse (n=7,5,5,5). (H) Graph representing insulin secretion from total isolated pancreatic islets from LepR loxP/loxP and LepR TanKO mice, 12 weeks after TAT-Cre infusion, following treatment with low or high glucose concentrations. Two-sided unpaired t-test. Values indicate means ± SEM; each dot represents a mouse (n=3,4). (I) Graph representing insulin concentrations in isolated pancreatic islets from LepR loxP/loxP and LepR TanKO mice, 12 weeks after TAT-Cre infusion. Two-way ANOVA with Tukey’s multiple comparaison. Values indicate means ± SEM; each dot represents a mouse (n=3,4). (J) Relative mRNA expression levels of markers of β-cell function and identity in isolated pancreatic islets from LepR loxP/loxP and LepR TanKO mice, 12 weeks after TAT-Cre infusion. A two-sided unpaired Student t-test or Mann-Whitney U test was applied, depending on Shapiro-Wilk normality test results. Values indicate means ± SEM; each dot represents a mouse (n=4,4). (K) Relative mRNA expression levels of ER stress markers in isolated pancreatic islets from LepR loxP/loxP and LepR TanKO mice, 12 weeks after TAT-Cre infusion. A two-sided unpaired Student t-test or Mann-Whitney U test was applied, depending on Shapiro-Wilk normality test results. Values indicate means ± SEM; each dot represents a mouse (n=4,4). (L) Representative confocal images representing nuclei (blue), glucagon (green) and insulin (red) in isolated pancreatic islets from LepR loxP/loxP and LepR TanKO mice, 12 weeks after TAT-Cre infusion illustrating quantifications in M. Scale bar: 50 μm. (M) Graphs representing the ratio between insulin-positive (left) or glucagon-positive area (right) to the total islet surface area in LepR loxP/loxP and LepR TanKO mice, 12 weeks after TAT-Cre infusion. Two-way ANOVA with Tukey’s multiple comparison. Values indicate means ± SEM; each dot represents a mouse (n=4,4). (N) Graph representing the average surface area of pancreatic islets from LepR loxP/loxP and LepR TanKO mice, 12 weeks after TAT-Cre infusion. Mann-Whitney test. Values indicate means ± SEM; each dot represents a mouse (n=4,4). (O) Curve representing glycemia during a glucose tolerance test in LepR loxP/loxP and LepR TanKO mice, before (black and red curves) and after (light and dark blue curves) i.c.v. leptin injection (2μg/animal). Graph represents the area under the curve; one-way ANOVA with Tukey’s correction. Values indicate means ± SEM. The n number of mice is identical in the main graph and bottom right graph, where each mouse is represented by a dot (n=4,4,6,6). (P) Serum insulin concentrations at 15 minutes during the glucose tolerance test presented in (O). A paired two-sided t-test was applied for comparisons between the same group before and after leptin injection and a two-sided unpaired t-test. Values indicate means ± SEM; each dot represents a mouse (n=4,4,6,6).
Figure 7
Figure 7. Loss of LepR expression in median eminence tanycytes alters adrenergic receptor expression in the pancreas and impairs cold-mediated increases in noradrenaline
(A) Serum noradrenaline concentrations in LepR loxP/loxP and LepR TanKO mice, 12 weeks after TAT-Cre infusion. Two-sided unpaired Student’s t-test. Values indicate means ± SEM; each dot represents a mouse (n=7,8). (B) Relative mRNA expression levels of adrenergic receptors in isolated pancreatic islets from LepR loxP/loxP and LepR TanKO mice, 12 weeks after TAT-Cre infusion. Two-sided unpaired Student’s t-test. Values indicate means ± SEM; each dot represents a mouse (n=4 in each group). (C) Rectal temperature mesured in LepR loxP/loxP and LepR TanKO mice, 12 weeks after TAT-Cre infusion, before and after 2h cold exposure. Two-sided paired Student’s t-test. Values indicate means ± SEM; each dot represents a mouse (n=8,8,6,6). (D) Ratio between the delta temperature after-before cold exposure to the serum noradrenaline concentration after cold exposure from LepR loxP/loxP and LepR TanKO mice. Two-sided unpaired Student’s t-test. Values indicate means ± SEM; each dot represents a mouse (n=8,6).

References

    1. Swinburn BA, et al. The Global Syndemic of Obesity, Undernutrition, and Climate Change: The Lancet Commission report. Lancet. 2019;393:791–846. - PubMed
    1. Yoon KH, et al. Epidemic obesity and type 2 diabetes in Asia. Lancet. 2006;368:1681–1688. - PubMed
    1. Ohn JH, et al. 10-year trajectory of beta-cell function and insulin sensitivity in the development of type 2 diabetes: a community-based prospective cohort study. Lancet Diabetes Endocrinol. 2016;4:27–34. - PubMed
    1. Ahima RS, Flier JS. Leptin. Annu Rev Physiol. 2000;62:413–437. - PubMed
    1. de Luca C, et al. Complete rescue of obesity, diabetes, and infertility in db/db mice by neuron-specific LEPR-B transgenes. J Clin Invest. 2005;115:3484–3493. - PMC - PubMed

Publication types