. 2021 Aug;11(8):3518-3534.
doi: 10.21037/qims-20-443.

Tumor elastography and its association with cell-free tumor DNA in the plasma of breast tumor patients: a pilot study

Affiliations

Tumor elastography and its association with cell-free tumor DNA in the plasma of breast tumor patients: a pilot study

Yi Hao et al. Quant Imaging Med Surg. 2021 Aug.

Abstract

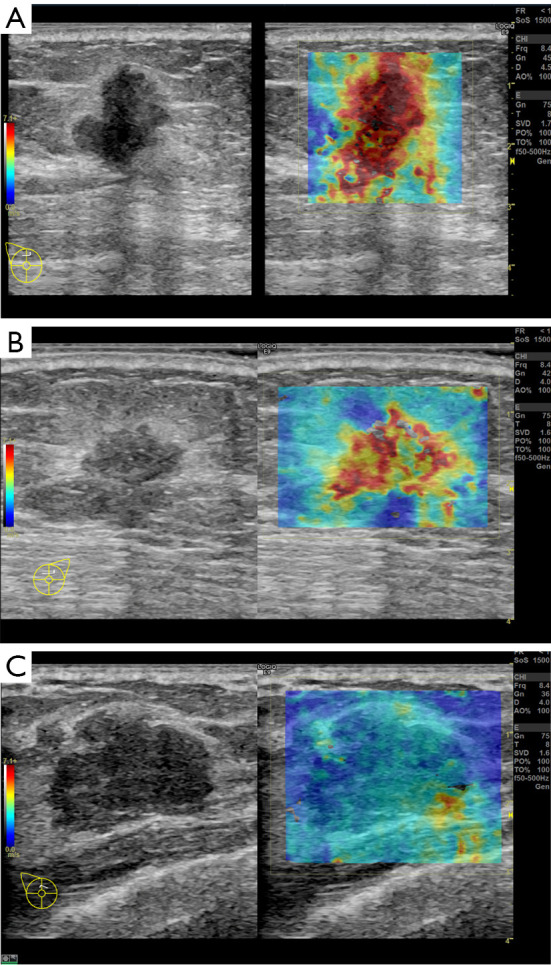
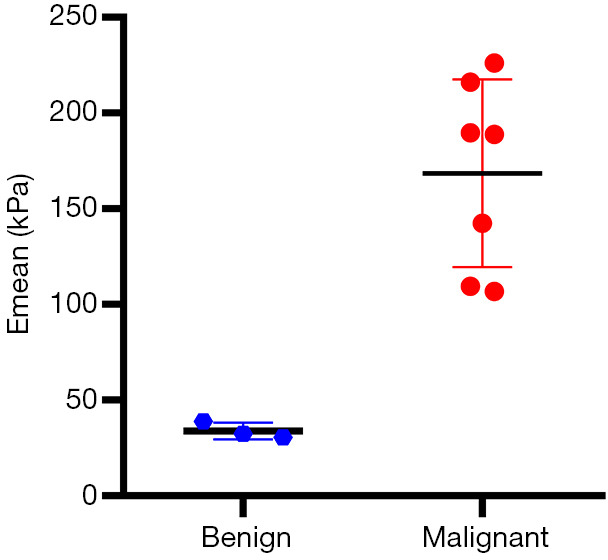
Background: Breast tumor stiffness, which can be objectively and noninvasively evaluated by ultrasound elastography (UE), has been useful for the differentiation of benign and malignant breast lesions and the prediction of clinical outcomes. Liquid biopsy analyses, including cell-free tumor DNA (ctDNA), exhibit great potential for personalized treatment. This study aimed to investigate the correlations between the UE and ctDNA for early breast cancer diagnosis.

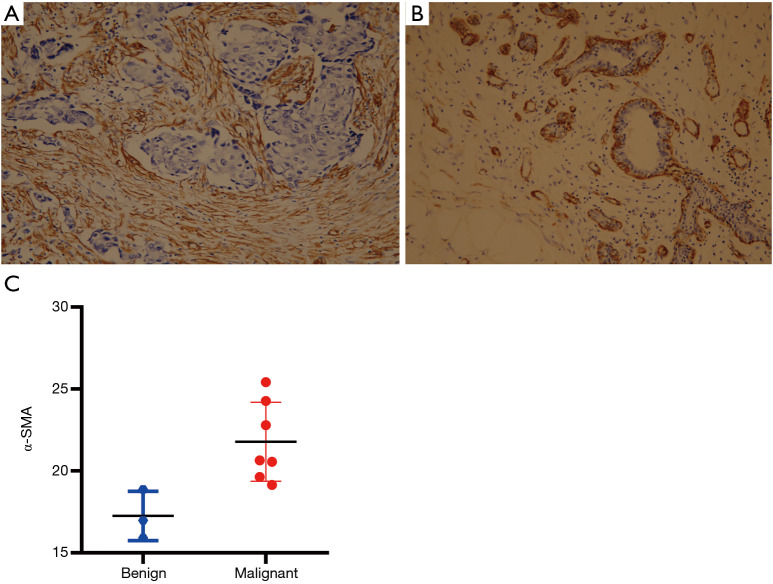
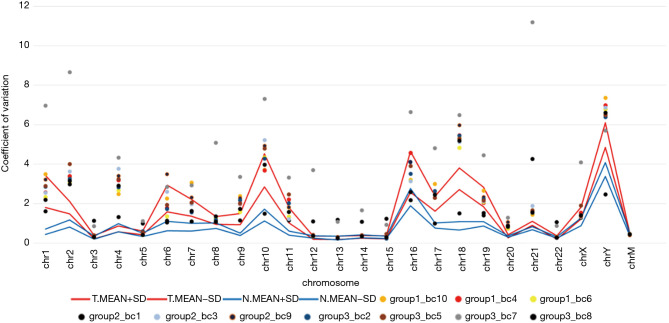
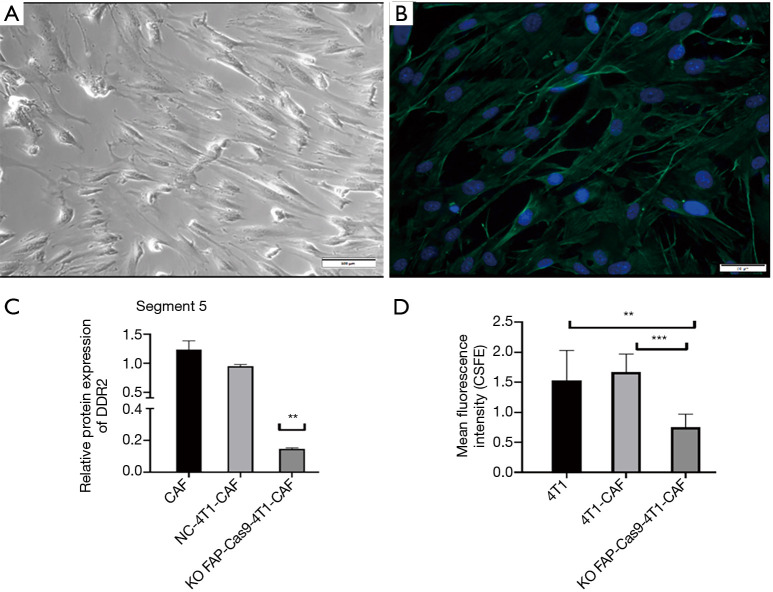
Methods: Breast tumor stiffness in 10 patients were assessed by shear wave elastography (SWE), and the ctDNA of eight collected plasma specimens with different tumor stiffness were analyzed by whole-genome sequencing (WGS). Subsequently, the distribution of carcinoma-associated fibroblasts (CAFs) was investigated by detecting the expression levels of alpha-smooth muscle actin (α-SMA) in tissues of breast lesions. We validated the function of discoidin domain receptor 2 (DDR2) in breast tumor CAFs by knockout of fibroblast activation protein (FAP) with different tumor stiffness during cancer progression in vitro and vivo.

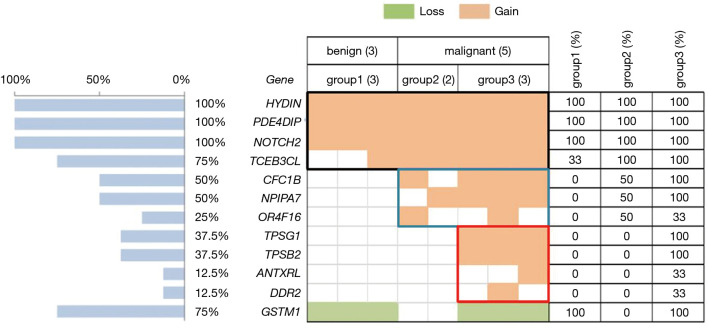
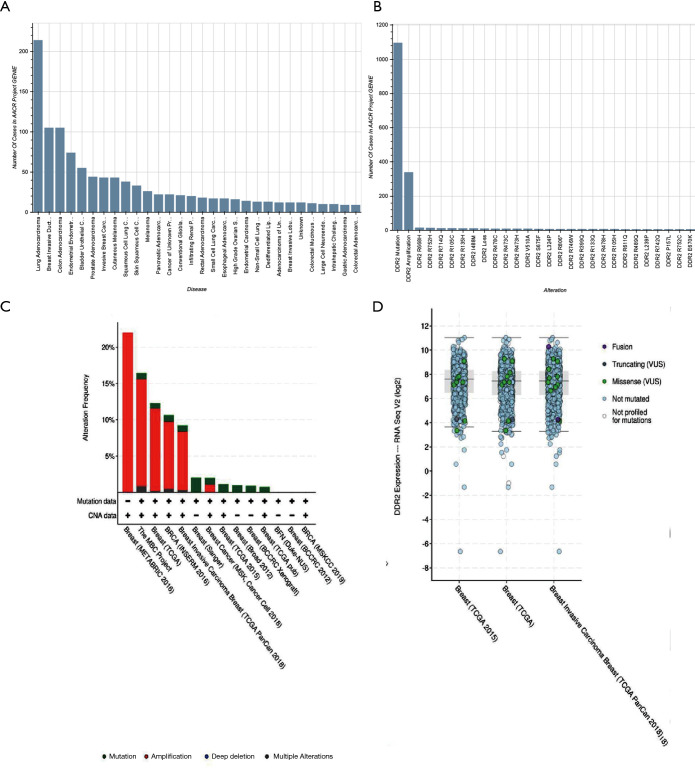
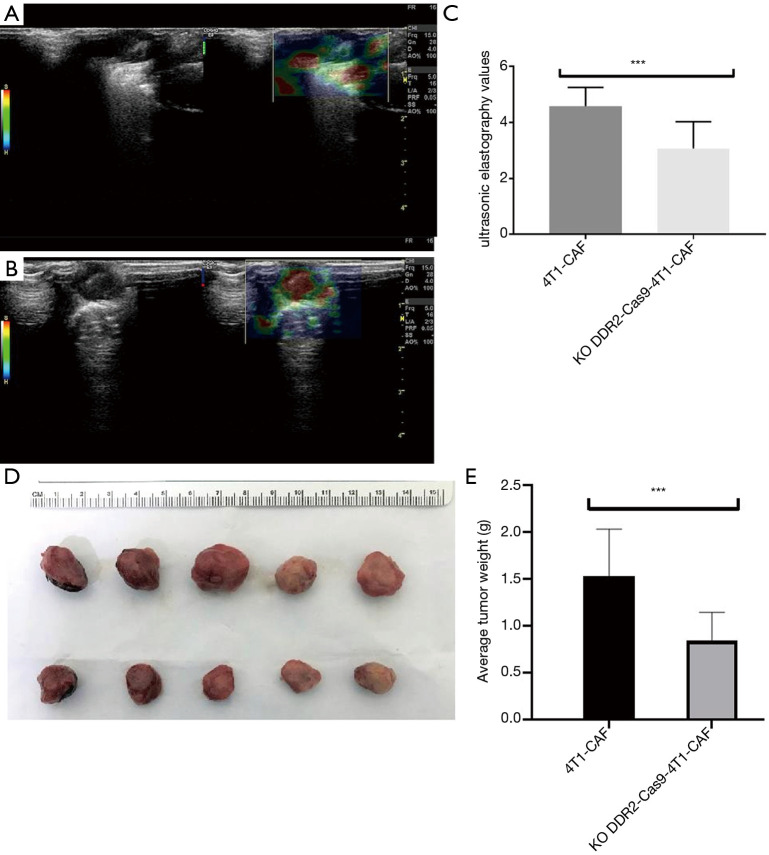
Results: The UE estimates of tumor stiffness positively correlated with CAF-rich (α-SMA+) tumors (P<0.05). Copy number profiles and percent genome alterations were remarkably different between benign and malignant breast lesions. Somatic genomic alterations or structural variants of DDR2, ANTXRL, TPSG1, and TPSB2 genes were identified in ctDNA of plasma from breast lesions with high SWE values and an increase in the CAF content obtained from clinical samples. Deletion of FAP in breast tumor CAFs by CRISPR/Cas9-mediated gene knockout and decreased tumor stiffness resulted in downregulated expression of DDR2 (P<0.05), which in turn led to decreasing the tumor stiffness and carcinogenesis process in vitro and in vivo.

Conclusions: These results have established proof of principle that WGS analysis of ctDNA could complement current UE approaches to assess tumor stiffness changes for the early diagnosis and prognostic assessment of breast cancer.

Keywords: Breast cancer; cell-free tumor DNA (ctDNA); copy number variation (CNV); discoidin domain receptor 2 (DDR2); tumor stiffness.


Conflict of interest statement

Conflicts of Interest: All authors have completed the ICMJE uniform disclosure form (available at http://dx.doi.org/10.21037/qims-20-443). All authors reported this study was supported by the general programs from Shenzhen Science and Technology Innovation Committee (JCYJ20190814110207603, JCYJ20190814111801681); the National Natural Science Foundation of China (81972423); the project of free exploration from Shenzhen Science and Technology Innovation Committee (JCYJ20170307144246792, JCYJ20170307144103633); the clinical research start-up plan of Southern Medical University (LC2016YM018); the Incubation Programme of the National Natural Science Foundation of China from Shenzhen Hospital of Southern Medical University (PY2020ZY02); the Social Public Welfare Project of Science and Technology from Shenzhen Baoan District (2016CX301); the Grant of Shenzhen Key Laboratory of Viral Oncology (ZDSYS201707311140430); and the Grant of Shenzhen Sanming Medical Project (SM201702).

Figures

Figure 1
Figure 1
B-mode (left) and SWE (right) images of breast cancer (A,B) and breast FA (C) in split screen mode. (A) Grade II infiltrating ductal carcinoma. SWE depicts an almost red-colored mass, with an Emean of 149 kPa. (B) Grade II infiltrating ductal carcinoma. SWE depicts a yellow-to-red-colored mass with an Emean of 76 kPa. (C) Breast FA with an Emean of 19 kPa; SWE depicts a blue-to-yellow color for the lesion. SWE, shear wave elastography; FA, fibroadenoma.
Figure 2
Figure 2
The SWE values (Emean) of malignant lesions was significantly higher than that of benign lesions (108.4±35.1 vs. 18.6±4.2 kPa) (P<0.01). SWE, shear wave elastography.
Figure 3
Figure 3
α-SMA expression in malignant and benign breast lesions. (A) The expression of α-SMA in breast cancer stromal cells shows a strong positive signal. (B) The expression of α-SMA in stromal cells of benign breast lesions shows a negative signal. Magnification: 200×, staining method: PV9000. (C) α-SMA was strongly expressed in breast cancer stromal cells in groups 2 and 3 (P<0.05), indicating a decrease in the expression of α-SMA for benign tumors. α-SMA, alpha-smooth muscle actin.
Figure 4
Figure 4
CV of RCs in 10 k windows distributed across all chromosomes. Dots are CVs of every sample (samples marked as group 1 are patients with benign tumors, and other samples are patients with malignant lesions), and lines are upper and lower indicators calculated as the mean ± SD of CVs within the benign tumor and cancer groups. CV, coefficient of variation; RC, read counts; SD, standard deviation.
Figure 5
Figure 5
CNVs of breast tumors. Top, eight cases of breast lesions were divided into benign and malignant groups by pathology results and SWE values (Emean <50 kPa was assigned as benign and 50 kPa as malignant). The malignant cases are further labeled as either group 2 (50 kPa ≤ Emean <150 kPa) or group 3 (Emean 150 kPa). Center, 12 genes associated with cancer that we identified in our study. Colored rectangles indicate the CNV categories seen in the participants. Frame of black, blue, and red indicate copy number amplifications identified in all samples, the malignant group, and just group 3, respectively. Left, the percentage of cases with a CNV in each gene. Right panel, frequency of a CNV in each group. CNVs, copy number variations; SWE, shear wave elastography.
Figure 6
Figure 6
Bioinformatics analysis for DDR2 by online bioinformatics tool My Cancer Genome. The most common alterations of DDR2 in pan-cancer (A,B). Bioinformatics analysis for DDR2 by online bioinformatics tool My Cancer Genome. The most common alterations of DDR2 in breast cancer (C,D). DDR2, discoidin domain receptor 2.
Figure 7
Figure 7
Primary mCAFs were isolated from 4T1-GFP xenograft mice and verified by expression of α-SMA with immunofluorescence (A,B) (A,B: magnification: 400×). The comparison of protein expression of DDR2 in breast tumor CAFs by knocking out FAP via CRISPR/Cas9 technology (C). Cell proliferation was inhibited in breast tumor CAFs with FAP knockout via CRISPR/Cas9 (D). **, P<0.05; ***, P<0.01. CAFs, carcinoma-associated fibroblasts; mCAF, mouse CAF; α-SMA, alpha-smooth muscle actin; DDR2, discoidin domain receptor 2; FAP, fibroblast activation protein.
Figure 8
Figure 8
Deletion of DDR2 by CRISPR/Cas9 technology in breast tumor CAFs results in decreased tumor stiffness measured by UE (A,B,C) and inhibition of tumor growth (D,E). Representative B-mode (left) and UE (right) images in split-screen mode (A,B). ***, P<0.01. DDR2, discoidin domain receptor 2; CAFs, carcinoma-associated fibroblasts; UE, ultrasound elastography; US, ultrasound.

Similar articles

Cited by

References

    1. Butcher DT, Alliston T, Weaver VM. A tense situation: forcing tumour progression. Nat Rev Cancer 2009;9:108-22. 10.1038/nrc2544 - DOI - PMC - PubMed
    1. Levental KR, Yu H, Kass L, Lakins JN, Egeblad M, Erler JT, Fong SF, Csiszar K, Giaccia A, Weninger W, Yamauchi M, Gasser DL, Weaver VM. Matrix crosslinking forces tumor progression by enhancing integrin signaling. Cell 2009;139:891-906. 10.1016/j.cell.2009.10.027 - DOI - PMC - PubMed
    1. Lee JY, Chang JK, Dominguez AA, Lee HP, Nam S, Chang J, Varma S, Qi LS, West RB, Chaudhuri O. YAP-independent mechanotransduction drives breast cancer progression. Nat Commun 2019;10:1848. 10.1038/s41467-019-09755-0 - DOI - PMC - PubMed
    1. Pediconi F, Galati F. Breast cancer screening programs: does one risk fit all? Quant Imaging Med Surg 2020;10:886-90. 10.21037/qims.2020.03.14 - DOI - PMC - PubMed
    1. Deng H, Qi X, Zhang T, Qi X, Yoshida EM, Guo X. Supersonic shear imaging for the diagnosis of liver fibrosis and portal hypertension in liver diseases: a meta-analysis. Expert Rev Gastroenterol Hepatol 2018;12:91-8. 10.1080/17474124.2018.1412257 - DOI - PubMed