

Apparent diffusion coefficient measurement of the parotid gland parenchyma
- PMID: 34341752
- PMCID: PMC8245964
- DOI: 10.21037/qims-20-1178
Apparent diffusion coefficient measurement of the parotid gland parenchyma
Abstract
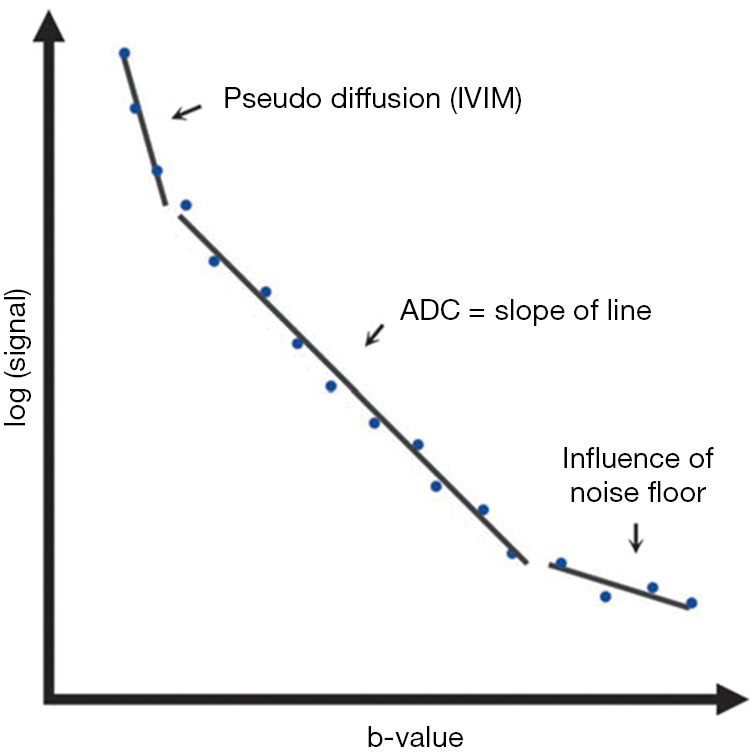
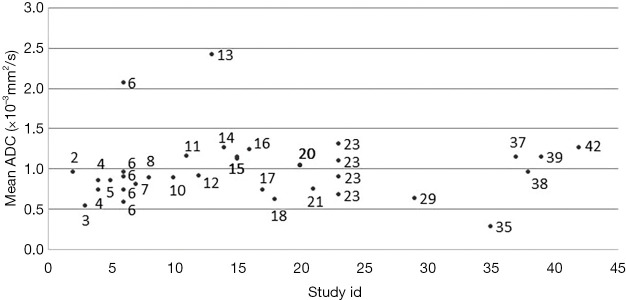
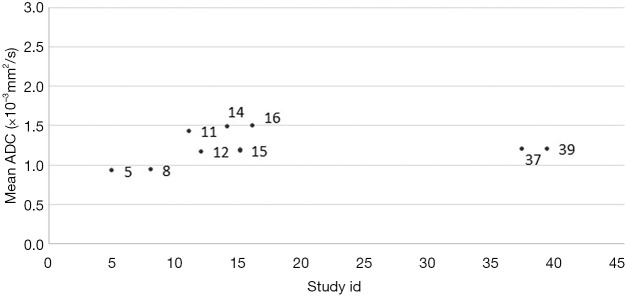
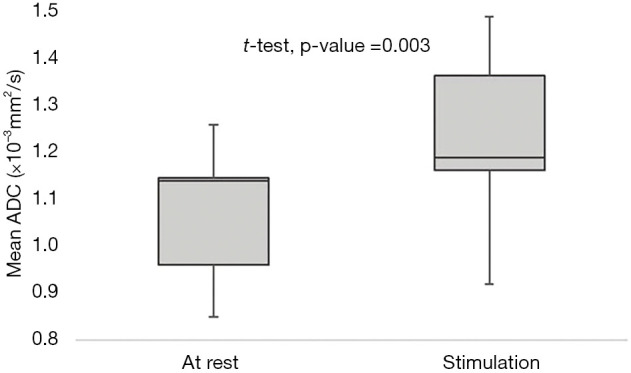
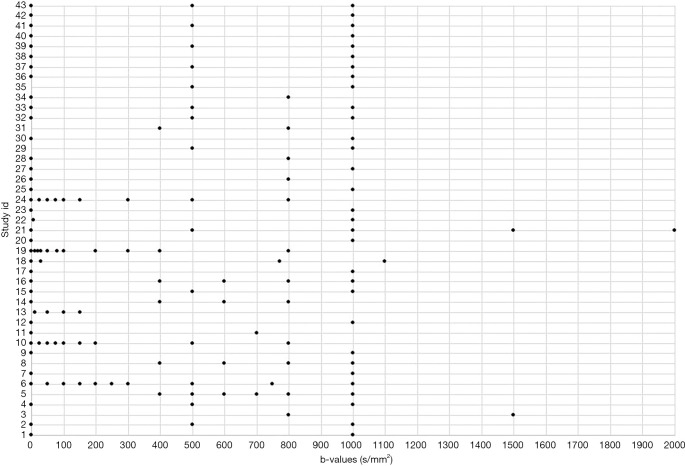
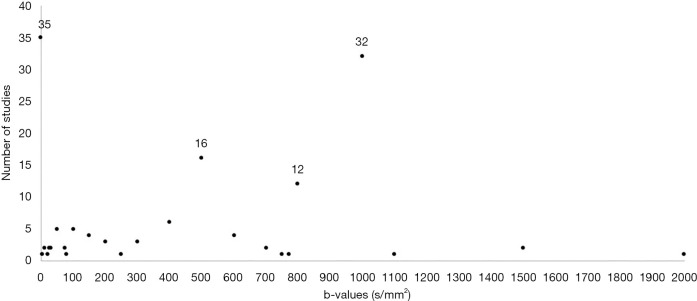
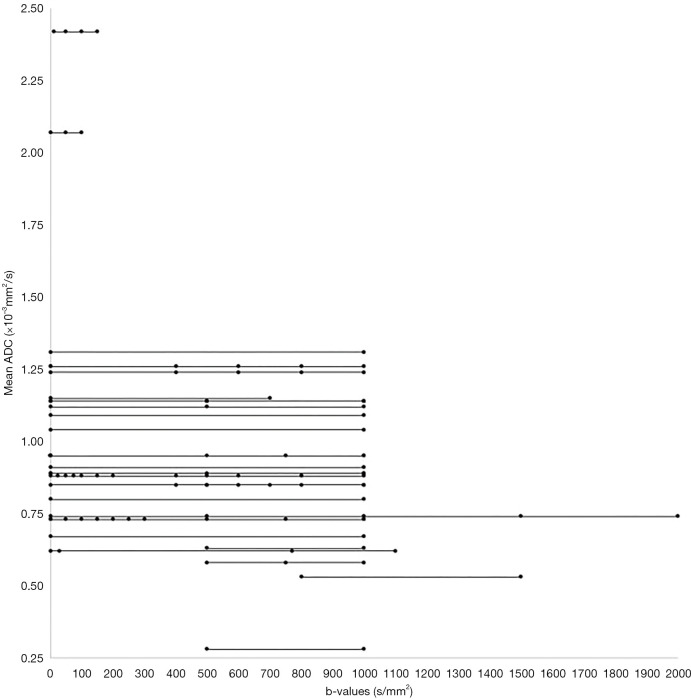
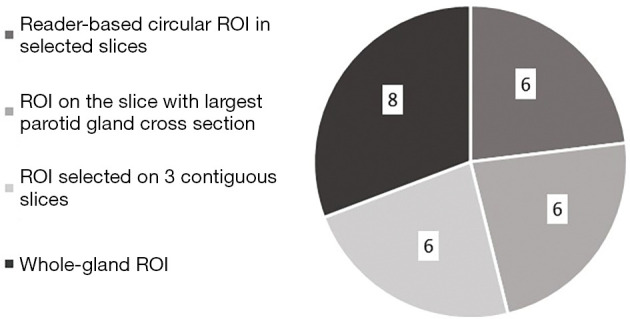
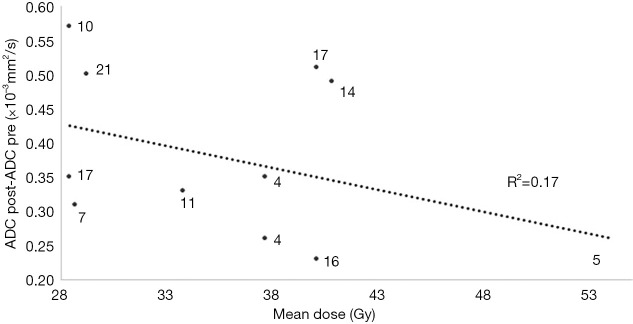
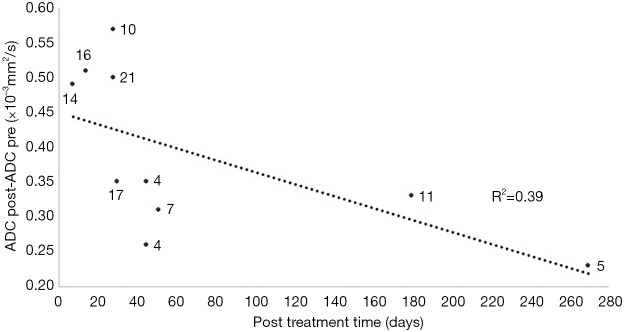
The measurements of apparent diffusion coefficient (ADC) with diffusion weighted magnetic resonance imaging (DW-MRI) is becoming a popular diagnostic and research tool for examination of parotid glands. However, there is little agreement between the reported ADC values of the parotid gland in published literature. In this review 43 studies on ADC measurement of the parotid glands were included. The analyses indicated several possible culprits of the observed ADC discrepancies. For example, DW-MRI examinations under gustatory stimulation gives higher ADC values compared to the unstimulated parotid gland (P=0.003). The diffusion weighting factors (b-values) can either increase (b-value <200 s/mm2) or decrease ADC values (b-values >1,000 s/mm2). The timing of follow-up DW-MRI after radiotherapy (RT) indicates correlation to the found ADC values (R2 =0.39). Interestingly, the choice of regions of interest (ROI) appears not to affect the measurements of ADC (P=0.75). It can be concluded that there is a critical need for standardization of ADC measurement of the parotid glands to allow valid inter-study comparisons and eventually to reach consensus on the use of ADC as biomarker.
Keywords: Diffusion weighted magnetic resonance imaging (DW-MRI); apparent diffusion coefficient; parotid gland parenchyma.
2021 Quantitative Imaging in Medicine and Surgery. All rights reserved.
Conflict of interest statement
Conflicts of Interest: Both authors have completed the ICMJE uniform disclosure form (available at http://dx.doi.org/10.21037/qims-20-1178). The authors have no conflicts of interest to declare.
Figures
Similar articles
-
Functional imaging of parotid glands: diffusion-weighted echo-planar MRI before and after stimulation.Rofo. 2004 Oct;176(10):1385-9. doi: 10.1055/s-2004-813564. Rofo. 2004. PMID: 15383968
-
Diffusion-weighted magnetic resonance imaging to evaluate major salivary gland function before and after radiotherapy.Int J Radiat Oncol Biol Phys. 2008 Aug 1;71(5):1365-71. doi: 10.1016/j.ijrobp.2007.12.011. Epub 2008 Mar 20. Int J Radiat Oncol Biol Phys. 2008. PMID: 18355977
-
Effects of regions of interest methods on apparent coefficient measurement of the parotid gland in early Sjögren's syndrome at 3T MRI.Acta Radiol. 2017 Jan;58(1):27-33. doi: 10.1177/0284185116637245. Epub 2016 Mar 16. Acta Radiol. 2017. PMID: 26987670
-
Magnetic resonance diffusion-weighted imaging: extraneurological applications.Radiol Med. 2006 Apr;111(3):392-419. doi: 10.1007/s11547-006-0037-0. Epub 2006 Apr 11. Radiol Med. 2006. PMID: 16683086 Review. English, Italian.
-
Advanced Diagnostic Methods in Necrotizing Sialometaplasia of the Parotid Glands: An Updated Literature Review and a Rare Case Report.J Clin Med. 2025 Mar 27;14(7):2290. doi: 10.3390/jcm14072290. J Clin Med. 2025. PMID: 40217739 Free PMC article. Review.
Cited by
-
Robust extraction of biological information from diffusion-weighted magnetic resonance imaging during radiotherapy using semi-automatic delineation.Phys Imaging Radiat Oncol. 2022 Mar 7;21:146-152. doi: 10.1016/j.phro.2022.02.014. eCollection 2022 Jan. Phys Imaging Radiat Oncol. 2022. PMID: 35284662 Free PMC article.
-
Semiquantitative magnetic resonance imaging parameters for differentiating parotid pleomorphic adenoma from Warthin tumor.Quant Imaging Med Surg. 2023 Sep 1;13(9):6152-6163. doi: 10.21037/qims-22-1445. Epub 2023 Jul 27. Quant Imaging Med Surg. 2023. PMID: 37711827 Free PMC article.
-
Machine learning-based radiomics for histological classification of parotid tumors using morphological MRI: a comparative study.Eur Radiol. 2022 Dec;32(12):8099-8110. doi: 10.1007/s00330-022-08943-9. Epub 2022 Jun 24. Eur Radiol. 2022. PMID: 35748897 Clinical Trial.
-
Differentiating angiomatous meningioma from atypical meningioma using histogram analysis of apparent diffusion coefficient maps.Quant Imaging Med Surg. 2023 Jul 1;13(7):4160-4170. doi: 10.21037/qims-22-1224. Epub 2023 May 8. Quant Imaging Med Surg. 2023. PMID: 37456320 Free PMC article.
-
Magnetic Resonance Imaging and Spectroscopy Analysis in a Pelizaeus-Merzbacher Disease Rat Model.Diagnostics (Basel). 2022 Aug 2;12(8):1864. doi: 10.3390/diagnostics12081864. Diagnostics (Basel). 2022. PMID: 36010215 Free PMC article.
References
-
- Loimu V, Seppälä T, Kapanen M, Tuomikoski L, Nurmi H, Mäkitie A, Tenhunen M, Saarilahti K. Diffusion-weighted magnetic resonance imaging for evaluation of salivary gland function in head and neck cancer patients treated with intensity-modulated radiotherapy. Radiother Oncol 2017;122:178-84. 10.1016/j.radonc.2016.07.008 - DOI - PubMed
Publication types
LinkOut - more resources
Full Text Sources